
Grey Relational Analysis based Artificial Neural Networks for
Product Design: A Comparative Study
Yang-Cheng Lin
1,2
, and Chung-Hsing Yeh
2
1
Department of Arts and Design, National Dong Hwa University, Hualien 970, Taiwan
2
Faculty of Information Technology, Monash University, Clayton, Victoria 3800, Australia
Keywords: Product Design, Form Design, Artificial Neural Networks, Grey Relational Analysis, Grey Prediction.
Abstract: Artificial neural networks (ANNs) have been applied successfully in a wide range of fields due to its effec-
tive learning ability. In this paper, we propose a grey relational analysis (GRA) based ANN model that can
be used to build a design decision support database for facilitating the product design process and matching
specific consumers’ preferences. The result of an empirical application and a comparative study on fra-
grance bottle form design shows that the ANN models outperform the grey prediction models, indicating
that the ANN technique is promising to help product designers design a new product that best meets con-
sumers’ needs.
1 INTRODUCTION
An artificial intelligent system is defined as an
emerging approach to learning and reasoning with
the human mind in an uncertainty and imprecision
environment (Jang et al., 1997; Lin et al., 2012). The
techniques applied in the artificial intelligent system
are supposed to possess humanlike expertise within
a specific domain, adapt themselves and learn to do
better in changing environments, and explain how
they makes decisions (Jang et al., 1997). As an arti-
ficial intelligent technique, artificial neural networks
(ANNs) have been applied successfully in a wide
range of fields (Lai et al., 2005; Lin et al., 2012;
Negnevitsky, 2002) due to its effective learning abil-
ity.
Shiizuka (2011) has revealed that the 21st centu-
ry is a human-centered century, while the 20th cen-
tury is called a machine-centered century. The key
factor that influences the success of a new product is
capturing the “voice of consumers” (Wang, 2011).
However, how to grasp consumers’ preferences ac-
curately and to design products that match their
needs is indeed a major challenge for product de-
signers (Wang, 2011). To address this challenge, we
adopt the ANN technique in this paper to formulate
a consumer-oriented product design process (Lai et
al., 2005; Lin et al., 2014). Moreover, the grey rela-
tional analysis (GRA) and grey prediction (GP)
technques used in a grey system (Deng, 1982) are
also used in this paper, as they can be used to ex-
plore the relationship between product design ele-
ments and consumers’ preferences, where the infor-
mation available is grey, meaning uncertain and in-
complete (Lai et al., 2005). GRA and GP have been
successfully used in a wide range of fields, including
some research application results highlighting their
effective handling of incomplete known information
for exploring unknown information (Lai et al., 2005;
Lin et al., 2012; Yang, 2011).
In this paper, we conduct an empirical applica-
tion and a comparative study on fragrance bottle
form design by using GRA, ANNs and GP, to find
out what specific technique can be used to help
product designers determine the optimal form com-
bination of product design that best meets consum-
ers’ needs for a desirable product image.
2 METHODOLOGY
In this section, we briefly present the GRA, ANNs,
and GP methods used.
2.1 Grey Relational Analysis (GRA)
A grey system (Deng, 1982) can be built to answer
specific research questions in product design with
respect to product form and product image, which
are grey in essence. This is because there is no way
653
Lin Y. and Yeh C..
Grey Relational Analysis based Artificial Neural Networks for Product Design: A Comparative Study.
DOI: 10.5220/0005577506530658
In Proceedings of the 12th International Conference on Informatics in Control, Automation and Robotics (ANNIIP-2015), pages 653-658
ISBN: 978-989-758-122-9
Copyright
c
2015 SCITEPRESS (Science and Technology Publications, Lda.)

to identify all the product form elements that affect a
particular product image perceived by consumers
(Lai et al., 2005; Yang, 2011). The GRA is used to
determine the relationship (similarity) between two
series of stochastic data in a grey system. One is the
reference series, and the other is the comparison se-
ries. If the GRA value of the element i is higher than
the element j, then the element i is closer to the ref-
erence than the element j. In the application of prod-
uct design, the GRA is used to identify the most in-
fluential elements of product form for a given prod-
uct image (Lai et al., 2005).
2.2 Artificial Neural Networks (ANNs)
Artificial Neural Networks (ANNs) are non-linear
models and are widely used to examine the complex
relationship between input variables and output vari-
ables. The ANNs have been applied successfully in a
wide range of fields, using various learning algo-
rithms (Negnevitsky, 2002). The ANNs are well
suited to formulate the product design process for
matching product design elements (the input varia-
bles) to consumers’ preferences (the output varia-
bles), which is often a black box and cannot be pre-
cisely described (Lai et al., 2005; Lin et al., 2014).
In this paper, we use the multilayered feedforward
ANNs trained with the backpropagation learning al-
gorithm, as it is an effective and the most popular
supervised learning algorithm (Negnevitsky, 2002).
2.3 Grey Prediction (GP)
The GP model uses a grey differential model (GM)
to generate data series from the original data series
of a dynamic system (Deng, 1982). The data series
generated by the GM are converted back to the orig-
inal data series by a reverse procedure to predict the
performance of the system (Lai et al., 2005). Since
the generated data series are more coherent than the
original, the accuracy of the modelling is enhanced.
The GM has three basic operations (Deng, 1982): (1)
accumulated generation, (2) inverse accumulated
generation, and (3) grey modelling. The accumulat-
ed generation operation (AGO) is used to build dif-
ferential equations. The GM is usually represented
as GM(M,N) for dealing with Mth-order differential
equations with N variables (Lai et al., 2005). Since
any higher-order differential equation can be trans-
ferred into a first-order differential equation, we use
the first-order differential equation in this paper.
3 AN EMPIRICAL APPLICATION
This section addresses how the GRA based ANNs
can be used to model the consumer-oriented product
design process. As an illustration, we have conduct-
ed a consumer-oriented experiment on fragrance
bottle form design, due to its wide variety of appear-
ances (Wei et al., 2011; Lin and Wei, 2014).
3.1 The Consumer-oriented
Experiment on Fragrance Bottle
Form Design
In previous studies (Wei et al., 2011; Lin and Wei,
2014), we have investigated and categorized various
world-famous fragrances. As a result of a morpho-
logical analysis, seven product form elements and 21
associated product form types have been identified,
as shown in Table 1 (Wei et al., 2011). The seven
product form elements are “Transparency of bottle
top (x
1
)”, “Shape of bottle top (x
2
)”, “Shape of bottle
body (x
3
)”, “Texture of bottle body (x
4
)”, “Transpar-
ency of bottle body (x
5
)”, “Width ratio of bottle
body (x
6
)”, and “Bottleneck (x
7
)”.
Table 1: The result of morphological analysis.
Type 1 Type 2 Type 3 Type 4 Type 5
Transparen-
cy of bottle
top
(x
1
)
Transpar-
ent
(x
11
)
Opaque
(x
12
)
Shape of
bottle top
(x
2
)
Sphere
(x
21
)
Pie
(x
22
)
Cylinder
(x
23
)
Cuboid
(x
24
)
Irregular
(x
25
)
Shape of
bottle body
(x
3
)
Sphere
(x
31
)
Cylinder
(x
32
)
Cuboid
(x
33
)
Trapezoid
(x
34
)
Texture of
bottle body
(x
4
)
Smooth
(x
41
)
Textured
(x
42
)
Transparen-
cy of bottle
body
(x
5
)
Transpar-
ent
(x
51
)
Matte
(x
52
)
Opaque
(x
53
)
Width ratio
of bottle
body
(x
6
)
Narrow
(x
61
)
Wide
(x
62
)
Bottleneck
(x
7
)
Connected
the bottle
(x
71
)
Independ-
ent bottle-
neck
(x
72
)
No bottle-
neck
(x
73
)
According to the morphological analysis, the
fragrance bottle sample can be coded by the value of
1, 2, 3, 4 or 5, if it has a particular design element
type for each of its seven product form elements, as
shown in Table 2. For each selected fragrance bottle
ICINCO2015-12thInternationalConferenceonInformaticsinControl,AutomationandRobotics
654

sample in Table 2, the first column shows the fra-
grance bottle sample number and Columns 2-8 show
the corresponding type number for each of its seven
product form elements, as given in Table 1. Addi-
tionally, in this paper, we use two image words,
“Quiet-Energetic (Q-E)” and “Rational-Emotional
(R-E)”, to represent consumers’ preferences as
shown in the last two columns of Table 2. Table 2
provides a numerical data source for the quantitative
analyses (GRA, ANNs, and GP), which can be used
to develop a hybrid consumer-oriented model.
Table 2: Product form elements and consumers’
preferences.
No. X
1
X
2
X
3
X
4
X
5
X
6
X
7
Q-E
R
-E
1 2 2 2 1 2 2 2 3.08 3.19
2 2 2 2 1 2 2 2 4.12 4.15
3 2 1 2 1 2 2 2 3.23 5.35
4 2 2 2 1 2 2 2 3.96 2.77
5 2 2 2 1 1 2 1 3.62 3.65
6 1 2 2 1 3 2 2 4.27 3.19
7 1 1 1 1 1 1 2 4.38 5.77
8 1 2 3 2 1 1 2 4.35 5.04
9 2 2 3 1 1 1 2 3.73 3.27
10 2 3 3 1 3 1 2 3.81 1.77
11 2 2 3 1 3 2 2 3.19 2.00
12 2 3 2 1 1 2 1 3.85 3.50
13 2 3 2 1 1 2 1 4.31 3.15
14 2 3 3 1 2 2 1 3.42 3.50
15 2 3 2 1 1 2 3 4.00 5.04
16 2 3 2 1 2 2 3 4.04 4.27
17 2 3 2 1 2 2 3 3.50 2.54
18 2 3 2 2 3 2 3 3.73 5.65
19 2 3 2 1 2 2 3 3.50 4.08
20 2 3 2 2 2 2 3 4.19 3.85
21 2 4 3 1 2 1 3 4.19 4.38
Test 1 2 5 3 1 2 2 3 3.77 3.12
Test 2 2 4 4 1 2 2 3 4.73 5.12
Test 3 2 5 4 1 1 2 2 3.69 4.42
Test 4 2 3 4 1 2 2 2 3.42 4.46
Test 5 2 3 4 2 1 2 2 4.38 5.12
Test 6 1 5 4 2 2 1 2 3.77 3.12
3.2 GRA to Identify the Influential
Product Form Elements
We perform the GRA to determine the most influen-
tial form elements of fragrance bottles for the Q-E
and R-E image words, using the 21 training samples
shown in Table 2. The GRA calculates the grey rela-
tional degree between each comparison series and
the reference series. In this paper, the comparison
series are the seven form elements, whose values are
given in Columns 2-8 of Table 2. The reference se-
ries are the average Q-E and R-E image values re-
spectively, as given in the last two columns of Table 2.
Table 3 shows the GRA value between the image
words and the form elements, with the values rang-
ing from 0 to 1. Each of the seven form elements is
obtained by the GRA. The higher the GRA value,
the more influential the form element. Table 3 shows
that “Shape of bottle top (x
2
)” form element affects
the Q-E and R-E images the most (the highest GRA
value of 0.674 and 0.687, respectively), followed by
“Shape of bottle body (x
3
)” (the GRA value of 0.643
and 0.658). This implies that the product designers
should focus their attention more on these most in-
fluential form elements, when the design objective is
to achieve the desirable Q-E and R-E images.
Table 3: The result of GRA.
GRA Q-E Ranking R-E Ranking
x
1
0.521 7 0.513 7
x
2
0.674 1 0.687 1
x
3
0.643 2 0.658 2
x
4
0.561 4 0.584 5
x
5
0.553 5 0.624 3
x
6
0.522 6 0.536 6
x
7
0.601 3 0.620 4
On the contrary, the product designers can pay
less attention to the less influential form elements,
such as “Transparency of bottle top (x
1
)” (the lowest
GRA value of 0.521 and 0.513, respectively), and
“Width ratio of bottle body (x
6
)” (the GRA value of
0.522 and 0.536), as these form elements contribute
relatively little to the consumers’ preferences of the
Q-E and R-E images on the fragrance bottle form
design.
In this paper, the result of GRA is not only used
to determine the most influential form elements, but
is also used as a basis to construct the ANN and GP
models, as presented in the following section.
3.3 Analysis of ANNs
In order to determine the relationship between the
product form elements and the consumers’ prefer-
ences, we develop nine ANN models (3*3=9), called
ANN, GRA-1-ANN, and GRA-2-ANN, respective-
ly. Each model is associated with the following three
most widely used rules (labelled as -HN1, -HN2,
and -HN3, respectively) (Lai et al., 2005):
GreyRelationalAnalysisbasedArtificialNeuralNetworksforProductDesign:AComparativeStudy
655
(The number of input neurons + the number of output neu-
rons) / 2 (1)
(The number of input neurons * the number of output neu-
rons) ^ 0.5 (2)
(The number of input neurons + the number of output neu-
rons) * 2 (3)
Each rule is used to determine the number of
hidden neurons in the single hidden layer. In the
ANN models, the 21 form types of the seven form
elements in Table 1 are used as the 21 input varia-
bles (neurons). If the fragrance bottle has a particular
form type, the value of the corresponding input neu-
ron is 1; otherwise, the value is 0. The ANN models
combine the two consumers’ preferences as two out-
put neurons, using the average Q-E and R-E image
values respectively. Based on the GRA result, the
GRA-1-ANN models use the six most influential
form elements (i.e. excluding the least influential
form element, the lowest GRA value), while GRA-
2-ANN models use the five most influential form el-
ements (i.e. excluding the two least influential form
elements). Consequently, the GRA-1-ANN models
have 19 input neurons (21-2=19, two form types of
x
1
), and the GRA-2-ANN models have 17 input neu-
rons (21-2-2=17, two form types of x
1
and two form
types of x
6
). Table 4 shows the neurons of the total
nine ANN models, including the input layer, hidden
layer, and output layer.
Table 4: Neurons of the nine ANN models.
ANN models:
Input layer: 21 neurons for 21 types of 7 form elements.
Output layer: 2 neurons for the Q-E and R-E images.
HN1: Hidden layer: 12 neurons, (21+2)/2=11.5=12.
HN2: Hidden layer: 6 neurons, (21*2)^0.5=6.48=6.
HN3: Hidden layer: 46 neurons, (21+2)*2=46.
GRA-1-ANN models:
Input layer: 19 neurons for 19 types of 6 most influential
form elements.
Output layer: 2 neurons for the Q-E and R-E images.
HN1: Hidden layer: 11 neurons, (19+2)/2=10.5=11.
HN2: Hidden layer: 6 neurons, (19*2)^0.5=6.16=6.
HN3: Hidden layer: 42 neurons, (19+2)*2=42.
GRA-2-ANN models:
Input layer: 17 neurons for 17 types of 5 most influential
form elements.
Output layer: 2 neurons for the Q-E and R-E images.
HN1: Hidden layer: 10 neurons, (17+2)/2=9.5=10.
HN2: Hidden layer: 6 neurons, (17*2)^0.5=5.83=6.
HN3: Hidden layer: 38 neurons, (17+2)*2=38.
The 21 fragrance samples in the training set, giv-
en in Table 2, are used to train the ANN models. The
learning rule used is Delta-Rule and the transfer
function is Sigmoid for all layers. Additionally, the
learning rate and momentum are both 0.5. When the
cumulative training epochs are over 10,000, the
training process is completed.
3.4 Analysis of GP
In this paper, we develop six GP models. Each of
two image words has three GP models, called GP,
GRA-1-GP, and GRA-2-GP, respectively. The GP
model includes all the seven form elements identi-
fied from the experimental study, while the GRA-1-
GP model uses the six most influential form ele-
ments (i.e. excluding the least influential form ele-
ment) resulting from GRA. In addition, GRA-2-GP
model uses the five most influential form elements.
The 21 training samples given in Table 2 are used as
the data set for building these six GP models. The
result of GP shows that Equations (4), (5), and (6)
can be used to predict the value of the Q-E image,
while Equations (7), (8), and (9) can be used for
predicting the R-E image.
GP(Q-E)= [3.08-0.337x
1
(1)
(k+1)+1.103x
2
(1)
(k+1)-
0.767x
3
(1)
(k+1)-1.397x
4
(1)
(k+1)+0.298x
5
(1)
(k+1)-
1.646x
6
(1)
(k+1)-0.209x
7
(1)
(k+1)] e
-0.584k
+0.337x
1
(1)
(k+1)-
1.103x
2
(1)
(k+1)+0.767x
3
(1)
(k+1)+1.397x
4
(1)
(k+1)-
0.298x
5
(1)
(k+1)+1.646x
6
(1)
(k+1)+0.209x
7
(1)
(k+1) (4)
GRA-1-GP(Q-E)= [3.08+1.008x
2
(1)
(k+1)-0.890x
3
(1)
(k+1)-
1.268x
4
(1)
(k+1)+0.293x
5
(1)
(k+1)-1.740x
6
(1)
(k+1)-
0.242x
7
(1)
(k+1)] e
-0.628k
-1.008x
2
(1)
(k+1)+0.890x
3
(1)
(k+1)+
1.268x
4
(1)
(k+1)-0.293x
5
(1)
(k+1)+1.740x
6
(1)
(k+1)+
0.242x
7
(1)
(k+1) (5)
GRA-2-GP(Q-E)= [3.08+2.239x
2
(1)
(k+1)+0.050x
3
(1)
(k+1)
-1.005x
4
(1)
(k+1)-4.995x
5
(1)
(k+1)+0.025x
7
(1)
(k+1)] e
-0.201k
-
2.239x
2
(1)
(k+1)-0.050x
3
(1)
(k+1)+1.005x
4
(1)
(k+1)+
4.995x
5
(1)
(k+1)-0.025x
7
(1)
(k+1) (6)
GP(R-E)= [3.19-0.024x
1
(1)
(k+1)+1.133x
2
(1)
(k+1)-
0.085x
3
(1)
(k+1)-2.305x
4
(1)
(k+1)+1.113x
5
(1)
(k+1)-
2.533x
6
(1)
(k+1)-0.684x
7
(1)
(k+1)] e
-0.709k
+0.024x
1
(1)
(k+1)-
1.133x
2
(1)
(k+1)+0.085x
3
(1)
(k+1)+2.305x
4
(1)
(k+1)-
1.113x
5
(1)
(k+1)+2.533x
6
(1)
(k+1)+0.684x
7
(1)
(k+1) (7)
GRA-1-GP(R-E)= [3.19+1.128x
2
(1)
(k+1)-0.097x
3
(1)
(k+1)-
2.289x
4
(1)
(k+1)+1.111x
5
(1)
(k+1)-2.537x
6
(1)
(k+1)-
0.689x
7
(1)
(k+1)] e
-0.713k
-1.128x
2
(1)
(k+1)+0.097x
3
(1)
(k+1)+
2.289x
4
(1)
(k+1)-1.111x
5
(1)
(k+1)+2.537x
6
(1)
(k+1)+
0.689x
7
(1)
(k+1) (8)
GRA-2-GP(R-E)= [3.19-0.003x
2
(1)
(k+1)-2.379x
3
(1)
(k+1)-
0.806x
4
(1)
(k+1)+3.772x
5
(1)
(k+1)-1.836x
7
(1)
(k+1)] e
0.372k
+
0.003x
2
(1)
(k+1)+2.379x
3
(1)
(k+1)+0.806x
4
(1)
(k+1)-
3.772x
5
(1)
(k+1)+1.836x
7
(1)
(k+1) (9)
ICINCO2015-12thInternationalConferenceonInformaticsinControl,AutomationandRobotics
656

4 PERFORMANCE
EVALUATION AND DESIGN
DECISION SUPPORT
To evaluate the performance of the nine ANN and
six GP models developed in this paper in terms of
their prediction ability in determining the combina-
tion of form elements for matching a given set of
image words, the six test samples identified in Table
2 are used. Rows 3 and 4 of Table 5 show the aver-
age image values (i.e. Q-E and R-E) of the six test
samples assessed by 26 participants, which are used
as a comparison base for the performance evalua-
tion. With the six test samples as the input, Table 5
shows the corresponding image values predicted by
using the ANN, GRA-1-ANN, GRA-2-ANN, GP,
GRA-1-GP, and GRA-2-GP models, respectively.
The last column of Table 5 shows the root mean
squared error (RMSE) of these models in compari-
son with the assessed image values. To evaluate the
performance of a model, the RMSE is commonly
used, given as:
RMSE =
x
i
x
0(i )
i1
n
2
n
(10)
where x
i
is the i-th output value predicted by the
model and x
0(i)
is the expected values assessed by the
participants in this paper. If there is no difference or
error between the predicted value and the assessed
value, the RMSE is 0.
The RMSE given in the last column of Table 5 is
normalized, with the values (the assessed values and
the predicted values) being transformed into a value
between 0 and 1. As indicated in Table 5, the RMSE
value of ANN-HN1 model for Q-E image is 0.12.
This result indicates that this model has an accuracy
rate of 88% (100%-12%) for predicting the value of
Q-E image about fragrance bottles. Table 5 shows
that the average RMSE value of GRA-1-ANN-HN1
model (0.14) is the smallest, followed by the ANN-
HN1, ANN-HN2, and GRA-1-ANN-HN3 models
(0.16). It indicates the GRA-1-ANN-HN1 model is
the best or most suitable for modeling the consum-
ers’ preferences about fragrance bottles. Moreover,
it is noteworthy that the RMSE of the ANN models
is smaller than the GP models. This implies that the
prediction performance of the ANN models is better
than the GP models. In other words, the ANN mod-
els are a more effective technique to formulate the
product design process for determining the optimal
combination of product form elements to best match
to desirable product images (Lai et al., 2005).
Table 5: RMSE of the ANN and GP models developed.
Image
Test sample
RMSE
T1 T2 T3 T4 T5 T6
Consumers
Q-E 3.77 4.73 3.69 3.42 4.38 3.77
R-E 3.12 5.12 4.42 4.46 5.12 3.12
ANN-HN1
Q-E 2.79 4.01 3.57 3.81 4.88 4.92 0.12
0.16
R-E 5.32 4.34 4.25 3.35 4.30 4.03 0.19
ANN-HN2
Q-E 3.69 3.72 4.25 4.12 4.71 4.93 0.12
0.16
R-E 3.82 4.23 3.44 3.29 5.22 5.38 0.20
ANN-HN3
Q-E 2.93 4.02 4.22 4.57 5.81 5.57 0.19
0.21
R-E 4.85 4.18 3.48 3.00 3.80 4.71 0.23
GRA-1-
ANN-HN1
Q-E 3.38 3.99 3.92 4.00 4.77 4.68 0.10
0.14*
R-E 3.67 4.26 3.19 3.03 4.76 4.84 0.19
GRA-1-
ANN-HN2
Q-E 2.50 4.12 3.76 4.07 4.98 5.10 0.14
0.17
R-E 3.60 5.09 3.60 3.14 5.23 5.38 0.19
GRA-1-
ANN-HN3
Q-E 2.80 3.89 4.06 4.13 4.99 5.19 0.15
0.16
R-E 4.69 4.28 3.68 3.09 4.90 4.14 0.18
GRA-2-
ANN-HN1
Q-E 3.47 4.76 4.54 4.33 6.00 5.35 0.18
0.17
R-E 4.06 5.03 3.53 3.12 4.84 4.49 0.16
GRA-2-
ANN-HN2
Q-E 2.95 4.86 4.13 3.73 5.43 5.06 0.13
0.17
R-E 3.98 4.67 3.26 2.54 4.37 4.99 0.22
GRA-2-
ANN-HN3
Q-E 3.43 4.83 5.03 4.29 5.68 5.94 0.21
0.20
R-E 4.44 3.76 3.26 2.75 4.23 3.34 0.20
GP
Q-E 1.60 2.43 1.98 2.82 3.57 1.59 0.25
0.28
R-E 1.58 2.20 1.84 2.43 4.16 1.15 0.30
GRA-1-GP
Q-E 1.79 2.68 2.23 3.04 3.76 1.88 0.22
0.26
R-E 1.60 2.22 1.86 2.44 4.18 1.17 0.30
GRA-2-GP
Q-E 0.52 0.92 0.39 1.33 0.61 0.70 0.47
0.34
R-E 2.00 3.07 3.94 2.24 4.30 2.60 0.20
Consequently, product designers can use the
GRA-1-ANN-HN1 model to build a fragrance bottle
design decision support database that can be gener-
ated by inputting each of all possible combinations
(1,440, 2×5×4×2×3×2×3) of product form elements
for generating the associated image values. In other
words, 1,440 design alternatives generated by the
GRA-1-ANN-HN1 model can be chosen to best
match specific consumers’ preferences. Product de-
signers can also specify a desirable image value for a
new fragrance bottle form design, and the design de-
cision support database can then work out the opti-
mal combination of form elements. For example, the
product designer can use a computer-aided design
(CAD) or a computer-aided manufacture (CAM)
system to facilitate the product design in the new
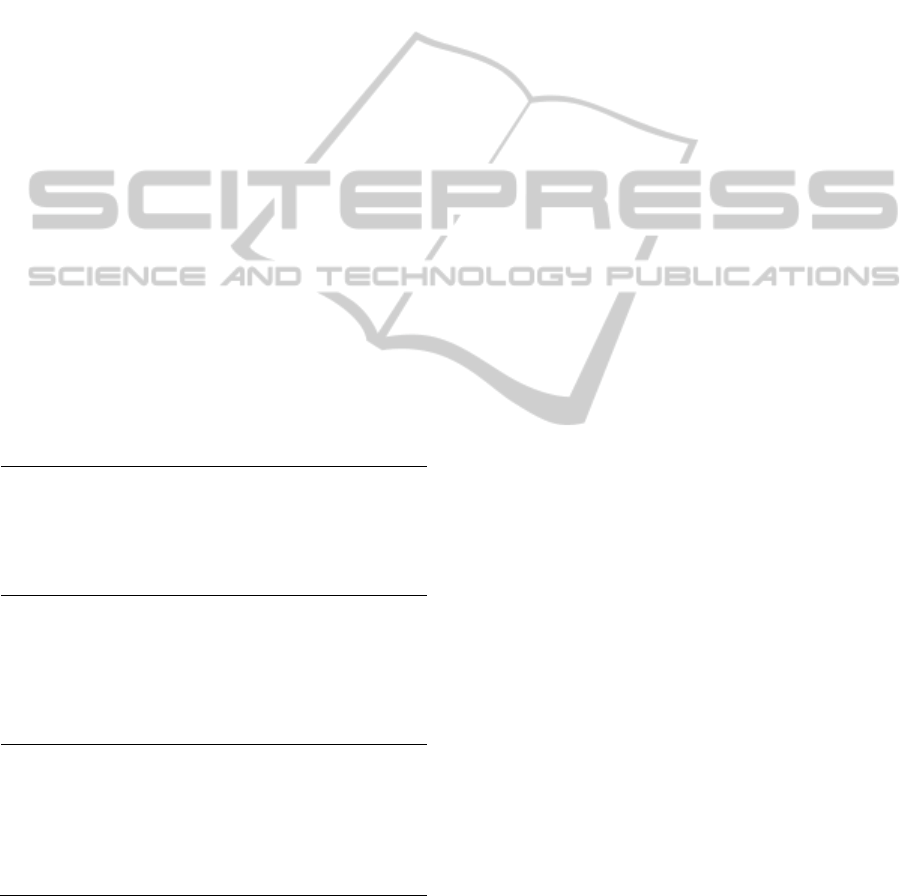
fragrance development process. As an illustration,
Figure 1 shows the new fragrance bottle form design
by CAD/CAM system with “rational” image, and
Table 6 shows its corresponding combination of
form elements (out of 1,440 design alternatives).
GreyRelationalAnalysisbasedArtificialNeuralNetworksforProductDesign:AComparativeStudy
657
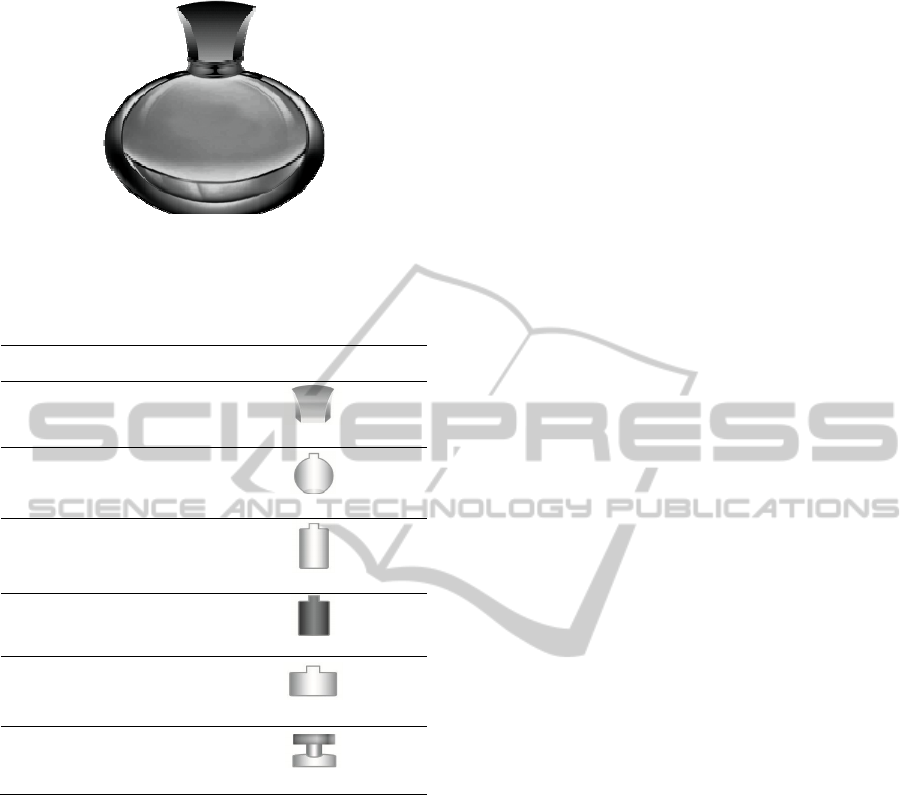
Figure 1: The new fragrance bottle design with the “ra-
tional” image.
Table 6: The optimal combination of form elements for
the new fragrance bottle design with “rational” image.
Form element Form type
x
2
Shape of bottle
top
Irregular (x
25
)
x
3
Shape of bottle
Spheres (x
31
)
x
4
Texture of bottle
Smooth (x
41
)
x
5
Transparency of
bottle
Opaque (x
53
)
x
6
Width ratio of
bottle
Wide (x
62
)
x
7
Bottleneck
Independent bottleneck (x
72
)
5 CONCLUSIONS
In this paper, we have built a GRA-based ANN
model for best matching specific consumers’ prefer-
ences in the fragrance bottle form design. The result
of the comparative study has shown the ANN mod-
els have a higher prediction performance than the
GP models, indicating that the ANN is a promising
technique to model the consumer-oriented product
design process. In addition, the design decision sup-
port database generated by the GRA-based ANN
model can help product designers comprehend con-
sumers’ preferences for a specific form design of
fragrance bottle. Although the fragrance bottle is
chosen as the experimental sample product, the
GRA-based ANN model presented can be applied to
other consumer products with various design elements.
ACKNOWLEDGEMENTS
This research was supported by the Ministry of Sci-
ence and Technology, Taiwan under Grants
MOST103-2221-E-259-036 and MOST104-2918-I-
259-005.
REFERENCES
Deng, J. L., 1982. Control problems of grey system. Sys-
tem and Control Letters, 1, 288-294.
Jang, J.S., Sun, C.T., Mizutani, E., 1997. Neuro-Fuzzy and
Soft Computing, Prentice-Hall, New Jersey.
Lai, H.-H., Lin, Y.-C., Yeh, C.-H., 2005. Form design of
product image using grey relational analysis and neu-
ral network models. Computers and Operations Re-
search, 32, 2689-2711.
Lin, Y.-C., Chen, C.-C., Yeh, C.-H., 2014. Intelligent de-
cision support for new product development: A con-
sumer-oriented approach. Applied Mathematics and
Information Sciences, 8, 2761-2768.
Lin, Y.-C., Wie, C.-C., 2014. The QTT1-based TOPSIS
decision support model to fragrance form design. Pro-
ceedings of IS3C2014, 1291-1294.
Negnevitsky, M., 2002. Artificial Intelligence, Addison-
Wesley, New York.
Shiizuka, H., 2011. Kansei/Affective engineering and de-
cision making. Invited session summary of KES IIMSS
2011.
Wang, K.-C., 2011. A hybrid Kansei engineering design
expert system based on grey system theory and sup-
port vector regression. Expert Systems with Applica-
tions, 38, 8738-8750.
Wei, C.-C., Ma, M.-Y., Lin, Y.-C., 2011. Applying kansei
engineering to decision making in fragrance form de-
sign. Smart Innovation, Systems and Technologies, 10,
85-94.
Yang, C.-C., 2011. Constructing a hybrid kansei engineer-
ing system based on multiple affective responses: Ap-
plication to product form design. Computers and In-
dustrial Engineering, 60, 760-768.
ICINCO2015-12thInternationalConferenceonInformaticsinControl,AutomationandRobotics
658
