
Visitor Dynamics in a Cultural Heritage Scenario
Salvatore Cuomo
1
, Pasquale De Michele
1,2
, Ardelio Galletti
3
, Francesco Pane
1
and Giovanni Ponti
2
1
Department of Mathematics and Applications, University of Naples “Federico II”, Naples, Italy
2
UTICT-HPC, ENEA Portici Research Center, Naples, Italy
3
University of Naples “Parthenope”, Naples, Italy
Keywords:
Computational Neural Models, Clustering, Data Mining, User Profiling, Cultural Heritage.
Abstract:
We propose a biologically inspired mathematical model to simulate the personalized interactions of users with
cultural heritage objects and spaces in the real case of an exhibition. The main idea is to measure the interests
of a spectator with respect to an artwork by means of a model able to describe the users behavioural dynamics.
In our approach, the user is assimilated to a computational neuron, and its interests are deduced by counting
potential spike trains, generated by external currents. As an effort, we relies on an huge amount of log files
that store visitors movements and interactions within a beautiful art exhibition named The Beauty or the Truth
located in Naples, Italy. The technological tools deployed within the exhibition aim to create a novel metaphor
stimulating user enjoyment and knowledge diffusion and the collected log files are useful data to analyse
how such technology an influence and modify user behaviours. We also performed an experimental analysis
exploiting clustering facilities to discover natural groups that reflect visiting styles. This is particularly suitable
to provide the tuning of a heuristic classifier. The obtained results revealed to be particularly interesting also
to understand other important aspects hidden in the data and unattended in our first analysis.
1 INTRODUCTION
In the cultural heritage area, the requirements of inno-
vative tools and methodologies to enhance the quality
of services and to develop smart applications is an in-
creasing requirement. Cultural heritage systems con-
tain a huge amount of interrelated data that are more
complex to classify and analyse. For example, consid-
ering an art exhibition, characterizing, studying, and
measuring the level of knowledge of a visitor with re-
spect to an artwork, and also the dynamics of social
interaction on a relationship network is an interesting
research scenario. To understand and analyse how art-
works observation can influence the social behaviours
is a very hard challenges. Indeed, semantic web ap-
proaches have been increasingly used to organize dif-
ferent art collections not only to infer information
about a cultural item, but also to browse, visualize,
and recommend objects across heterogeneous collec-
tions (Middleton et al., 2003). Other methods are
based on statistical analysis of user datasets in order
to identify common paths (i.e., patterns) in the avail-
able information. Here, the main difficulty is the man-
agement and retrieval of large databases as well as is-
sues of privacy and professional ethics (Kumar et al.,
2010). Finally, models of artificial neural networks,
typical of Artificial Intelligence field are also adopted.
Unfortunately, these approaches seems to be, in gen-
eral, too restrictive in describing complex dynamics
of social behaviours and interactions in the Cultural
Heritage framework (Kleinberg, 2008). In this paper,
we refer to a computational neuroscience terminol-
ogy for which a cultural asset visitor is a neuron and
its interest is the electrical activity which has been
stimulated by appropriate currents. More specifically,
the dynamics of the information flows, which are the
social knowledge, are characterized by neural inter-
actions in biological inspired neural networks. Rea-
soning by similarity, the users can be considered as
neurons in a network and their interests the morphol-
ogy; the common topics among users are the neuronal
synapses; the social knowledge is the electrical activ-
ity in terms of quantitative and qualitative neuronal
responses (spikes). In this context, several works pro-
posed a detailed comparative analysis in order to dis-
cover a reliable strategy to tune the model parameters.
In general, two different strategies can be adopted to
discover data groups: a Bayesian classifier (Cuomo
337
Cuomo S., De Michele P., Galletti A., Pane F. and Ponti G..
Visitor Dynamics in a Cultural Heritage Scenario.
DOI: 10.5220/0005579603370343
In Proceedings of 4th International Conference on Data Management Technologies and Applications (KomIS-2015), pages 337-343
ISBN: 978-989-758-103-8
Copyright
c
2015 SCITEPRESS (Science and Technology Publications, Lda.)

et al., 2014a) and an approach that finds data group-
ings in an unsupervised way (Cuomo et al., 2014b).
Such a strategy resorts to a clustering task employing
the well-known K-means algorithm (Jain and Dubes,
1988). Here we deal with the characterization of user
dynamics and behaviours starting from real datasets.
As a real scenario we have considered the art exhibi-
tion named the Beauty or the Truth located in Naples,
Italy, where new ICT tools and methodologies, pro-
ducing several users behavioural data, have been de-
ployed and currently are still active. Our aim is also to
classify visitors in the exhibit by using data collected
by the available technology. These data are used as
input current of the discussed model. The paper is or-
ganized as follows. In Section 2 we discuss the moti-
vation example. In Section 3 we describe the cultural
heritage information system. The Section 4 is devoted
to the experiments. Finally, the conclusions are drawn
in the Section 5.
2 MOTIVATION EXAMPLE
In order to better understand motivations behind this
work, it is important to deeply analyse the kind of
relations that exists between cultural spaces, people
and technological tools that nowadays are pervasive
in such environments. Accordingly, the behaviour of
a person/visitor, when immersed inside a space and
consequently among several objects, has to be anal-
ysed in order to design the most appropriate ICT ar-
chitecture and to establish the relationship between
people and technological tools that have to be non-
invasive. For this reason, it should be preferable to
provide cultural objects with the capability to interact
with people, environments, other objects and trans-
mitting the related knowledge to users through multi-
media facilities. In an intelligent cultural space, tech-
nologies must be able to connect the physical world
with the world of information in order to amplify the
knowledge but also and especially the fruition, involv-
ing the visitors as active players which offer the plea-
sure of perception and the charm of the discovery of
a new knowledge. In the follow, the architecture of
an Internet of Things (IoT) system, the technological
sensors immersed in the cultural environment and the
communication framework are presented. The sen-
sors aimed to transform cultural items in smart ob-
jects, that now are able to communicate with each
other, the visitors and the network; this acquired iden-
tity plays a crucial role for the smartness of a cul-
tural space. Accordingly, in order that this system can
perform its role and improve end-users cultural expe-
rience transferring knowledge and supporting them,
a mobile application has been designed; in this way
people have the opportunity to enjoy the cultural visit
and be more at ease simply using their own mobile
device. Furthermore, we present an interesting and
wide case study; it consists of a real art exhibition of
271 sculptures, divided into 7 thematic sections and
named “The Beauty or the Truth”
1
. This exhibition
shows, for the first time in Italy, the Neapolitan sculp-
ture of the late nineteenth century and early twentieth
century, through the major sculptors of the time. The
sculptures are exhibited in the beautiful monumental
complex of San Domenico Maggiore, in the historical
centre of Naples. The proposed IoT system was en-
tirely deployed inside the exhibition, as illustrated in
Figure 1.
3 THE CULTURAL HERITAGE
INFORMATION SYSTEM
The overall data collected by the described ICT
framework will be used as the input of our compu-
tational model. In particular the LOG files are struc-
tured in order to store main informations about the
visitor behaviour in the exhibit. The following listing
shows the JSON schema diagram of a log file, charac-
terized by the fruition information w.r.t. the artworks.
1 {
2 " USER " : {
3 " SESSI O N " : [
4 {
5 " S T A R T _ S E S SI O N " : " 29 / 1 2/ 2 0 14 1 6 :1 5
:1 0 : 54 0 " ,
6 " IDU S E R " : " fdb 9 e ab 8 19 aa 3 f7 9 1 41 9 8 66
07 0 4 61 " ,
7 " PLATFOR M ": " A n d r o id " ,
8 " S T A R T _ L A N G " :" it ",
9 " IDEVENT O ": 1 0 ,
10 " R A N K _ E V E N T O ": 2 . 5 ,
11 " N U M B E R _ O P E R A " : " 2 7 1 " ,
12 " T R A N S A C T I O N ": [
13 {
14 " REQUE S T " :{
15 " R E Q U E ST_P A R A M E TE RS " : {
16 " C O D E C R I C K E T ": " [ 1 0 0 0 & Cr i c k e t 0
01 9 & ]" ,
17 " C ODEOPERA " : "1 2 8 ",
18 " DA TE " : " 2 9 / 1 2 /2 0 1 4 1 6 : 15 : 5 1: 8
18 " ,
19 " LANGUAG E ": " it "
20 }
21 },
22 " P A R A M E T ER S_ LO G " : {
23 " R ANK_TEXT " : 2. 5 ,
24 " R A N K _ A U D I O " :2 . 5 ,
1
http://www.ilbellooilvero.it
DATA2015-4thInternationalConferenceonDataManagementTechnologiesandApplications
338
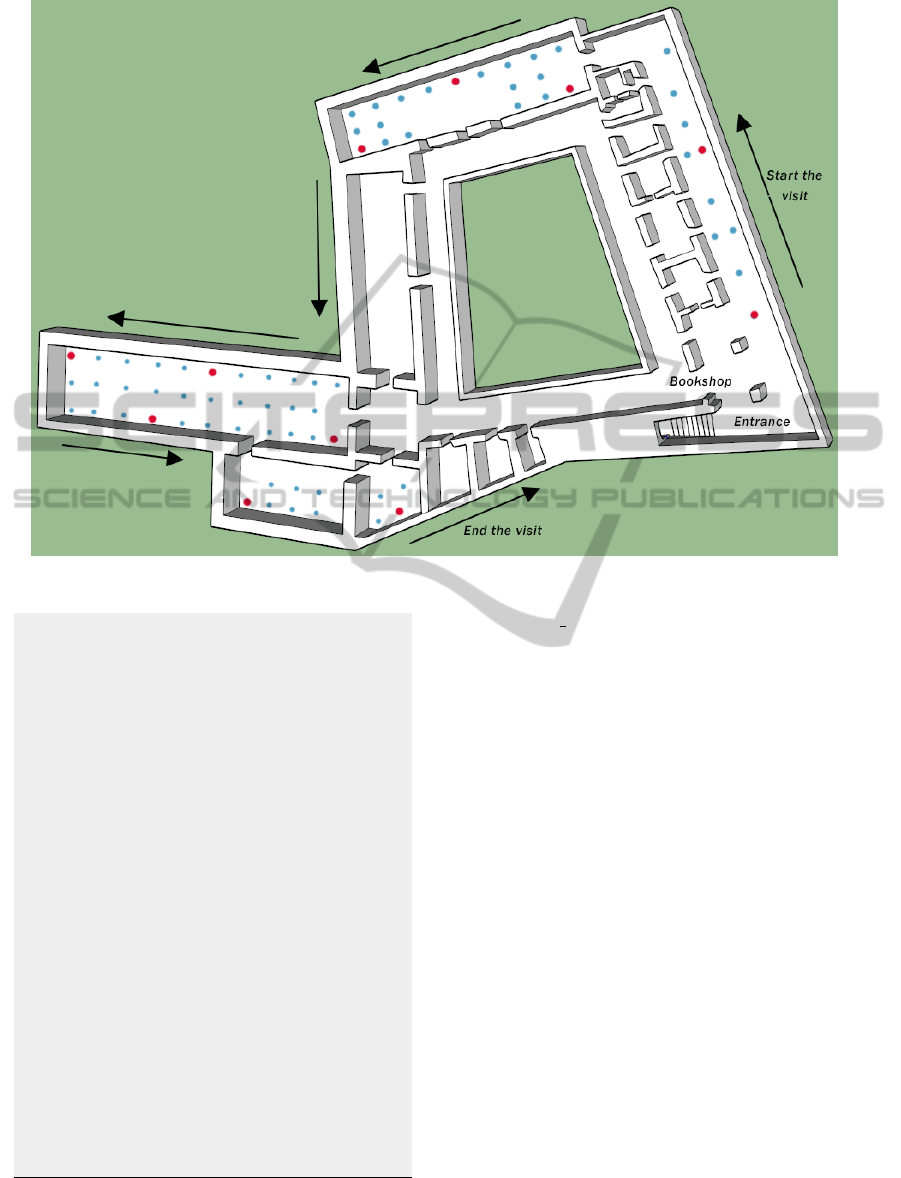
Figure 1: Exhibit map.
25 " R A N K _ G A L L E R Y " : 2 . 5 ,
26 " ACT I O N " : [
27 {
28 " TY PE " : " A U DIO ",
29 " ID " :" 7 3 4" ,
30 " H O U R _ S T A R T " :" 2 9 /1 2 / 2 0 1 4 1 6:
16 : 0 0: 4 4 8" ,
31 " HOUR_EN D ": " 2 9/ 1 2 /2 0 1 4 1 6 : 16
:1 3 : 97 3 " ,
32 " TOT " :" 3 2 .9 2 2 "
33 },
34 {
35 " TY PE " : " I M AGE ",
36 " ID " : "/ M edia / 79 / 1 28 / I mag e / 20
14 -1 0 - 0 8 _ 1 7 -5 0 - 3 4 . j pg "
37 },
38 ...
39 ],
40 " IMG_SIZ E ": 3 ,
41 " A U D I O _ S I Z E " :2 ,
42 " H O U R _ OP ER A_STA R T ": " 2 9 /1 2 / 20 1 4
16 : 1 5: 5 1 :8 1 9 ",
43 " H O U R _ O PE RA _STOP " :" 2 9 / 12 / 2 01 4
16 : 1 6: 1 4 :1 5 "
44 }
45 },
46 . ..
47 }
We can observe, from JSON exam-
ple, that the visitor has viewed the image
2014-10-08 17-50-34.jpg associated to an
artwork. We notice that the exhibition The Beauty or
the Truth is still open and in this paper we analyse
over than 200 log files corresponding to the same
number of users that enjoy the available technological
instruments within such cultural space.
Respect to visitor classification, we start from (Zan-
canaro et al., 2007) where personalized information
presentation in the context of mobile museum guides
are reported. In (Zancanaro et al., 2007) is shown that
visitor movements are compared to the behaviour
of four typical animals. In our work, we adapt this
classification to find how visitors interact with the
ICT technology and how a lot they are interested in
the exhibition. The visitor can be assimilated to:
• an ANT (A), if it tends to follow a specific path
in the exhibit and spends a lot of time using the
furnished technology;
• a FISH (F), if it moves around in the centre of the
room and usually avoids looking at media content
details;
• a BUTTERFLY (B), if it does not follow a specific
path but rather is guided by the physical orienta-
tion of the exhibits and stops frequently to look
for more media content;
• a GRASSHOPPER (G), if it seems to have a spe-
cific preference for some preselected artworks and
VisitorDynamicsinaCulturalHeritageScenario
339

spends a lot of time observing the related media
contents.
In Section 4, we will define a model that, starting from
data in the JSON file, is able to classify the user and
to predict its interest on an artwork or on the overall
exhibit.
4 USER BEHAVIOUR
REPRODUCTION AND DATA
MINING
The experiments described in this Section were car-
ried out from a dataset of 253 regular visitors, and
were performed on CRESCO HPC system (Bracco
et al., 2009), integrated into the ENEA-GRID infras-
tructure, and located in the ENEA Portici Research
Center.
2
. We have tracked the visitor behaviour by us-
ing a suitable Extrapolation Algorithm (EA) that has
the JSON file as input data. A typical EA output is
shown in the following:
IDUser : e7a5774700c1e88e1417618582735
# of artworks: 271
# of viewed artworks: 44
% of viewed artworks : 17.5%
...
-------------------------------------
i-th viewed artwork : 2
ID artwork : 128
Available audio (sec.) : 32.922
Listen audio (sec.) : 32.922
Available images : 3
Viewed images : 0
Available text : True
Viewed text : False
Interaction time (sec.) : 58.259
Path is followed : True
-------------------------------------
...
-------------------------------------
i-th viewed artwork : 6
ID artwork : 17
Available audio (sec.) : 85.141
Listen audio (sec.) : 85.141
Available images : 4
Viewed images : 2
Available text : True
Viewed text : True
Interaction time (sec.) : 103.141
Path is followed : False
-------------------------------------
Such files are particularly suitable to identify
users’ behaviour not only regarding their interactions
2
http://www.cresco.enea.it
with artworks, but also w.r.t. the whole artwork ex-
hibition. In fact, properly looking at the JSON files,
for each user it is possible to determine if the exhibi-
tion path followed, the sequence of visited sections,
the time spent to enjoy audio and images contents,
and if text information about a specific artwork are
visualized or not. It is easy to note that such a set of
information are useful to produce a detailed dataset,
which is most enriched w.r.t. the one exploited in an
our previous work.
This new dataset is suitable for the next step of
our analysis, which consists in executing an unsu-
pervised data mining algorithm in order to achieve
data groups that can reflect the user classification de-
scribed in the previous paragraph. In this direction,
we propose a data structure containing not only user
interaction with the artwork, but also the indication of
how much he follows the path suggested by the exhi-
bition. The dataset structure in ARFF Weka format is
shown in the follow.
@RELATION ARTWORKS
@ATTRIBUTE audios NUMERIC [0..1]
@ATTRIBUTE images NUMERIC [0..1]
@ATTRIBUTE texts NUMERIC [0..1]
@ATTRIBUTE paths NUMERIC [0..1]
@ATTRIBUTE class {A,B,F,G}
@DATA
1,0.190476,0.190476,0.592593,G
0,0,0,0,F
...
0.84131,0.342857,0.114286,0.765432,?
...
0.573139,0.325581,0.697674,0.481481,G
The dataset contains, in its original version,
boolean values for some fields, such as paths and
text. However, it is well known in data mining liter-
ature that boolean fields are particularly critical for al-
gorithms, that may produce inaccurate results in such
cases. To avoid this problem, we propose a strategy
to transform binary fields into continuous ones. For
each binary field, we take into account the ratio be-
tween the number of benefited elements and the total
number of elements, in order to have a percentage of
benefit. A different consideration should be done for
the paths field: to obtain a percentage of following
path for a user, we counts the number of visited sec-
tions that are strictly consecutive, taking into account
only close consecutive section in an increasing order,
and perform the ratio of this count with the total num-
ber of sections.
Let we make an example. Assume that a user fol-
lows this path:
1 → 4 → 5 → 2 → 3 → 6 → 7
DATA2015-4thInternationalConferenceonDataManagementTechnologiesandApplications
340
The count here is 4, as we have 1 → 4 and 3 → 6
are consecutive but not strictly consecutive (the con-
tribute is 0.5 for each of these), while 4 → 5, 2 → 3
and 6 → 7 as strictly consecutive paths (the contribute
is 1 for each of these). Moreover, 5 → 2 are not con-
secutive (the contribute is −1), as the user goes back
to section 2 after visited the section 5). Note that the
count starts from 1. Hence, the percentage of fol-
lowed path is expressed as the ratio
count
#o f sections
=
4
7
= 0.571428
Starting from the data collected in the exhibit, we
classify the visiting behaviours by means of the math-
ematical model and some heuristics. More in detail,
we assume that
• Fs enjoy of almost the 7.5% of the overall media
contents and has a “small” number of spikes;
• Bs enjoy of at least the 50% of the overall media
contents, does not follow a specific path and has a
“medium” number of spikes uniformly distributed
w.r.t. the artworks.
• Gs enjoy of almost the 50% of the overall me-
dia contents, follows a specific path and has
a “medium” number of spikes focused only on
some artworks in the exhibit.
• As enjoy of at least the 70% of the overall media
contents, follows a specific path and has a “large”
number of spikes.
We exploit such a modified dataset for our exper-
iments. In a first phase, we execute the Expectation-
Maximization (EM) algorithm to discover the best
number of clusters for our dataset. The algorithm pro-
duces K = 2 as the number of classes, which indicates
that only two of the four categories described before
are present in our data. With this input, we resorted
to the well-known K-means partitional clustering al-
gorithm (Jain and Dubes, 1988) and set the number of
classes to K = 2. Experiments underline that the two
categories in our data have been correctly identified
with an accuracy of almost 73%.
Investigating more deeply at the dataset, we have
known that they are data from the overall exhibition,
and the two behaviours present are F (i.e., fish), and
G (i.e., grasshopper). This means that users are not
typically interested in exploiting multimedia contents
in all the sections. In fact, in order to have a proof
for our intuition, we decided to take into account only
data from the first two sections of the exhibition. We
discovered here all the four classes, and this indicates
that a user typically enjoys multimedia support only
in the first phase of his visit.
In Table 1 we report the results of the clustering
(with K = 4) for the first two sections of the exhibi-
tion. Note that Cluster0 corresponds to A, Cluster1
is F, Cluster2 represents G and Cluster3 is B, as this
is a typical majority voting based cluster assignment.
We achieved a slight improvement in terms of accu-
racy results (almost 81%). However, this clustering
session provides very interesting intuitions which can
be seen in the table. In fact, the behaviour labelled
with G is the most ambiguous one, as the grasshopper
is very difficult to characterize. Moreover, regarding
A, these tuples are splitted mainly between two clus-
ters, i.e., Cluster0 and Cluster3, but the cluster la-
belling is negatively affected by G tuples. Finally, F
and B are well grouped in their clusters, with ∼ 85%
and ∼ 84% of accuracy, respectively.
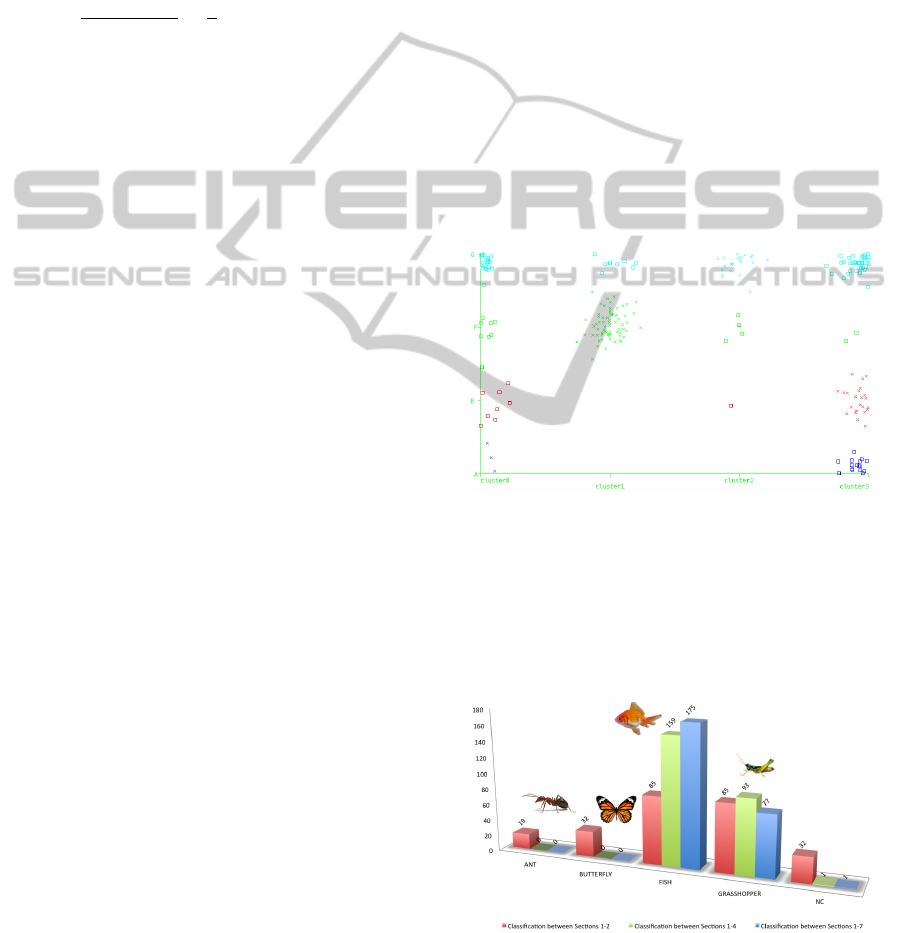
Figure 2 shows the cluster assignments for the tu-
ples in the dataset. Tuples are coloured by the class
attribute, whereas on the axes there are class-ID and
cluster-ID.
Figure 2: Kmeans cluster assignment (K = 4).
We can see in the figure what saw before regard-
ing the difficulty of identifying with high accuracy the
behaviour of some classes, i.e., G (in cyan) and A (in
blue): they are mainly assigned to the right cluster,
but lots of the remaining instances are also present in
the other clusters.
Figure 3: Visitor Metamorphosis.
In Figure 3 we report the visiting styles in the sec-
tions 1 − 2 (red columns), the sections 1 − 4 (green
VisitorDynamicsinaCulturalHeritageScenario
341

Table 1: Results of the clustering for K = 4 for the first two sections of the exhibition.
Animals Cluster0 Cluster1 Cluster2 Cluster3
A 14 11 4 22
B 4 0 1 27
F 7 72 4 2
G 16 9 30 30
columns) and sections 1 − 7 (blue columns) of the
cultural heritage event. For the first 2 sections, we ob-
serve that only the ∼ 7.5% of the users are As, while
the ∼ 12.5% are classified as Bs. Moreover, the users
classified as Fs and Gs are the same amount of the
∼ 33%. The remaining ∼ 12.5% of users are not clas-
sified. Furthermore, from the section 1 to the section
4 we note that all the users become Fs (∼ 63%) or
Gs (∼ 37%). Finally, by observing the blue columns
of the histogram in Figure 3, from the section 1 to the
section 7 (i.e., the entire exhibition) we note that there
is an adjustment of these metamorphosis of the users
in F (∼ 69.5%) and G (∼ 30.5%).
From these experiments we deduce that as the
time spent in the exhibit grows, visitors choose to not
use the available technology in an intensive way. We
deduce that if the event had lasted only 2 sections,
54% of users would continue to use the supplied tech-
nology, instead of the 30.5% on the entire exhibition.
5 CONCLUSIONS
In this paper we have described a framework that re-
flects the computational methodology adopted to infer
information about visitors in a cultural heritage con-
text. Our challenge is to match, in a realistic way, the
biological morphology of a neuron and its behaviour
in this application scenario. In the model we propose,
the (R, C) couple represents the sensitivity of an user
respect to an artwork. Accordingly, we compared two
different strategies for tuning model parameters in or-
der to find an accurate approach that is able to pro-
vide the best setting for the neuronal model. In this
respect, we shown experimental results for standard
Bayesian classifier and a novel clustering methodol-
ogy to obtain starting groups from which these elec-
trical parameters can be tuned. From our experiments,
it has been highlighted that clustering task is able to
produce a more accurate setting.
Starting from the state-of-art about the Museum
visitors’ behaviour patterns, we have investigated how
the use of technological tools within cultural spaces
can affect visitors’ behaviour, causing behavioural
changes also during the same visit. In this particular
case, we have analysed such behaviour modification,
introducing the concept of metamorphosis and show-
ing the analysis results in visitors’ styles.
An interesting observation and challenge for fu-
ture works is to adapt, in a smart way, this computa-
tional framework to many different application topics,
such as the context-aware profiling, feedback based
and/or recommendation systems.
ACKNOWLEDGEMENTS
Authors thank DATABENC, a High Technology Dis-
trict for Cultural Heritage management of Regione
Campania (Italy), and ENEA Portici Research Center,
UTICT-HPC Department, for supporting the paper.
REFERENCES
Bracco, G., Podda, S., Migliori, S., D’Angelo, P., Quintil-
iani, A., Giammattei, D., De Rosa, M., Pierattini, S.,
Furini, G., Guadagni, R., Simoni, F., Perozziello, A.,
De Gaetano, A., Pecoraro, S., Santoro, A., Scio’, C.,
Rocchi, A., Funel, A., Raia, S., Aprea, G., Ferrara, U.,
Novi, D., and Guarnieri, G. (2009). CRESCO HPC
System Integrated into ENEA-GRID Environment. In
Proc. of the Final Workshop of the Grid Projects of
the Italian National Operational Program 2000-2006
– Call 1575, pages 151–155.
Cuomo, S., De Michele, P., and M., P. (2014a). A biologi-
cally inspired model for describing the user behaviors
in a cultural heritage environment. In Proceedings
- Advanced Database Systems (SEBD), 22nd Italian
Symposium on, pages 292–302.
Cuomo, S., De Michele, P., Ponti, G., and M., P. (2014b).
A clustering-based approach for a finest biological
model generation describing visitor behaviours in a
cultural heritage scenario. In Proceedings - Data
Management Technologies and Applications (DATA),
3rd International Conference on, pages 427–433.
Jain, A. and Dubes, R. (1988). Algorithms for Clustering
Data. Prentice-Hall.
Kleinberg, J. (2008). The convergence of social and tech-
nological networks. Commun. ACM, 51(11):66–72.
Kumar, R., Novak, J., and Tomkins, A. (2010). Link Min-
ing: Models, Algorithms, and Applications, chapter
Structure and Evolution of Online Social Network,
pages 337–357. J. Am. Soc. Inf. Sci. Technol.
DATA2015-4thInternationalConferenceonDataManagementTechnologiesandApplications
342

Middleton, S., Shadbolt, N., and De Roure, D. (2003). Cap-
turing interest through inference and visualization:
Ontological user profiling in recommender systems.
In Proceedings - Knowledge Capture, 2Nd Interna-
tional Conference on, pages 62–69.
Zancanaro, M., Kuflik, T., Boger, Z., Goren-Bar, D., and
Goldwasser, D. (2007). Analyzing museum visitors’
behavior patterns. User Modeling 2007 - Lecture Note
in Computer Science, 4511:238–246.
VisitorDynamicsinaCulturalHeritageScenario
343
