Clustering Analysis using Opposition-based API Algorithm
Mohammad Reza Farmani and Giuliano Armano
Department of Electrical and Electronic Engineering, University of Cagliari, Cagliari, Italy
Keywords: Pachycondyla Apicalis Ants, Opposition-based, Clustering Analysis.
Abstract: Clustering is a significant data mining task which partitions datasets based on similarities among data. In
this study, partitional clustering is considered as an optimization problem and an improved ant-based
algorithm, named Opposition-Based API (after the name of Pachycondyla APIcalis ants), is applied to
automatic grouping of large unlabeled datasets. The proposed algorithm employs Opposition-Based
Learning (OBL) for ants' hunting sites generation phase in API. Experimental results are compared with the
classical API clustering algorithm and three other recently evolutionary-based clustering techniques. It is
shown that the proposed algorithm can achieve the optimal number of clusters and, in most cases,
outperforms the other methods on several benchmark datasets in terms of accuracy and convergence speed.
1 INTRODUCTION
Research investigations in different organizations
have recently shown that huge amount of data are
being stored and collected in databases and this large
amount of stored data continues to grow fast.
Valuable knowledge which is hidden in this large
amount of stored data should be revealed to improve
the decision-making process in organizations.
Therefore, a field called knowledge discovery and
data mining in databases has emerged due to such
large databases (Han and Kamber, 2001). Data
mining analysis includes a number of technical
approaches such as classification, data
summarization, finding dependency networks,
clustering, regression, and detecting anomalies
(Amiri and Armano, 2014).
The process of grouping data into classes or
clusters such that the data in each cluster share a
high degree of similarity while being very dissimilar
to data from other clusters is called data clustering.
Generally speaking, hierarchical and partitional
clustering are the two main categories of clustering
methods (Kao et al., 2008). Hierarchical clustering
results in a tree which presents a sequence of
clustering while each cluster is a group of dataset
(Leung et al., 2000). Partitional clustering
decomposes a dataset into a set of disjoint clusters.
Many partitional clustering algorithms try to
minimize some measure of dissimilarity in the
samples within each cluster while maximizing the
dissimilarity of different clusters.
Swarm Intelligence (SI) is an innovative artificial
intelligence category inspired by intelligent
behaviors of insect or animal groups in nature, such
as ant colonies, bird flocks, bee colonies, bacterial
swarms, and so on. Over the recent years, the SI
methods like ant-based clustering algorithms were
successful dealing with clustering problems. Ants
have an incredible optimizing capacity due to their
ability to communicate indirectly by means of
pheromone deposits (Bonabeau et al., 1999). In most
research works, clustering analysis is considered as
an optimization problem and solved by using the
different types of ACO and ant-based algorithms.
The idea is to make a group of ants to explore the
search space of the optimization problems and find
the best candidates of solutions. These candidates
create clusters of the datasets and are selected
according to a fitness function, which evaluate their
quality with respect to the optimization problem.
In order to improve the convergence of the ant-
based clustering algorithm, a combination of the
popular k-means algorithm and the stochastic and
exploratory behavior of clustering ants is proposed
in (Monmarche et al., 1999). An ant system and
ACO, which is based on the parameterized
probabilistic model of the pheromone, is presented
by Dorigo (Dorigo et al., 1999). Slimane et al.
applies explorative and stochastic principles from
the ACO meta-heuristic combined with deterministic
and heuristic principles of k-means (Slimane et al.,
1999). A novel strategy called ACLUSTER is
developed in (Ramos and Merelo, 2002) to deal with
Farmani, M. and Armano, G..
Clustering Analysis using Opposition-based API Algorithm.
In Proceedings of the 7th International Joint Conference on Computational Intelligence (IJCCI 2015) - Volume 1: ECTA, pages 39-47
ISBN: 978-989-758-157-1
Copyright
c
2015 by SCITEPRESS – Science and Technology Publications, Lda. All rights reserved
39
unsupervised clustering as well as data retrieval
problems. Two other ant-based clustering
algorithms, named Ant-Clust and AntTree, are
presented in (Labroche et al., 2003), respectively. In
Ant-Clust, the ants proceed according to chemical
properties and odors to recognize themselves as
similar or not. Both algorithms are applied to
unsupervised learning problems. Hartmann added a
neural network to each ant in his proposed algorithm
which enables the ants to take the objects of their
vicinity as input, and return the move action, the
pick up or drop action, as outputs (Hartmann, 2005).
An advanced clustering algorithm called ant colony
ISODATA is proposed in (Wang et al., 2007) for
applying in real time computer simulation. Ant
clustering algorithm is also used in (Chen and Mo,
2009) to improve k-means and optimize the rule of
ant clustering algorithm.
The API algorithm, named after “apicalis” in
Pachycondyla apicalis, is inspired by a model of the
foraging behavior of a population of primitive ants
(Monmarché et al., 2000). It is demonstrated in
(Aupetit et al., 2006) that API can be applied to
continuous optimization problems and achieved
robust performance for all the test problems. Despite
being powerful, the ant-based algorithms, including
API, can remain trapped in local optimums. This
situation can occur when a certain component is
very desirable on its own, but leads to a sub-optimal
solution when combined with other components.
Moreover, most of the reported ant-based clustering
methods need the number of clusters as an input
parameter instead of determining it automatically on
the run. Many practical situations show that it is
impossible or very difficult to determine the
appropriate number of groups in a previously
unlabeled datasets. Also, if a dataset contains high-
dimensional feature vectors, it is practically
impossible to graph the data for determining its
number of clusters.
This paper has two objectives. First, it attempts
to show that application of the API algorithm in
clustering problems, with a modification of using
Opposition-Based Learning (OBL) in hunting sites
generation, can achieve very promising results. The
improvement is based on the idea of opposition
numbers and attempt to increase the exploration
efficiency of the solution space (Tizhoosh, 2006).
The modification focuses on the initialization of
sites' positions. Second, it tries to determine the
optimal number of clusters in any unlabeled dataset
automatically. A comparison of the proposed
algorithm's results with classical API, and the
reported results of three other automatic clustering
methods including Genetic Algorithm (GA)
(Bandyopadhyay and Maulik, 2002), Particle Swarm
Optimization (PSO) (Omran et al., 2005), and
Differential Evolution (DE) (Das et al., 5008) has
been investigated. The accuracy of the final
clustering results, the capability of the algorithms to
achieve nearly similar results over randomly
repeated runs (robustness), and the convergence
speed are used as the performance metrics in the
comparative analyses.
Organization of the rest of this paper is as follows.
In Section 2, the clustering problem is defined in a
formal language. The API algorithm is shortly
reviewed in Section 3. The proposed algorithm
optimization algorithm and the clustering scheme
used in this study are presented in Sections 4 and 5. A
set of experimental results are provided in Section 6.
Finally, the work is concluded in Section 7.
2 CLUSTERING PROBLEM
Clustering problem consists of dividing a set of data
into different groups based on one or more features
of the data. In the area of machine learning,
clustering analysis is considered as an unsupervised
learning method that constitutes a main role of an
intelligent data analysis process. This tool explores
the data structure and attempt to group objects into
clusters such that the objects in the same clusters are
similar and objects from different clusters are
dissimilar. It is called unsupervised learning
because, unlike classification (known as supervised
learning), no a priori labeling of patterns is available
to use in categorizing the cluster structure of the
whole dataset. As the aim of clustering is to find any
interesting grouping of the data, it is possible to
define cluster analysis as an optimization problem in
which a given function, called the clustering validity
index, consisting of within cluster similarity and
among clusters dissimilarities needs to be optimized.
In every optimization algorithm it is necessary to
measure the goodness of candidate solutions. In this
problem, the fitness of clusters must be evaluated. In
order to achieve this, one given clustering definition
called the clustering validity index has been
considered, that is the objects inside a cluster are
very similar, whereas the objects located in distinct
clusters are very different. Thereby, the fitness
function is defined according to the concepts of
cohesion and separation:
1) Cohesion: The variance value of the objects in a
cluster indicates the cluster’s compactness. In other
ECTA 2015 - 7th International Conference on Evolutionary Computation Theory and Applications
40
words, the objects within a cluster should be as
similar to each other as possible.
2) Separation: The objects inside different clusters
should be as dissimilar to each other as possible. To
achieve this objective, different distance measures
such as Euclidean, Minowsky, Manhatann, the
cosine distance, etc are used as the cluster
separation’s indication (Jain et al., 1999).
The clustering validity index is also used to
determine the number of clusters. Traditionally, the
clustering algorithms were run with a different
number of clusters as an input parameter. Then,
based on the best gained validity measure of the
dataset partitioning, the optimal number of clusters
was selected (Halkidi and Vazirgiannis, 2001). Since
the definitions of cohesion and separation are given,
the fitness function of clustering can be introduced.
There are some well-known clustering validity
indexes in the literature which their maximum and
minimum values indicate proper clusters. Therefore,
these indexes can be used to define the fitness
functions for optimization algorithms. In the current
paper, a validity measure, named CS measure index
(Chou et al., 2004) is employed in the study of
automatic clustering algorithm. This index is
introduced as follows:
First the centroid of the cluster C
i
is calculated as the
average of the elements within that cluster:
∈
=
ij
Cx
j
i
i
x
N
m
1
(1)
Then the CS measure can be formulated as:
{}
{}
[]
=
≠∈
=∈
∈
=
K
i
jiijKj
K
iCX
qi
CX
i
mmd
XXd
N
KCS
ii
iq
1
,
1
),(min
),(max
1
)(
(2)
),(
qi
XXd
is a distance metric between any two data
points
i
X
and
q
X
. The CS measure is also a
function of the sum of within-cluster scatter to
between-cluster separation. It is stated in (Chou et
al., 2004) that while dealing with datasets of
different densities and/or sizes the CS measure is
more efficient than the other measures introduced in
the literature.
3 API ALGORITHM
The API algorithm is inspired by the colonies of P.
APIcalis ants in tropical forests near the Guatemala
border in Mexico (Monmarché et al., 2000). In this
algorithm, a population of n
a
ants
),,,(
21
a
n
aaa
is
located in search space S to minimize objective
function f. API contains two parameters named O
rand
and O
explo
. O
rand
generates a random point (named
nest N) that indicates a valid solution in search space
S according to a uniform distribution and O
explo
generates a new points in the neighbourhood of N
and also hunting sites. In the beginning, the nest
location N placed randomly in the search space
using parameter O
rand
. Then, each ant a
i
of the n
a
ants leaves the nest to create hunting sites randomly
and utilizes O
explo
with an amplitude A
site
(a
i
) of the
neighbourhood centred in N. The A
site
(a
i
) values are
set as:
01.0)(,,01.0
)(,,01.0)1(
×=
×==
a
n
asite
i
sitesite
xnA
xiAA
(3)
where
()
a
n
x
1
01.01=
. Afterwards, local search
starts and each ant a
i
goes to one of its p hunting
sites s' in the neighbourhood of its site s using O
explo
with an amplitude A
local
(a
i
). A
local
(a
i
) is set to
A
site
(a
i
)/10 based on the behaviour of real ants. If
)()( sfsf <
′
, the local search will be considered as
successful (a prey has been caught) and ant a
i
will
memorize point s' and update its memory from s to s'
and does a new exploration in the vicinity of the new
site. On the contrary, a
i
will randomly choose
another site among its p sites saved in memory in the
next exploration. If ant a
i
cannot catch any prey in a
hunting site which has been explored successively
for more than t
local
(a
i
) times, that hunting site will be
forgotten and repeated by a new site created using
O
explo
.
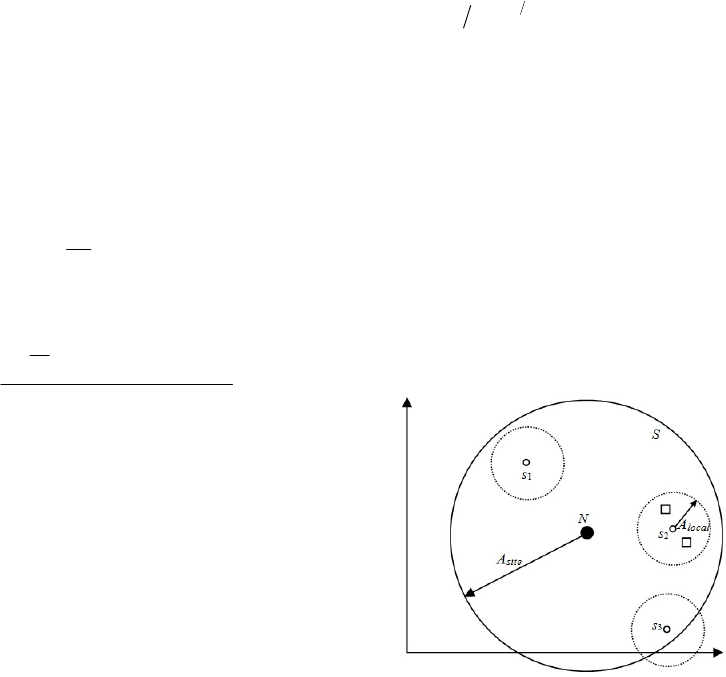
Figure 1: Search space of the API algorithm. s
1
, s
2
, and s
3
are sites randomly generated around nest N and their
maximum distance from the nest being given by A
site
. The
small squares denote local exploration of site s
2
(points
situated at a maximum distance of A
local
from the site
center s
2
).
Clustering Analysis using Opposition-based API Algorithm
41

Then, nest N moves after T movements of the n
a
ants (after every n
a
× T individual moves) and goes
to the best point found since its own last
displacement. Finally, all sites will be erased from
the ants' memories to avoid local minima. It is
presented in Figure 1. how the initial solution space
is divided into smaller search spaces in the AIP
algorithm. The API algorithm usually terminates
after a specific number of iterations or when the
best-so-far solution achieves a desired value.
4 OPPOSITION-BASED API
ALGORITHM
In most instances, Evolutionary Algorithms (EAs)
start with random initial populations and attempt to
lead them toward some optimal solutions. This
searching process usually terminates when EAs meet
some predefined criteria. However, the distance of
these initial guesses from the optimal solutions has a
significant effect on the computation effort and the
obtained solutions' quality. The concept of
Opposition-Based Learning (OBL) is introduced by
(Tizhoosh, 2006) to increase the chance of starting
from fitter initial (closer to optimal solutions) points
in the search space. In the proposed method, the
opposition points of the initial guesses are found
simultaneously. After making a comparison between
initial solutions and their opposites in the search
space, the fitter ones are chosen as the initial
solutions. The judgment between a point and its
opposite position is made based on their
corresponding fitness function values. This
procedure has the potential to improve the
convergence speed and quality of solutions and can
be applied not only to initial points but also
continuously to each solution in the current
population. The concept of opposite point can be
defined as (Tizhoosh, 2006):
Let
),,,(
21 D
xxxX =
be a point in a D-
dimensional space, where
ℜ∈
D
xxx ,,,
21
and
},,2,1{],[ Dibax
iii
∈∀∈
. The opposition point
),,,(
21 D
xxxX =
is defined by its components by:
iiii
xbax −+=
(4)
Now assume that
)( Xf
and
)(Xf
are the
fitness function values which are evaluated
simultaneously to measure the fitness of the main
point X and its opposition position
X
in the search
space. Making a comparison between these two
fitness values we continue the optimization process
with the fitter one. In other words, If
)()( XfXf ≥
then point X can be replaced with
X
; otherwise, the
process will be continued by X.
In this study, we enhance the hunting sites'
creation step of the API algorithm by using OBL
scheme. We choose the original API as the main
algorithm and the proposed opposition-base idea is
embedded in API to improve its performance and
convergence speed.
In this part, we explain the OBL approach added
to the original API algorithm. Based on optimization
literature, the common method to create initial
solutions, in absence of a priori knowledge, is
random number generation. Therefore, as explained
previously, by applying the OBL concept, fitter
starting candidate solutions can be obtained when
there is no a priori knowledge about the solutions.
The implementation of opposition-based
initialization for API can be presented as:
1) Create hunting sites
{
}
a
n
sssS ,,,
21
=
randomly
using O
explo
where
),,(
Djijj
xxs =
and
{}
aiiij
njDibax ,,1},,,2,1{],[ ∈∈∀∈
.
2) Calculate opposite points
{
}
a
n
sososoSo ,,,
21
=
of
the initialized random sites by:
ijiiij
xbaxo −+=
(5)
where
),,(
Djijj
xoxoso =
.
3) Select n
a
fittest hunting sites from
}{ SoS ∪
as
initial hunting sites using fitness function values.
A similar approach is applied to the algorithm
when an ant loses all of its p sites and needs to
create new hunting sites (steps 8-9 in Tab. 1.).
Therefore, after making new sites by that ant,
hunting sites which are ideally fitter than current
created ones will be established in each iteration.
5 CLUSTERING FORMULATION
AND FITNESS FUNCTION
The clustering method we applied in this work is the
scheme proposed by (Das et al. 2008), in which the
chromosomes of a Differential Evolution (DE)
algorithm (Storn and Price, 1997) are assigned to
vectors of real numbers. These vectors contain 2K
max
entries, where K
max
is the maximum number of
clusters specified by user. To control the activation
of each cluster during the clustering process, first
K
max
elements of the defined vectors are assigned to
ECTA 2015 - 7th International Conference on Evolutionary Computation Theory and Applications
42
random positive floating numbers T
i,j
(for jth cluster
center in the ith vector) in [0,1]. These floating
numbers are called activation thresholds. In this
model, if
5.0
,
≥
ji
T
, the jth cluster center in the ith
vector will be used for clustering of the associated
data. In contrast, if
5.0
,
<
ji
T
, the corresponding jth
cluster center will not be considered in the
partitioning process. In other words, T
i,j
's are used as
selection rules in each vector controlling the
activation of cluster centers. The second part of
vectors contains K
max
D-dimensional centroids.
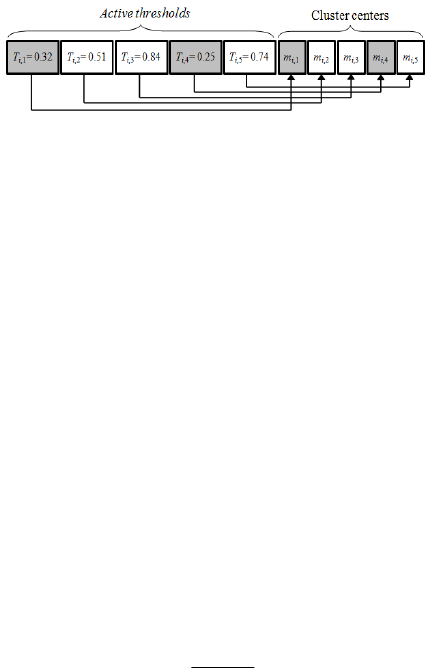
Figure 2 shows a vector with five centroids and their
corresponding activation thresholds. As it can be
seen, only three of those centroids are active (have
activation thresholds more than 0.5) in this vector.
Figure 2: Active thresholds and their corresponding cluster
centroids in vector i (the white and grey centroids are
active and inactive, respectively).
In this scheme, when a new vector is constructed,
the T values are used to active the cancroids of
clusters. If in a vector all T
i,j
's are smaller than 0.5,
two of the thresholds will be selected randomly and
their values will be reinitialized between 0.5 and 1.0
which means the minimum number of clusters in a
vector is 2.
In OBAPI, each clustering vector is considered
as a hunting site. Ants are moving on the search
space and can take or drop centroids according to the
behavioral rules of the algorithm. Then, the nest is
brought closer to the proper hunting sites and ants go
back to new fruitful sites to try another pick up. To
compare the performance of our proposed algorithm
with the performance of other reported algorithms
(Das et al., 2008), we applied the CS measure
introduced in Section 2. Therefore, the fitness
functions is constructed as:
)(
1
KCS
f
i
=
(6)
where CS
i
is the clustering index defined in Eqs. (2).
These index evaluates the quality of the clusters
delivered by vector i. Since all selected centroids
and their opposites are always built inside the
boundary of the dataset, there is no probability of a
division by zero while computing the CS measures.
6 EXPERIMENTAL RESULTS
AND DISCUSSION
6.1 Results and Discussions
In this work, five real world clustering problems
from the UCI database (Blake et al., 1998), which is
a well-known database repository for machine
learning, are used to evaluate the performance of the
Opposition-Based API (OBAPI) algorithm. The
datasets are briefly summarized as (Here, n is the
number of data points, d is the number of features,
and K is the number of clusters):
1) Iris (n = 150, d = 4, K = 3): This dataset with 150
random samples of flowers from the iris species
setosa, versicolor, and virginica consists 50
observations for sepal length, sepal width, petal
length, and petal width in cm.
2) Wine (n = 178, d = 13, K = 3): This dataset is the
results of a chemical analysis of wines grown in the
same region in Italy but derived from three different
cultivars. The analysis determined the quantities of
13 constituents found in each of the three types of
wines. There are 178 instances with 13 numeric
attributes in the wine dataset. All attributes are
continuous and there is no missing attributes.
3) Wisconsin breast cancer (n = 683, d = 9, K = 2):
The Wisconsin breast cancer database has 9 relevant
features: clump thickness, cell size uniformity, cell
shape uniformity, marginal adhesion, single
epithelial cell size, bare nuclei, bland chromatin,
normal nucleoli, and mitoses. The dataset has two
types: benign (239 objects) or malignant (444
objects) tumors.
4) Vowel (n = 871, d = 3, K = 6): This dataset
consists of 871 Indian Telugu vowel sounds. The
dataset has 3 features which are the first, second, and
third vowel frequencies, and 6 overlapping classes
named d (72 objects), a (89 objects), i (172 objects),
u (151 objects), e (207 objects), and o (180 objects).
5) Glass (n = 214, d = 9, K = 6): This dataset
presents 6 different glass types called building
windows float processed (70 objects), building
windows nonfloat processed (76 objects), vehicle
windows float processed (17 objects), containers (13
objects), tableware (9 objects), and headlamps (29
objects), respectively. Each of these types has 9
features: refractive index, sodium, magnesium,
aluminium, silicon, potassium, calcium, barium, and
iron.
The performance of the OBAPI algorithm is
compared with three recently proposed partitional
clustering algorithms called automatic clustering
Clustering Analysis using Opposition-based API Algorithm
43

using an improved deferential evolution (ACDE)
(Das et al., 2008), genetic clustering with an
unknown number of clusters K (GCUK)
(Bandyopadhyay and Maulik, 2002), and dynamic
clustering particle swarm optimization (DCPSO)
(Omran et al., 2002). The improvement effects of
our modified algorithm with normal API have been
also investigated dealing with similar clustering
problems. We used the default parameter settings,
selected in (Monmarché et al., 2000), for all
conducted experiments:
• Number of ants, N
a
= 20.
• Number of iterations (explorations performed
by each ant between two nest moves), T =50.
• Number of hunting sites, p = 2.
• Search number (number of times ant a
i
cannot
catch any prey in a hunting site which has
been explored successively), t
local
(a
i
) = 50, i =
1, ..., N
a
.
For API and OBAPI, the hunting sites (cluster
centroids) are selected randomly between the
minimum and maximum numerical values of any
feature of the datasets. Parameter O
rand
generates a
uniformly distributed random point within those
intervals. Parameter O
explo
is also used to create new
hunting site
),...,(
1 D
xxs
′′
=
′
from site
),...,(
1 D
xxs =
as follows:
[]
DiabAUxx
iiii
,,1)( ∈∀−××+=
′
(7)
where
},,2,1{],[ Dibax
iii
∈∀∈
, U is a uniformly
distributed value within
[]
5.0,5.0 +−
and A is the
maximum amplitude of the move introduced in Eq.
(3). The maximum and minimum number of
clusters, K
max
and K
min
, are set to 20 and 2,
respectively.
In this study, a comprehensive comparison
between the results of the API and OBAPI
algorithms and the results of the ACDE, GCUK, and
DCPSO reported in (Das et al., 2008) has been made
to verify the performance of our proposed approach.
We compare the convergence speed of all the
algorithms by measuring the number of function
calls (NFCs) which is most commonly and fair used
metric in optimization literature. The quality of
obtained solutions, determined by the CS measure,
and ability of the algorithms to find the optimal
number of clusters have been also considered as two
other evaluation metrics. In order to minimize the
effect of the stochastic nature of API and OBAPI on
the metrics, our reported results for each clustering
problem is the average over 40 independent trials
which is equal to the number of independent the
algorithms' runs reported in (Das et al., 2008). The
results of two sets of experiments are presented by
utilizing the five evolutionary clustering algorithms
(API, OBAPI, ACDE, GCUK, and DCPSO) while
CS measure is separately considered as their fitness
function. For a detailed discussion on the parameter
settings and simulation strategy of the ACDE,
GCUK, and DCPSO algorithms please refer to (Das
et al., 2008., Bandyopadhyay and Maulik, 2002,
Omran et al., 2002, and Monmarché et al., 2000) We
implemented both the API and OBAPI algorithms in
Python 2.7.6 on a Intel Core i7, with 2.4 GHz, 8 GB
RAM in Ubuntu 14.04 environment.
In order to compare the accuracy of OBAPI and
API with ACDE, DCPSO, and GCUK, maximum
NFCs is set to
6
10
and considered as the termination
criterion for each clustering algorithm. Afterwards,
final solutions are considered as the number of
clusters found, final value of fitness function, and
two other metrics called inter-cluster and intra-
cluster distances. The inter-cluster distance shows
the average of distances among centroids of the
obtained clusters and the intra-cluster distance
presents the average of distances among data vectors
inside a cluster. To achieve crisp and compact
Table 1: Mean and standard deviation values of average
number of found clusters and CS over 40 independent
trials (NFCs = 10
6
is set as the termination criterion).
Dataset Algorithm
Ave. number of
clusters found
CS value
Iris
OBAPI
3.11±0.05214 0.6122±0.053
API 3.42±0.02451 0.6812±0.142
ACDE 3.25±0.0382 0.6643±0.097
DCPSO 2.23±0.0443 0.7361±0.671
GCUK 2.35±0.0985 0.7282±2.003
Wine
OBAPI 3.16±0.0874
0.9622±0.047
API 3.21±0.0456 0.9132±0.0514
ACDE 3.25±0.0391 0.9249±0.032
DCPSO
3.05±0.0352
1.8721±0.037
GCUK 2.95±0.0112 1.5842±0.328
Breast
Cancer
OBAPI
2.00±0.00
0.4726±0.015
API 2.15±0.0496 0.4869±0.637
ACDE
2.00±0.00 0.4532±0.034
DCPSO 2.25±0.0632 0.4854±0.009
GCUK 2.00±0.0083 0.6089±0.016
Vowel
OBAPI
6.13±0.0421 0.9011±0.624
API 5.77±0.0645 0.9232±0.224
ACDE 5.75±0.0751 0.9089±0.051
DCPSO 7.25±0.0183 1.1827±0.431
GCUK 5.05±0.0075 1.9978±0.966
Glass
OBAPI
6.00±0.00 0.3112±0.647
API 6.11±0.0324 0.4236±0.278
ACDE 6.05±0.0148 0.3324±0.487
DCPSO 5.96±0.0093 0.7642±0.073
GCUK 5.85±0.0346 1.4743±0.236
ECTA 2015 - 7th International Conference on Evolutionary Computation Theory and Applications
44

clusters, the clustering algorithms try to maximize
the inter-cluster distance and minimize intra-cluster
distance, simultaneously. Table 1 and Table 2 show
the average number of found clusters, the final CS
values (Eq. 2), and the inter-cluster and intra-cluster
distances obtained by OBAPI and API and the other
three algorithms. Then, we need to compare the
different algorithms in term of convergence speed.
For each dataset, a cutoff value of CS fitness
function is selected as a threshold. This values is
somewhat larger than the minimum CS fitness
function amount obtained by each algorithm in
Table 1. The NFCs that each algorithm takes to
achieve the cutoff CS fitness function value is given
in Table 3 and Table 4. Best obtained values are
shown in boldface in all the tables.
It is demonstrated in Tabs. 1 and 2 that for the
iris dataset the OBAPI has gained the lowest values
of the final CS measure and the best values of mean
intra- and inter-cluster distances. As discussed in
(Das et al., 2008), the considerable overlap between
two clusters (virginica and versicolor) in the iris
dataset has caused GCUK and DCPSO to gain only
two clusters on average while OBAPI, API, and
Table 2: Mean and standard deviation values of inter- and
intra-cluster distances over 40 independent trials (NFCs =
10
6
is set as the termination criterion).
Dataset Algorithm Mean intra- cluster
distance
Mean inter-cluster
distance
Iris
OBAPI
2.8736±1.542 2.7211±0.362
API
3.2232±0.324 2.4516±0.024
ACDE
3.1164±0.033 2.5931±0.027
DCPSO
3.6516±1.195 2.2104±0.773
GCUK
3.5673±2.792 2.5058±1.409
Wine
OBAPI
4.005±0.004 3.6411±0.324
API
4.096±0.041 3.1123±0.745
ACDE
4.046±0.002 3.1483±0.078
DCPSO
4.851±0.184 2.6113±1.637
GCUK
4.163±1.929 2.8058±1.365
Breast
Cancer
OBAPI
4.3232±0.214 3.2114±0.526
API
4.4568±0.0354 3.0412±2.324
ACDE
4.2439±0.143 3.2577±0.138
DCPSO
4.8511±0.373 2.3613±0.021
GCUK
4.9944±0.904 2.3944±1.744
Vowel
OBAPI
1406.32±9.324 2796.67±0.547
API
1434.85±0.457 2732.11±0.213
ACDE
1412.63±0.792 2724.85±0.124
DCPSO
1482.51±3.973 1923.93±1.154
GCUK
1495.13±12.334 1944.38±0.747
Glass
OBAPI
521.278±65.23 896.31±6.123
API
550.217±14.52 871.35±3.662
ACDE
563.247±134.2 853.62±9.044
DCPSO
599.535±10.34 889.32±4.233
GCUK
594.673±30.62 869.93±1.789
ACDE were successful in finding about three
clusters and among them OBAPI has yielded the
closest value to the real number of iris clusters. For
the wine dataset, all the algorithms have been
outperformed by DCPSO in term of number of
clusters. OBAPI has achieved the best average
values of fitness functions, and intra- and inter-
cluster distances.
It is also observed in Tabs. 1 and 2 that for the
breast cancer dataset, despite the fact that OBAPI,
ACDE, and GCUK were competitively successful to
yield high accurate vales of the number of clusters,
ACDE has outperformed the other algorithms in
terms of the other metrics. As it can be seen the
difference between the final solutions of the two best
algorithms (ACDE and OBAPI) is not significant.
Tables 1 and 2 also show that the OBAPI algorithm
has provided better results than the other four
algorithms dealing with vowel and glass datasets
which consist of large number of data vectors as
well as six overlapping clusters.
Table 3 and Table 4 clearly illustrate the
effectiveness of the proposed OBAPI algorithm
dealing with clustering of the benchmarks. As it is
Table 3: Mean and standard deviation values of NFCs
required by clustering algorithms to reach the defined
cutoff thresholds over 40 independent trials.
Dataset Algorithm Cutoff value for
CS measure
Ave. of required NFCs
Iris
OBAPI
0.95
284567.23±24.36
API
432578.36±84.65
ACDE
459888.95±20.50
DCPSO
679023.85±31.75
GCUK
707723.70±120.21
Wine
OBAPI
1.90
42311.84±77.12
API
66251.32±87.59
ACDE
67384.25±56.45
DCPSO
700473.35±31.42
GCUK
785333.05±21.75
Breast
Cancer
OBAPI
1.10
165278.32±15.36
API
273111.67±14.56
ACDE
292102.50±29.73
DCPSO
587832.50±7.34
GCUK
914033.85±24.83
Vowel
OBAPI
2.50
292487.32±14.36
API
405524.65±32.11
ACDE
437533.35±51.73
DCPSO
500493.15±35.47
GCUK
498354.10±74.60
Glass
OBAPI
1.80
288524.62±74.32
API
408975.41±98.32
ACDE
443233.30±47.65
DCPSO
566335.80±25.73
GCUK
574938.65±82.64
Clustering Analysis using Opposition-based API Algorithm
45

shown, a significantly lower NFCs is needed by our
algorithm to reduce both CS fitness function values
to the cutoff thresholds in all cases. After OBAPI,
ACDE, API, DCPSO, and GCUK have needed
lesser NFCs to achieve cutoff threshold values,
respectively. Moreover, OBAPI has yielded the best
amount of mean intra- and inter-cluster distances
over most datasets.
To conclude, the obtained results indicate that
OBAPI surpass normal API on the clustering of all
the benchmarks. The OBL method applied to the
API led to accuracy improvements in most
clustering problems and convergence speed-ups
reaching about 33%. It is interesting to see that
improvements of the convergence speed were
relatively similar for all benchmark datasets. In
contrast, OBAPI was not as successful as ACDE
dealing with the breast cancer dataset in term of
accuracy. In general, it seems that OBL performs
well with the more difficult problems, as it helps the
learning process. These results are very encouraging,
as they demonstrate that opposition can help
improve performance. However, it is important to
Table 4: Mean and standard deviation values of inter- and
intra-cluster distances required to reach to reach the
defined cutoff thresholds in Table 3 over 40 independent
trials.
Dataset Algorithm Mean intra- cluster
distance
Mean inter-cluster
distance
Iris
OBAPI
3.3145±0.471 2.8674±0.547
API
3.9124±0.841 2.0456±0..875
ACDE
3.7836±0.509 2.0758±0.239
DCPSO
3.9637±1.666 2.0093±0.795
GCUK
3.9992±2.390 1.9243±1.843
Wine
OBAPI
3.9165±0.874 3.5211±0.0774
API
4.6232±0.547 2.8765±0.145
ACDE
4.9872±0.148 3.1275±0.0357
DCPSO
4.0743±0.093 1.9967±1.828
GCUK
5.9870±1.349 2.1323±1.334
Breast
Cancer
OBAPI
5.1221±0.132 2.8011±0.411
API
5.43266±0.025 2.832±0.741
ACDE
4.9744±0.105 3.0096±0.246
DCPSO
5.6546±0.241 2.1173±0.452
GCUK
8.0442±0.435 2.0542±1.664
Vowel
OBAPI
1475.32±0.852 2932.64±1.459
API
1482.65±0.741 2687.57±0.573
ACDE
1494.12±0.378 2739.85±0.163
DCPSO
1575.51±3.786 1923.93±1.154
GCUK
1593.72±1.789 2633.45±1.213
Glass
OBAPI
572.326±65.78 861.56±0.901
API
600.985±42.32 852.11±0.324
ACDE
590.572±34.24 853.62±0.44
DCPSO
619.980±15.98 846.67±0.804
GCUK
615.88±20.95 857.34±1.465
consider here that OBAPI performs better than
normal API according to the current comparison
strategies as well.
6.2 Pros, Cons, and Future Works
The obtained results show that the enhanced OBAPI
technique has a good performance and is very
promising. In fact, this method can significantly
decrease the number of function evaluations in
comparison with the original API and other
evolutionary techniques without having bad effects
on the quality of solutions. Moreover, OBAPI is able
to automatically find the optimal number of clusters
and does not need to know them in advance. I is
important to note that the results gained in this work
are only examined and valid for five numerical test
functions. In other words, the proposed
approximation technique within API algorithm
makes a heuristic method which is only designed
and studied for solving the introduced problems.
This method also does not add any new parameter to
conventional form of the algorithm. As a part of our
future work we plan to improve and study the
opposition-based technique in order to solve high
dimensional optimization problems with minimum
decrease in quality of results.
Computational complexity analysis of OBAPI is
also another task that we decide to perform in the
future. The main disadvantage of OBAPI is its
computational cost which basically is due to the
evolutionary nature of this method. Therefore, in
order to gain a deeper understanding of when
OBAPI is expected to work well (or poorly) for a
given complex problem and why, its computational
time complexity should be analyzed. It is still
unclear how powerful theoretically OBAPI is in
solving high dimensional clustering problems, and
where the real theoretical power of OBAPI is in
comparison with more traditional deterministic
algorithms. Impact of the parameters on the average
computation of OBAPI is another aspect that must
be analyzed. Especially, proper number of ants and
hunting sites bring robustness and efficiency to
OBAPI and it is important to compare different
values theoretically.
To conclude, experimental studies will be carried
out to validate and complement our theoretical
analysis. The expected outcomes of this method will
not only deepen our understanding of how and when
OBAPI works, but also guide the design of more
efficient algorithm in practice.
ECTA 2015 - 7th International Conference on Evolutionary Computation Theory and Applications
46
7 CONCLUSIONS
The main motivation for the current work was
utilizing the notion of opposition values to accelerate
an ant-based algorithm called API (after the name of
Pachycondyla APIcalis ants) for crisp clustering of
real-world datasets. The performance of the
proposed algorithm is studied by comparing it with
three different state-of-the-art clustering algorithms
and original version of API. The obtained results
over five benchmark datasets show that the
enhanced API algorithm, called OBAPI, is able to
outperform four other algorithms over a majority of
the datasets. The proposed method can significantly
decrease the number of function evaluations while
improving the quality of solutions in most cases
without adding any new parameter to the original
API. The proposed technique makes a heuristic
method which is only studied for clustering datasets
with average number of features.
REFERENCES
Aupetit, S., Monmarché, N., Slimane, M., Liardet, P.,
2006. An Exponential Representation in the API
Algorithm for Hidden Markov Models Training,
Artificial Evolution, Lecture Notes in Computer
Science (3871) 61-72.
Amiri, A. M., Armano. G., 2013. Early diagnosis of heart
disease using classification and regression trees, The
2013 International Joint Conference on Neural
Networks (IJCNN), IEEE 1-4.
Amiri, A. M., Armano. G., 2014. A Decision Support
System to Diagnose Heart Diseases in Newborns,
2014. 3rd International Conference on Health Science
and Biomedical Systems (HSBS 2014) NANU 16-21.
Bandyopadhyay, S., Maulik, U., 2002. Genetic clustering
for automatic evolution of clusters and application to
image classification, Pattern Recognition (35) 1197–
1208.
Blake, C., Keough, E., Merz, C. J., 1998. UCI Repository
of Machine Learning Database. [Online]. Available:
http://www.ics.uci.edu/~mlearn/MLrepository.html
Bonabeau, E., Dorigo, M., Theraulaz, G., 1999. Swarm
Intelligence: From Natural to Artificial Systems,
Oxford University Press, New York.
Chen, Q., Mo, J., 2009. Optimizing the ant clustering
model based on k-means algorithm, in: Proceeding of
the 2009 WRI World Congress on Computer Science
and Information Engineering, 699–702.
Chou, C. H., Su, M. C., Lai, E., 2004. A new cluster
validity measure and its application to image
compression, Pattern Analysis and Applications (7)
205–220.
Das, A., Abraham, A., Konar, A., 2008. Automatic
clustering using an improved differential evolution
algorithm, IEEE Tran. on Systems, Man, and
Cybernetics (38) 218–237.
Dorigo, M., Caro, G. D., Gambarella, L. M., 1999. Ant
algorithms for discrete optimization, Artificial Life (5)
137–172.
Halkidi, M., Vazirgiannis, M., 2001. Clustering validity
assessment: finding the optimal partitioning of a
dataset, in: Proceeding of IEEE ICDM, San Jose, CA,
187–194.
Han, L., Kamber, M., 2001. Data Mining: Concepts and
Techniques, Morgan Kaufmann, San Francisco, USA.
Hartmann, V., 2005. Evolving agents swarms for
clustering and sorting, in: Genetic Evolutionary
Computation Conference, GECCO, ACM Press,
Prague, Czech Republic, 217–224.
Jain, A. K., Murty, M. N., Flynn, P. J.,1999. Data cluste-
ring: A review, ACM Comput. Surv. (31) 264–323.
Kao, Y. T., Zahara, E., Kao, I., 2008. A hybridized
approach to data clustering, Expert Systems with
Applications (34) 1754–1762.
Labroche, N., Monmarche, N., Venturini, G., 2003.
Antclust: ant clustering and web usage mining, in:
Genetic and Evolutionary Conference, Chicago,25–36.
Leung, Y., Zhang, J., Xu, Z., 2000. Clustering by scale-
space filtering, IEEE Transaction on Pattern Analysis
and Machine Intelligence (22) 1396–1410.
Monmarché, N., Venturin, G., Slimane, M., 2000. On how
Pachycondyla apicalis ants suggest a new search
algorithm, Future Gener Comput Syst (16) 937–946.
Monmarché, N., Slimane, M., Venturini, G., 1999. On
improving clustering in numerical databases with
artificial ants, Advances in Artificial Life 626–635.
Omran, M., Salman, A., Engelbrecht, A., 2005. Dynamic
clustering using particle swarm optimization with
application in unsupervised image classification, in:
Proceedings of the 5thWorld Enformatica Conference
(ICCI), Cybernetics and Informatics, International
Institute of Informatics and Systemics, Prague, Czech
Republic, 398–403.
Ramos, V., Merelo, J., 2002. Self-organized sstigmergic
document maps: environment as a mechanism for
context learning, in: E. Alba, F. Herrera, J. J. Merelo
et al. Eds, AEB2002, First Spanish Conference on
Evolutionary and Bio-inspired Algorithms,
Rockefeller University, Spain, 284–293.
Slimane, N., Monmarche, N., Venturini, G., 1999. Atclass:
discovery of clusters in numeric data by an
hybridization of an ant colony with k-means
algorithm, in: Rapport interne 213, Laboratoire
d’Informatique de l’Universite de Tours, E3i Tours.
Storn, R., Price, K., 1997. Differential evolution - A simple
and efficient heuristic for global optimization over
continuous spaces, Journal of Global Optimization
(11) 341–359.
Tizhoosh, H. R., 2006. Opposition-based reinforcement
learning, Journal of Advanced Computational Intelli-
gence and Intelligence Informatics (10) 578–585.
Wang, Y., Li, R., Li, B., Zhang, P., Li, Y., 2007. Research
on an ant colony isodata algorithm for cluster analysis
in real time computer simulation, in: Proceeding of
Second Workshop on digital Media and its
Application in Museum and Heritage, 223–229.
Clustering Analysis using Opposition-based API Algorithm
47
