Visualizing Cultural Digital Resources using Social Network Analysis
Antonio Capodieci
1
, Daniele D’Aprile
1
, Gianluca Elia
1
, Francesca Grippa
2
and Luca Mainetti
1
1
University of Salento, Via per Monteroni snc, Lecce, Italy
2
Northeastern University, 360 Huntington Avenue, Boston, MA, U.S.A.
Keywords: Information Extraction, Information Gathering, Cultural Heritage Objects, Real-Time Data Extraction,
Social Network Analysis.
Abstract: This paper describes the design and implementation of a prototype to extract, collect and visually analyse
cultural digital resources using social network analysis empowered with semantic features. An initial
experiment involved the collection and visualization of connections between cultural digital resources - and
their providers - stored in the platform DiCet (an Italian Living Lab centred on Cultural Heritage and
Technology). This step helped to identify the most appropriate relational data model to use for the social
network visualization phase. We then run a second experiment using a web application designed to extract
relevant data from the platform Europeana.eu. The actors in our two-mode networks are Cultural Heritage
Objects (CHOs) shared by institutional and individual providers, such as galleries, museums, individual
experts and content aggregators. The links connecting nodes represent the digital resources associated to the
CHOs. The application of the prototype offers insights on the most prominent providers, digital resources
and cultural objects over time. Through the application of semantic analysis, we were also able to identify
the most used words and the related sentiment associated to them.
1 INTRODUCTION
The role of social media in distributing travel-related
information can no longer be ignored by tourism
marketers. Involving the crowd allows managers and
policy makers to identify potential customers’ needs
and, via participatory activities, to interact and retain
those members of the crowd who are mostly
interested in visiting particular points of interest
(Miguens et al, 2008). More and more, user-
generated content is complementing traditional
sources of information, creating an unexpected
competition among service providers such as travel
agencies, travel guides, or territorial development
agencies. Online social travel networking is
changing the way tourists plan their trips.
Crowdsourcing websites such as Triptease, Find My
Itin, Stackla, Gogobot, Geeks on a Plane, offer users
an interactive and visual experience to plan a trip
based on what peers suggest.
Collecting and recombining this ever-changing
knowledge base created by customers, suppliers, or
the general public, is facilitated by the creation of
informal communities that share common interests,
learn, interact and collaborate towards common
goals. In the context of creating and nurturing these
informal communities, social networking platforms
enable the creation of relationships with important
stakeholders. The biggest value of social networking
sites is represented by their ability to act as channels
to foster collaboration and innovation. Social
networks play now a key role in planning strategies
to engage communities within and outside the
organizational boundaries, recruit employees with
the right skill-set, and develop innovative ideas.
The goal of our research is to design and test a
prototype to extract, collect and visually analyse
cultural digital resources using social network
analysis (SNA), empowered with semantic features.
The research questions leading our study are: How
to identify the most active providers of digital
resources in an online platform? How positive or
negative is the content shared by these providers to
illustrate a cultural resource? What types of cultural
resources are exchanged by online communities
during a specific timeframe? Which is the historical
period that attracted most of the attention within an
online community sharing digital cultural resources?
The experiment we describe in this paper
provides a valuable perspective on the evolving
186
Capodieci, A., D’Aprile, D., Elia, G., Grippa, F. and Mainetti, L..
Visualizing Cultural Digital Resources using Social Network Analysis.
In Proceedings of the 7th International Joint Conference on Knowledge Discovery, Knowledge Engineering and Knowledge Management (IC3K 2015) - Volume 1: KDIR, pages 186-194
ISBN: 978-989-758-158-8
Copyright
c
2015 by SCITEPRESS – Science and Technology Publications, Lda. All rights reserved
interests of online communities towards cultural
heritage. Our research relies on the results of DiCet,
an Italian research project which sets the ground of a
Living Lab focused on Culture Heritage and
Technology. The DiCet project defines and
implements models, processes and ICT tools for
sustainable development of an intelligent territory
through the exploitation of its cultural heritage and
environmental resources. The project adopts the
Future Internet paradigm and social networking
techniques to realize an ecosystem of cooperating
heterogeneous entities such as companies,
government, citizens and tourists. DiCeT aims to
define and develop an open enabling platform of
intelligent services for cultural heritage
capitalization, able to enhance cultural experience by
leveraging on social inclusion, interaction and
augmented reality. The project aims to build
innovative services for improving the knowledge
shared by tourists, citizens, operators, and
researchers, as well as the cultural heritage fruition,
its conservation and preservation. The project
benefits from a multi-stakeholder partnership
composed of Italian universities, private companies
and research centres (i.e. University of Salento,
IBAM CNR Engineering Ingegneria Informatica
SpA, Open 1, Expert System, etc.).
DiCet leverages the federated architecture of
Europeana, the largest European digital library
(http://www.europeana.eu), which allows to flexibly
manage cultural content in the cloud. In the context
of the emerging Internet of Things (Xia et al., 2012),
Europeana represents an important effort to link
cultural heritage objects (CHOs) and their metadata
across several cultural institutions. This has the
potential to provide policy makers, researchers and
tourists with the opportunity to explore cultural
heritage in a more enriched way.
Europeana connects more than 2,000 European
institutions, from regional archives to local
museums. These providers contribute to feed this
open library with digital objects, thus sharing
cultural and scientific heritage items from prehistory
to modern era. Europeana introduces the Europeana
Semantic Elements, a common standard to facilitate
information retrieval of cultural items at European
level. The Europeana Data Model introduces a richer
metadata standard that helps users to receive more
and better quality digital content. Despite the recent
interest in capturing data on the creation of cultural
digital resources, there seem to be still issues
concerning the quality and quantity of the
information found in the descriptive metadata
associated with the digital representations of cultural
heritage objects (Beaudoin, 2012). This information
is often considered inadequate to make sure users
understand the nature of the cultural object and its
digital representation (Tsirliganis et al., 2004). The
goal of developing a web application to collect data
from Europeana is to analyse how different
providers (e.g. galleries, foundations, individual
experts) interact, co-create knowledge, and share
cultural digital resources.
Our quasi-experimental design (Shadish et al.,
2002) involved collecting insights to address the
issues of metadata interoperability within DiCeT,
thus designing a “Semantic Enterprise Service Bus
for Cultural Heritage” to access data and information
coming from multiple data sources. The service bus
uses an ontology-based approach to integrate
different and heterogeneous data sources (Wache et
al. 2001; Gawinecki, 2008; Shi et al. 2014; Zhu
2012). We first run a pilot experiment with all the
data stored in the DiCet platform in order to
visualize and measure the structure, content and
sentiment of social communication networks by
using the software suite Condor. Then, we built a
web application to collect data from the Europeana
portal, and process cultural objects using the same
approach and methodology. To this purpose, we
selected a sample of cultural objects to demonstrate
the potential of the web application.
2 SOCIAL NETWORK ANALYSIS
IN THE TOURISM INDUSTRY
An important aspect of social media applications is
the wealth of user generated content. This can prove
highly beneficial in directing tourists’ choices, and
can be of extreme value for the understanding of
market preferences and needs. New opportunities for
research are now available considering the growing
online connectivity of individuals, as well as the
development of APIs allowing more directed data
collection (Miguéns et al., 2008; Schoder et al.,
2013). Recent experiments are proposing new
systems to build new type of communities based on
physical proximity. Pietilainen et al. (2009) designed
and implemented a mobile social networking
middleware named “MobiClique” that creates and
exploits ad hoc social networks to disseminate
content using a “store-carry-forward technique”.
SNA techniques and tools have been demonstrated
to be useful to dynamically assess the value created
by social interactions. Some of the most commonly
used metrics of social network include indicators of
Visualizing Cultural Digital Resources using Social Network Analysis
187
individual prominence such as contribution index,
closeness and betweenness centrality, as well as
group level indicators like density, group degree or
betweenness centrality (Borgatti and Everett, 2006).
Researchers have been analysing social networks
by mining e-mails, forum posts, mailing list
archives, hyperlink structure of homepages, or co-
occurrence of text in documents (Erétéo et al.,
2008). Social Network Analysis offers a well-
established set of tools and techniques to monitor the
emergence of social interactions (Wasserman and
Faust, 1994). By mapping social networks of online
users and the content they exchange it is possible to
recognize emerging communities based on specific
aggregation criteria, such as virtual and physical
proximity, data sharing, or access to common
services. It is also possible to monitor how
preferences and needs change over time and locate
the community members with high betweenness
centrality or degree centrality (Wasserman and
Faust, 1994), who have the potential to provide
access to a large number of members with similar
needs, preferences or skills.
Despite the interest in adopting a network
approach to study interactions in the tourism
industry (Tonti and Baggio, 2012), there is still a
lack of empirical research on the benefits of
monitoring the evolution of networks of people
interacting on social media with a touristic vocation.
D’Agata, Gozzo and Tomaselli (2012) employed
measures derived from Social Network Analysis to
create territorial networks. The authors used survey
data from a sample of tourists leaving from airports
and ports of the main cities in Sicily (Italy). Despite
the interesting results, the work still relies on
traditional approaches, such as surveys and
questionnaires, to understand how people and places
interact with each other. In our research we use data
shared directly by users on a platform. Digitally-
enabled SNA affords relatively unobtrusive and
objective measurement of interaction behaviours of
individuals and groups. By observing their evolution
in terms of structural properties (e.g. degree
centrality, density) as well as content creation, it is
possible to recognize how positive and negative
opinions are disseminated and how they influence
people in the context of online communities. Given
the importance of collaborative relationships to act
as critical channels for knowledge search, transfer
and creation, policy makers and cultural institutions
might benefit from developing networks with other
users that may represent valuable sources of
knowledge.
3 A NETWORK APPROACH TO
VISUALIZE CULTURAL
RESOURCES
In this study, we combine SNA with semantic
analysis to overcome the intrinsic limitation of
traditional SNA studies that consider all the ties in a
network as homogeneous in content. Content
analysis and other text analytics techniques are
complementary research methods useful to make
inferences from texts about the context of their use.
Campbell and Pennebaker (2003) have
implemented a probabilistic computational system
called Linguistic Inquiry and Word Count (aka
LIWC) that counts all the words in a body of text
and classifies each word as belonging to one or more
“dictionaries”, including positive and negative
words. Gloor et al. (2009) have used a bag-of-words
approach similar to LIWC. The bag-of-words model
is a simplifying representation used in natural
language processing. In this model, text such as an
e-mail or a forum post is represented as an
unordered collection of words, disregarding
grammar and overall meaning. Gloor et al. (2009)
have classified and counted the number of words in
each actor’s email communication that reflects
positive or negative emotion, or the use of an ego
word, and then aggregated individuals’ data to the
team level. Zhang et al. (2013) used sentiment
analysis to assess teams using dynamic SNA.
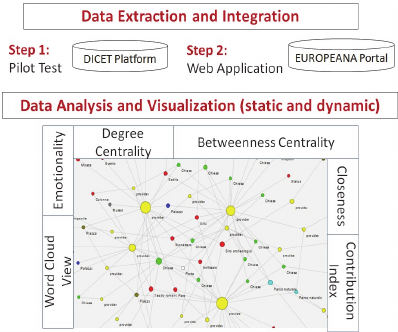
Figure 1 describes the methodology we followed
to extract data initially from the DiCet platform, and
then from the Europeana portal. In order to visualize
and analyse the relational data, we selected social
network metrics and semantic indicators to represent
both structural properties of social networks, and the
semantic associated to each object.
Figure 1: Steps of the methodology.
KDIR 2015 - 7th International Conference on Knowledge Discovery and Information Retrieval
188
Specifically, we used actor betweenness
centrality, actor degree centrality, density and word
usage, which offered meaningful insights to address
our research questions. Betweenness centrality is
calculated as the fraction of shortest paths between
every possible pair of nodes that pass through at
least one node in the group (Wasserman and Faust,
1994). Actor degree centrality is the total number of
other points to which a point is adjacent. We also
looked at density of the graphs, calculated as the
total number of ties divided by the total number of
possible relational ties (Wasserman and Faust, 1994;
Borgatti and Everett, 2006). We finally looked at the
sentiment conveyed by the providers in describing
the cultural heritage objects (CHO). Sentiment is a
measure with a value between 0 and 1, where 0
indicates that the message is very negative and 1
very positive (Brönnimann, 2014, Pang et al., 2002).
Sentiment of the message is calculated from a
specially developed multi-lingual classifier based on
a machine learning method with data coming from
Twitter. In this study we calculate positive and
negative sentiment in the comment left by users
using a simple “bag-of-words” approach (Whitelaw
et al., 2005), employing user-generated mood word
lists relevant for the domain area. This approach has
been developed initially looking at large e-mail
archives (Gloor et al., 2009). For each e-mail,
“emotional words” matching a pre-loaded list were
counted and then normalized by the total number of
words in each message (Brönnimann, 2014).
Following this approach, each e-mail or any other
text is assigned with a positivity value and a
negativity value ranging from 0 to 1.
Another metric of sentiment analysis that we
used in this research is the “word usage over time”
based on the most frequently used term saved by the
providers to describe CHO and its digital resources
(Gloor et al., 2009).
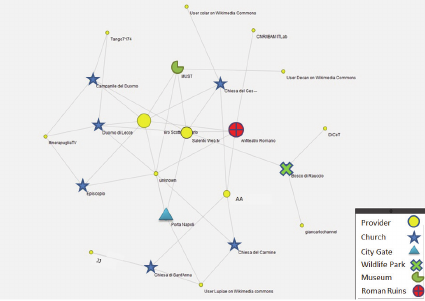
Figure 2: Visual Maps of users and points of interest.
There are a few software packages that can deal
simultaneously with several sources of data and
combine them in a way that is easily available for
visualization to final users. In this study we used the
software program Condor, which allows to visualize
and measure the structure, content and sentiment of
social communication networks over time. Condor
creates static maps and movies of relationships that
can come from social networks, web site link
structures, and concept maps of unstructured
documents, online forums, phone archives, or e-mail
networks.
4 BUILDING THE PROTOTYPE
4.1 Pilot Test with the DiCet Platform
In this study, a provider is a generic entity that can
provide content to the platform. A provider can be a
museum, a cultural expert, or a tourist. In that sense,
it will be treated either as a string of text or as an
URL. Figure 2 illustrates an example of a two-mode
network where nodes represent both the digital
contents and points of interest (resources), and the
individuals or organizations uploading them into the
system (providers). Definitely, two mode networks
are characterized by actors who belong to two
different sets (Wasserman and Faust, p. 29) that are
providers or resources.
In the sociogram shown in Figure 2 the size of
the node represents the betweenness centrality,
which offers initial insights on the most active
contributors in the DiCet platform. Bigger nodes
represent resources or providers that connect more
resources/providers who would not be otherwise
connected (Wasserman and Faust, 1994). In other
words, the size of the node represents the most
active users/data providers, or the most talked about
and discussed resources. For example, by looking at
Figure 2, the Roman Ruins and the city Wildlife
Park were the points of interest that mostly attracted
the attention of users who posted more photos or
more comments about them.
Figure 3 illustrates the evolution over time of
words used by providers of digital resources in order
to describe points of interest. The graph identifies
the words that were most frequently used every day
by the users of the DiCet platform. It also detects
who was the first provider to use that word and
when this occurred. This representation used a Bag-
of-Word approach (Gloor et al., 2009) to calculate
the word usage and offer some insights about the
extent of language complexity used to describe the
Visualizing Cultural Digital Resources using Social Network Analysis
189
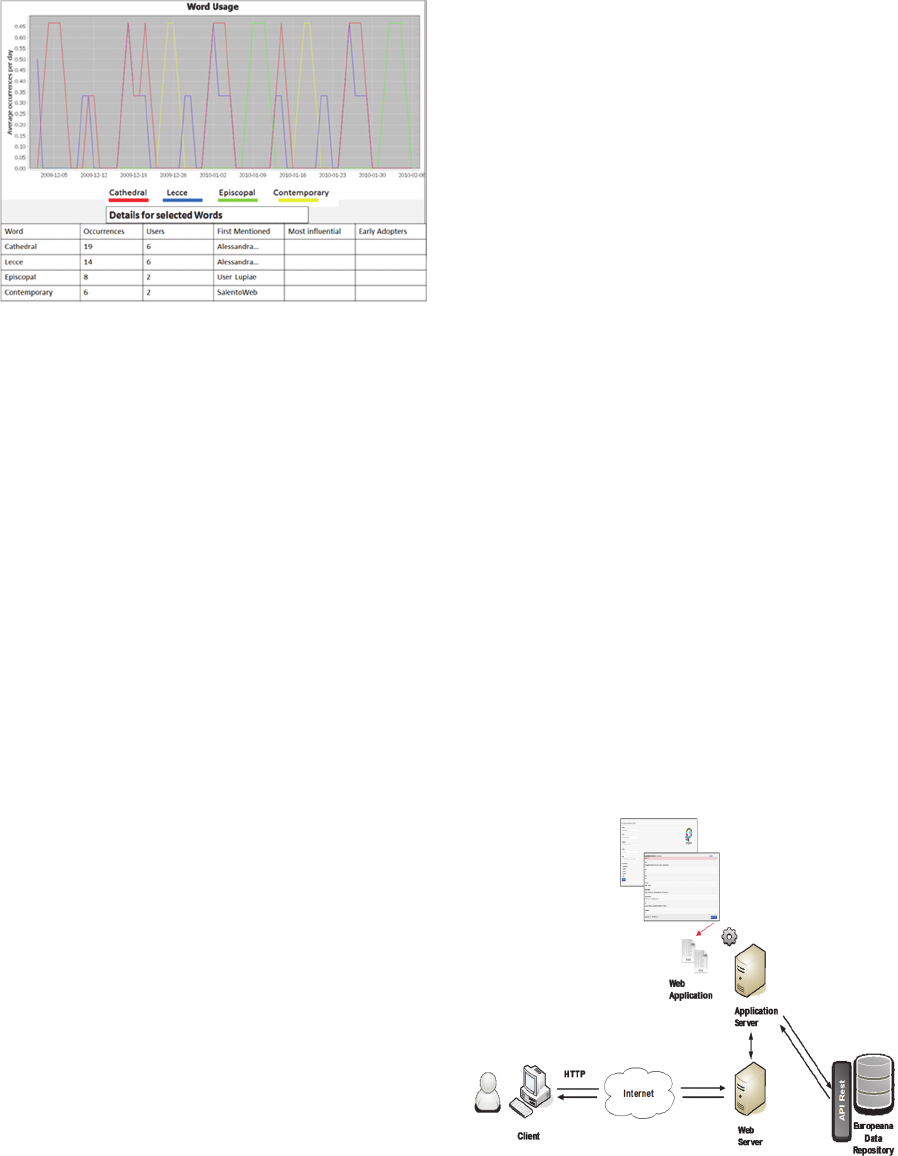
Figure 3: Word Usage (DiCet platform) – hypothetical
timeframe.
digital resources/points of interest. Looking at
indicators such as “deviation of word usage”, we can
determine how complex or essential the
communication is and we can observe new ideas
being generated over time. In the example presented
in Figure 3, we were able to identify the most
popular concepts over time, based on their
occurrences. For instance, “cathedral” and “Lecce”
were the most talked about terms (19 and 16
occurrences) and the user “Alessandra A.” was the
one to introduce those concepts for the first time.
The sentiment classifier used in the Condor
software is able to determine positive, negative or
neutral sentiment of documents in various
languages, though the most reliable results are still
based on the use of English words. The sentiment
classifier is currently in a training phase for the
Italian language. This is the reason why we did not
conduct a complete sentiment analysis for the DiCet
posts. Nevertheless, we were able to identify the
most frequently used words over time (see Figure 3).
The next sections illustrate how we used the
insights from the DiCet pilot test to build an
application that can extract data from the portal
Europeana.eu.
4.2 Development of the Europeana
Web Application
Europeana.eu is an Internet portal that acts as an
interface to millions of books, paintings, films,
museum objects and archival records that have been
digitised throughout Europe. Mona Lisa by
Leonardo da Vinci, Girl with a Pearl Earring by
Johannes Vermeer, the works of Charles Darwin and
Isaac Newton, and the music of Wolfgang Amadeus
Mozart are some of the highlights on Europeana.
Europeana gives access to different types of content
from different types of heritage institutions. The
digital objects that users can find in Europeana are
not stored on a central computer, but remain with the
cultural institution and are hosted on their networks.
Europeana collects contextual information – or
metadata – about the items, including a small
picture. Users can search this contextual information
and, once they find what they are looking for, they
can access the full content of the item by clicking
through the original remote site that holds the
content.
The Europeana portal is used to search and
browse a public repository which contains many
objects of various types including books, audio and
video objects, photos, paintings, etc. These objects
are collected from different domains, including
fashion, natural history, archaeology, history, art,
and so on. Users can narrow their search and filter
by titles, creators, subjects, dates/periods, or places.
Alternatively, they can type the words “who”,
“what”, “where” or “when” into the Europeana
search box followed by a colon.
The web application we developed provides the
same search and filtering functionalities as the
Europeana portal, presenting the results in a human
friendly representation (html). It has been
implemented in order to facilitate access to
Europeana Metadata by remote invocation of
Europeana Search API when using the Java
programming language. This was developed by
using the Europeana4J source code which provides
a comprehensive set of features for interacting with
the HTTP / REST-based Europeana API. It also
exports the search results in CSV format, which is
commonly accepted for SNA tools.
Figure 4: System architecture overview.
Figure 4 provides an overview of the system
architecture that highlights the two main
KDIR 2015 - 7th International Conference on Knowledge Discovery and Information Retrieval
190

components: the web application and the Europeana
metadata repository. The Europeana REST API
allows to build applications that use the wealth of
cultural heritage objects stored in the Europeana
repository. The API uses the standard web
technology of REST calls over HTTP. Responses
are returned in the popular JSON format. The users
of this web application typically use an Internet
browser to retrieve and visualize the Europeana
objects. After performing a search, our application
allows to export the results in .CSV format, in order
to feed the social network analysis tool and proceed
with data analysis and visualization.
4.2.1 Class Diagram
The web application implementation is based on the
main classes of the Europeana4J framework and on
some specific classes that allow users to export
results in CSV format. For example the classes
EuropeanaConnection and EuropeanaApi2Client
implement the querying of the Europeana API,
making use of the HttpConnector class, which
facilitates reliable communication over the http
protocol.
The class EuropeanaApi2Results deserializes the
message in the response returned by the Europeana
server and provides the Europeana objects. The
SearchAction class handles the parsing of Europeana
JSON metadata text documents and the creation of
internal Java objects. Finally, the ExportAction class
uses handy methods belong to CreateCSVFile class
to write results into CSV files.
4.2.2 Network Visualization of Europeana
Data
Using data extracted through the web application,
we built two-mode networks composed of actors
represented by Cultural Heritage Objects (CHO) and
their digital representations (web resources), and
links represented by the association between CHOs
and web resources. In some cases, providers of
digital resources are museums, galleries or
individuals (called “data providers”); other times
digital resources are provided by external
aggregators who have been asked to post the
resources in lieu of the data providers who own the
resources. For instance, a CHO could be the “Mona
Lisa” of Leonardo da Vinci, and the digital resources
could be several Mona Lisa’s replica in different
formats: a Mona Lisa caricature printed on a box,
sculptures inspired by the painting, or a video
documentary on the painting itself.
We run initial experiments on the portal
Europeana.eu using basic searching options as well
as advanced ones, for example adding the string
“Who” to identify a specific author. Table 1 presents
a subset of keywords used to test the web
application: “Divina Commedia/Dante Alighieri”;
“Mona Lisa”, “all the manuscripts between the 13
th
and the 14
th
century”; “King Lear” by Shakespeare
and “La Dolce Vita” (i.e. the famous movie by
Federico Fellini). The examples shown in Table 1
have been chosen since they are representatives of
the variety of results we can obtain.
Table 1 summarizes the number of CHO shared
on Europeana by different providers. The links are
represented by the web resources associated to the
CHO, while the network density represents the
actual links between nodes out of the total possible
connections. For instance, we built the Divina
Commedia network based on 304 nodes (i.e. CHOs)
with 204 associations based on the number of web
resources associated to each CHO. The low density
for the CHO Divina Commedia indicates that there
are fewer resources shared on Europeana connecting
the cultural objects. This means that cultural objects
with a higher density are the most popular. In Table
1 most of the nodes/CHO have low density, though
King Lear seems to emerge as the one with a higher
relative popularity.
Table 1 presents also a comparison of the type of
resources available for each CHO. Users tend to
share resources that are less textual and more audio-
visual when the objects are Mona Lisa or La Dolce
Vita. This is not a surprise given the nature of those
cultural objects.
Table 1: Search Results from Europeana.
Divina
Commedia
Mona
Lisa
Manuscri
pts [1200
to 1300]
La Dolce
Vita
King Lear
Nodes
304 239 284 150 294
Links
204 139 184 51 196
Density
0.0022 0.0024 0.0023 0.00224 0.00225
Resource Type
92 text,
8 image
85
images,
31 sound,
24 text,
2 videos
22
images,
115 text
90
images, 4
sounds,3
text, 3
videos
59
images,
40 text
Visualizing Cultural Digital Resources using Social Network Analysis
191
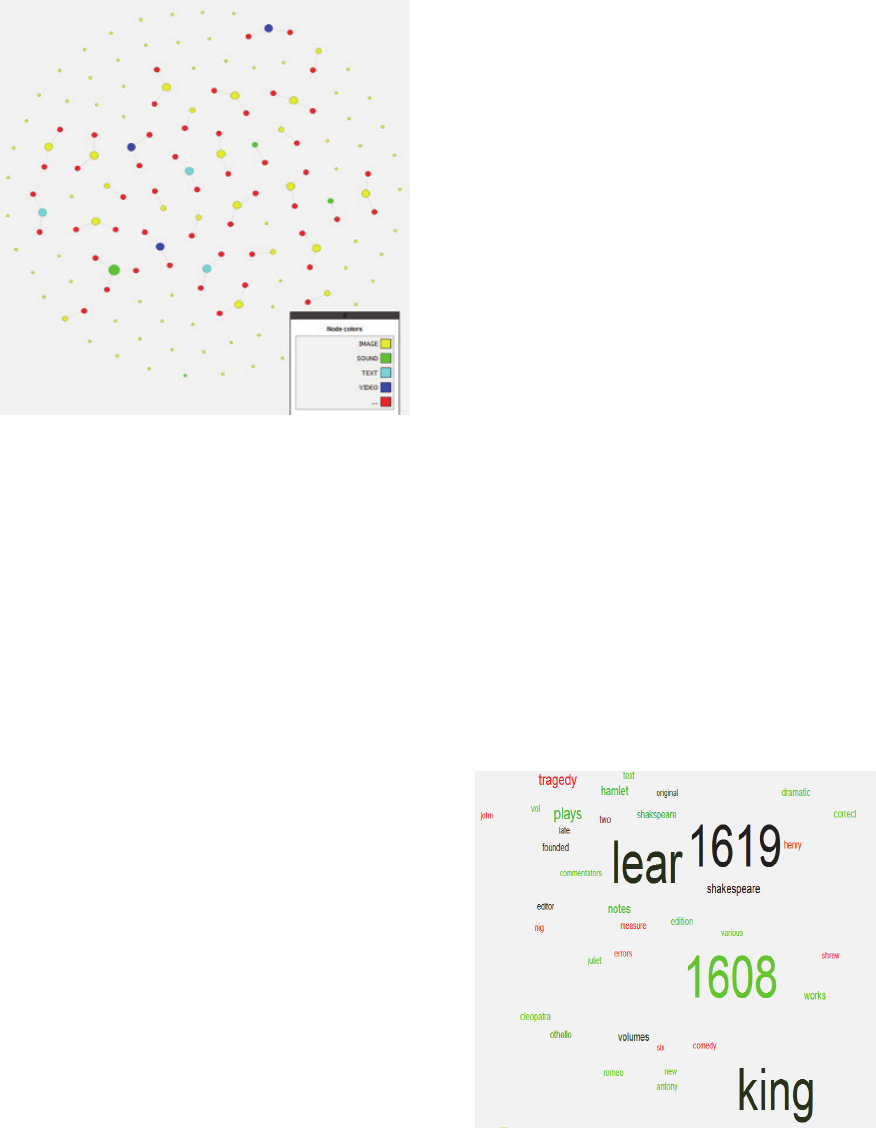
Figure 5: Graph of the CHO Mona Lisa.
Figure 5 illustrates the network of the CHO
“Mona Lisa” and its digital resources. The colour
represents the type of resource available for the
Mona Lisa object: image, sounds, text, or video. The
size of the node is based on Betweenness Centrality,
so the bigger the circle, the most central is the
cultural object in terms of number of resources
posted on Europeana. In this case betweenness
centrality can offer some insights on the ability of a
CHO to connect different resources and different
providers, acting as hub for other nodes (e.g.
museums, experts, aggregators).
Figure 6 shows the Word Cloud View for the
cultural object “King Lear”. The colour settings
from red (negative) to green (positive) offer a first,
visual indication of the extent the words used to
describe resources are considered negative, neutral
or positive. In order to visualize the word cloud
view, we had to run a sentiment analysis on the
nodes’ description (Brönnimann, 2014, p.2). In this
case the text is represented by the description of
cultural objects and associated resources. In Figure
6, words such as “lear”, “king” or “errors” are
marked as negative, while others such as “correct”,
or “1608” are considered positive.
5 DISCUSSION
The web application we designed, applied and
described in this paper is based on a Java library
developed in an open collaborative environment.
Because of that, it is under continuous improvement.
In this early stage it offers good potential for users to
explore the wealth of cultural heritage using a single
web application, which acts as interface for any
social network analysis tool. We should not ignore
that issues of metadata interoperability still remain a
challenge, despite Europeana’s efforts to help
institutions and data providers to create a single
metadata repository. To address these issues a
“Semantic Enterprise Service Bus for Cultural
Heritage” is under development within the DiCet
project, in the aim to make accessible all the
information and contents in the field of cultural
heritage. For its design and implementation, an
ontology-based approach has been adopted, in order
to integrate different and heterogeneous data
sources.
From a technical perspective, the novelty can be
identified in the design and experimentation of a
prototype that allows a controlled extraction of data
and information from Europeana data source, in a
format that is machine readable from the SNA tool
adopted in the study (Condor). The choice to adopt
infographics map (Smiciklas, 2012) to represent the
results of data processing normally facilitate the
interpretation of data, leaving more time and energy
for action design and implementation. Finally, with
very few customizations of the code, the same set of
data can be generated for feeding other SNA tools.
This work can open new scenarios of a larger
research and development agenda that aims at
implementing and interpreting a network
representation of cultural digital resources grounded
on the use of semantic technologies.
Figure 6: Word Cloud View of CHO King Lear.
The web application described in this paper
gives the opportunity to explore other visualizations
of search results. For example, out of N objects
KDIR 2015 - 7th International Conference on Knowledge Discovery and Information Retrieval
192
authored by a painter (e.g. Michelangelo), we might
be able to identify the most popular painting from
that same author based on the number of resources
shared by different data providers.
The research implications of this study include
the exploration of a domain with high potential for
regional development by adopting a systemic
approach which integrates network structure-based
metrics with a semantic-based approach. This paper
described preliminary results that can be replicated
using similar data extracted in other regions with
similar cultural attraction.
In terms of implications for practitioners, the
described methodology can be used to identify the
most active providers in the online social network in
order to engage them and learn from their
experience. These online contributors feed the
knowledge base with new digital contents that
represent a great attractor to enlarge the community
itself. Users can perform their research on
Europeana by using textual queries. Unfortunately,
the portal does not seem to currently allow any kind
of visual interrogation using pictorial components
(Boujemaa et al., 2002). Our web application uses
the API available for programmers so it does not use
a retrieval approach based on global visual
similarity.
6 CONCLUSIONS
The application of this prototype offers the
opportunity to identify "content gap" in an online
platform such as Europeana, helping to complete the
knowledge base with new digital resources or with
improved semantic. Our work provides also the
opportunity to policy makers and local or national
government entities to identify clusters of interest
around cultural objects, enabling the design of
marketing campaigns on the territory to promote
touristic products by targeting users with high
probability to transform the interest in actual
purchase.
Research in the area of content-based image
retrieval (CBIR) has developed several algorithms
that can realistically “return a list of images that
matches the visual perspective of their inventors”
(Kwan et al., 2011). However, there is still a
problem known as “semantic gap” for queries based
either on images or on tags, since the images or
textual results often do not correspond exactly to the
results expected by the users.
It would be an important development for the
Europeana project to include content-based image
retrieval along with text retrieval. In the future we
plan to replicate the analysis with a larger sample of
cultural heritage objects randomly selected on the
Europeana portal, designing larger and more
coordinated experiments. Further research is needed
to expand on the preliminary insights that we
obtained from these initial experiments.
ACKNOWLEDGEMENTS
This work is partially supported by the project:
“PON04a2_D - DiCet LivingLab Di Cultura e
Tecnologia – INMOTO – OR.C.HE.S.T.R.A.”. The
project is funded by the Italian Ministry of
Education, University and Research (MIUR).
REFERENCES
Beaudoin J.E. (2012) A Framework for Contextual
Metadata Used in the Digital Preservation of Cultural
Objects. D-Lib Magazine. 11(11/12).
Borgatti, S. P., Everett, M.G. (2006). A graph-theoretic
framework for classifying centrality measures. Social
Networks 28(4): 466-484.
Boujemaa N, Gouet V, Ferecatua M (2002) Approximate
Search vs. Precise Search by Visual Content. In
Proceedings of MIR Workshop ACM-MM.
Brönnimann, L. (2014) Multilanguage sentiment analysis
of Twitter data on the example of Swiss politicians.
M.Sc. Thesis, University of Applied Sciences
Northwestern Switzerland; retrieved from
http://www.twitterpolitiker.ch/documents/Master_The
sis_Lucas_Broennimann.pdf.
Campbell, R.S., Pennebaker, J.W. (2003). The secret life
of pronouns: Flexibility in writing style and physical
health. Psychological Science, 14: 60-65.
D’Agata R., Gozzo S., Tomaselli V. (2012) Network
analysis approach to map tourism mobility, Quality &
Quantity, 47, (6): 3167-3184.
Erétéo G., Buffa M., Gandon F., Grohan P., Leitzelman
M., Sander P. (2008). A state of the art on social
network analysis and its applications on a semantic
web. SDoW2008, workshop at ISWC.
Europeana Creative, D2.1 – Metadata Retrieval Services
Based on Semantic Web Technologies, retrieved on
05/26/2015 from http://pro.europeana.eu/files/
Europeana_Professional/Projects/Project_list/Europea
na_Creative/Deliverables/eCreative_D2.1_NTUA_v1.
0.pdf
Gawinecki, M. (2008). How schema mapping can help in
data integration?–integrating the relational databases
with ontologies. ICT School, Computer Science.
Gloor, P. Krauss, J. Nann, S, Fischbach, K. Schoder, D.
(2009) Web Science 2.0: Identifying Trends through
Semantic Social Network Analysis. IEEE Conference
Visualizing Cultural Digital Resources using Social Network Analysis
193
on Social Computing (SocialCom-09), Aug 29-31,
Vancouver.
Kwan P.W., Kameyama K., Gao J., Toraichi K. (2011)
Content-based image retrieval of cultural heritage
symbols by interaction of visual perspectives.
International Journal of Pattern Recognition and
Artificial Intelligence, 25(05), 643-673.
Miguéns, J., Baggio, R., Costa, C. (2008). Social media
and Tourism Destination: TripAdvisor Case Study.
Proceedings of the IASK Advances in Tourism
Research 2008 (ATR2008), Aveiro, Portugal, 26-28
May 2008, 194-199.
Pang B, Lee L. and Vaithyanathan S. (2002) Thumbs up?
sentiment classification using machine learning
techniques. In Proceedings of the Conference on
Empirical Methods in Natural Language Processing
(EMNLP), 79–86.
Pietiläinen A.-K., Oliver E., LeBrun J., Varghese G., and
C. Diot. (2009) MobiClique: Middleware for Mobile
Social Networking. In WOSN.
Schoder, D., Gloor, P. A., & Metaxas, P. T. (2013). Social
Media and Collective Intelligence—Ongoing and
Future Research Streams. KI-Künstliche Intelligenz,
27(1), 9-15.
Shadish, W. R., Cook T.D, and Campbell D.T. (2002)
Experimental and quasi-experimental designs for
generalized causal inference." Social Service Review
76, no. 3, 510-514.
Shi, K., Gao, F., Xu, Q., & Xu, G. (2014). Integration
framework with semantic aspect of heterogeneous
system based on ontology and ESB. In Control and
Decision Conference (2014 CCDC), The 26th
Chinese (pp. 4143-4148). IEEE.
Smiciklas, M. (2012). The power of infographics: Using
pictures to communicate and connect with your
audiences. Que Publishing.
Tonti, S., Baggio, R. (2012). Organizational impacts of
social network analysis for an Italian multinational
enterprise. Turistica - Italian Journal of Tourism and
Culture, 21(1), 65-73.
Tsirliganis N., Pavlidis G., Koutsoudis A., Papadopoulou
D., Tsompanopoulos A., Stavroglou K., Loukou Z.,
Chamzas C., (2004) Archiving Cultural Objects in the
21st Century, Elsevier Journal of Cultural Heritage,
Vol. 5, Issue 4, pp. 379-384.
Xia, F., Yang, L.T., Wang, L., Vinel, A. (2012) Internet of
Things. International Journal of Communication
Systems. 25, 1101–1102.
Wasserman, S. and Faust, K. (1994). Social Network
Analysis: Methods and Applications. Structural
Analysis in the Social Sciences, Cambridge University
Press, Cambridge.
Wache, H., Voegele, T., Visser, U., Stuckenschmidt, H.,
Schuster, G., Neumann, H., & Hübner, S. (2001,
August). Ontology-based integration of information-a
survey of existing approaches. In IJCAI-01 workshop:
ontologies and information sharing (Vol. 2001, pp.
108-117).
Whitelaw, C. Garg, N. Argamon, S. (2005) Using
Appraisal Groups for Sentiment Analysis, in
Proceedings of the 14th ACM international conference
on Information and Knowledge Management, p. 631.
Zhang X, Gloor P.A., Grippa F. (2013) Measuring creative
performance of teams through dynamic semantic
social network analysis. International Journal of
Organisational Design and Engineering, 3(2): 165–
184.
Zhu, W. (2012). Semantic mediation bus: an ontology-
based runtime infrastructure for service
interoperability. In Enterprise Distributed Object
Computing Conference Workshops (EDOCW), 2012
IEEE 16th International (pp. 140-145). IEEE.
KDIR 2015 - 7th International Conference on Knowledge Discovery and Information Retrieval
194
