Toward Sentient Neurotechnology
Visual Object Unity May Be Structured by and Constrain Neural Interactions
Raymond Pavloski
Psychology Department, Indiana Univ. of PA, 15701, Indiana, PA, U.S.A.
Keywords: Hard Problem, Neurotechnology, Recurrent Neural Network, Sentience, Tolerance Space, Visual Object
Unity.
Abstract: Achieving an understanding of how qualities of experience arise in concert with the operation of neural
networks could produce a revolutionary advance in neurotechnology. The work reported here explores a
relationship between a visual quality and neural activity that has not previously been investigated: visual
object unity may emerge from and constrain neural interactions. Simulations were employed to determine if
a topological signature of a unified object develops as a recurrent neural network’s activity is modulated by
retinal input. Results show that differences in recurrent excitatory conductance values produced by adjacent
active neurons are negligibly small, and can be described by a tolerance relation. Tolerance open balls about
the vectors of conductance values produced by active neurons emerge in response to the retinal image of an
object and a connected open set consisting of intersecting open balls quickly develops. Such connected open
sets are invariant over fluctuations in participating neurons, demonstrate several characteristics of perception,
and are hypothesized to be objective signatures of perceived object unity. Dynamical network phenomena,
such as hysteresis, lead to empirical predictions that can be tested with human participants. Means of
identifying objective signatures in brain activity are considered.
1 INTRODUCTION
The domain of neurotechnology is limited by the
absence of an explanation for how the qualities of
experience arise in concert with the operation of
neural networks in the brain, often referred to as the
‘hard problem’ (Chalmers, 1996; Hut and Shepard,
1996). As a result of this limitation, we are unable to
construct a cortical prosthesis that when interfaced
with damaged visual cortex would make it possible
for a patient to regain aspects of visual experience that
have been lost through cortical lesions.
There is no doubt that significant progress has
been made in identifying objective signatures of
conscious access, the ability to report an experience
following presentation of a stimulus (Dehaene, 2014).
However, this achievement provides no information
regarding the neural mechanisms involved in the
appearance of a particular quality of experience
(Block, 2001; 2007). Nor does it provide any
information on how the processes that underlie any
specific quality of experience are involved in neural
dynamics. Without such information, it is difficult to
take seriously the claim that “there is now sufficient
evidence to consider the design and construction of a
conscious artifact (Edelman et al., 2011).”
It seems unlikely that a general solution to the
hard problem will be found in the absence of work
that relates specific aspects of experience to specific
aspects of neural activity. In order for experimental
and theoretical progress to be made, it is essential that
an aspect of experience can be described so that its
relation to neural activity is evident. This report puts
forward the appearance of visual object unity (Chen,
2005), modelled as a connected open set in a
tolerance space (Peters and Wasilewski, 2012), as
such an aspect of experience.
From a naïve viewpoint, it is easy to overlook the
fact that the experience of a unified entity, one aspect
of the full experience of a visual object, is an
achievement of the visual system. Of course, this is
obvious to those who believe that vision proceeds
from part to whole and from geometrically simple to
geometrically complex. From this perspective, it is
assumed that receptive field data show that an object
image is initially decomposed into patches of
contrast, and that processes in successively higher
cortical areas in some way bind successively more
complex geometric features into the visual object that
is experienced (e.g., Roelfsema and Houtkamp,
Pavloski, R..
Toward Sentient Neurotechnology - Visual Object Unity May Be Structured by and Constrain Neural Interactions.
In Proceedings of the 3rd International Congress on Neurotechnology, Electronics and Informatics (NEUROTECHNIX 2015), pages 81-90
ISBN: 978-989-758-161-8
Copyright
c
2015 by SCITEPRESS – Science and Technology Publications, Lda. All rights reserved
81

2011). The topological approach to perceptual
organization that is advanced by Chen (2005; see also
Zhang, 2005) is in agreement with the conclusion that
visual object unity is an achievement of the visual
system. According to this approach, however, visual
unity is a topological visual primitive and is extracted
from the object image very early in visual processing.
Despite the volume of excellent experimental
work carried out by Chen and his colleagues in
support of the topological approach, the means by
which visual neural networks deal with topological
properties has remained a mystery (Minsky and
Papert, 1988; Pomerantz, 2003). As indicated by
Chen (2005), the topological approach can be made
compatible with the fundamentally discrete nature of
the visual system if it is assumed that vision is tolerant
to differences in the retinal image at various scales.
For example, visual unity can readily be perceived in
a collection of image elements that are spatially
separated by sufficiently small distances. This is
expressed formally by stating that a pair of image
elements belongs to a tolerance relation τ if the
distance between them is less than some criterion.
Like equality, tolerance τ is a relation that is reflexive
(for an element a, the pair (a,a) belongs to τ) and
symmetric (if (a,b) belongs to τ, then (b,a) belongs to
τ). Unlike equality, however, tolerance is not
transitive: (a,b) belongs to τ and (b,c) belongs to τ do
not imply that (a,c) belongs to τ. Work in
computational vision shows that it is possible to apply
a tolerance relation to the elements of an image and
thereby to identify topological properties of the image
(Huang et al., 2010). How the brain might accomplish
this task is not known. More importantly, even having
a neural network that computes topological properties
might not tell us how the experience of visual unity
arises within that network, how we see visual unity.
An alternative approach is to study the sources
and consequences of a tolerance relation within the
recurrent neural interactions of richly interconnected
networks of the visual system. Introducing a bit of
tolerance space terminology is very helpful in seeing
how this might be done (Peters and Wasilewski,
2012). If we use accepted terminology, then the set of
elements x such that (a,x) belongs to τ is called an
open ball about a, or OB(a). For example, we might
have OB(a) = {a,b}, OB (b) = {a,b,c}, and OB(c) =
{b,c}. A set that contains the open balls about each of
its elements is called an open set, so {a,b,c} is open.
Finally, an open set is said to be connected if it cannot
be separated into two disjoint open sets, both not
empty. Using this definition, we can readily see that
{a,b, c} is a connected open set (COS). The definition
of a COS indicates that it is a reasonable model of
visual object unity, given that the elements with
which we are working must be discrete.
Figure 1: A schematic of the central idea motivating the
present work is shown. See text for details.
The work reported here is based on the idea that
recurrent neural network inputs are structured by
retinal image input, the network’s synaptic
architecture, the dynamics of synaptic events, and a
tolerance relation τ into a COS, and thereby “make
sense” as visual object unity. It is assumed that
recurrent inputs from two network neurons belong to
τ if they are sufficiently similar as to have
indistinguishable effects on network neurons.
Figure 1 is a schematic illustration of recurrent
inputs arising from the N neurons in a network. In a
fully-connected network, each neuron contributes N
such inputs that are modelled as an N-dimensional
vector. These vectors can be projected on basis
vectors for the 3D space in which the neurons are
located. The top left graphic in Figure 1 demonstrates
the result for a network with N = 1089 in which the
neurons receive inputs from the image of a square.
Neurons that receive little input from the image
produce very small vectors of recurrent inputs that
project to the origin of the coordinate system being
used. More active neurons have larger projections,
but these provide no information regarding the
presence of a unified object.
The bottom right graphic shows projections of the
same vectors of recurrent input on a dimension that
reflects the rapid decay of recurrent input synaptic
conductance with time, and on two dimensions that
reflect the decay of recurrent input synaptic
NEUROTECHNIX 2015 - International Congress on Neurotechnology, Electronics and Informatics
82
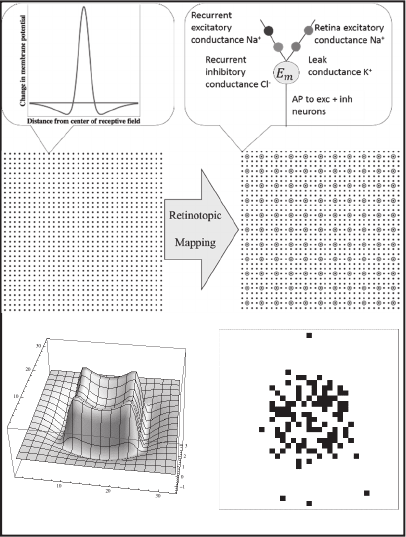
conductance with distance between source and target
neurons. Large projections on the temporal decay
dimension are produced by neurons that receive
retinotopic input from the square image and have
recently fired action potentials (APs), and pairs of
projections that are joined by line segments form a
COS that models visual object unity. It is proposed
that, rather than computing topological properties,
such a network creates the perceived unity of a visual
object.
The remainder of this paper shows how this idea
can be realized in a simple recurrent neural network
(RNN). Section 2 provides a description of the
network model. Previous work employing singular
value decomposition (SVD) of a matrix of recurrent
excitatory conductance values G(t) showed that a
small number of basis vectors span the row space of
G(t) and allow a portrayal of stable structures that
form in response to an input image (Pavloski, 2011).
Section 2.1 shows that the row space basis vectors
arise from the distribution of synaptic weights and the
decay of conductance values over time. In Section
2.2, evidence for a tolerance relation containing pairs
of similar vectors of recurrent conductance values is
presented. Simulations show that this tolerance
relation permits a COS of the vectors of sodium
conductance values produced by active RNN neurons
to emerge from the retinal image of an object. Results
showing that COSs demonstrate several
characteristics of vision are described in Section 2.3.
These include just noticeable differences, the Gestalt
phenomenon of grouping by proximity, similarities to
V1 fMRI data for real motion and apparent motion,
and object constancy over rotation and changes of
size and orientation of an image. The issue of
determining whether a COS is an emergent entity is
considered briefly in Section 3. Two approaches to
testing the hypothesis that a COS is an objective
signature of a unified visual object are described in
Section 4, and conclusions are stated in Section 5.
2 A RNN THAT PRODUCES
CONNECTED OPEN SETS OF
CONDUCTANCE VECTORS
Simulated grayscale images were presented to a
simulated retina consisting of a 33 x 33 lattice of
model neurons. The inputs from the simulated image
to these model neurons were arranged so that each
receptive field was concentric, with a small diameter
ON center within which illumination excites the cell,
and a larger diameter OFF surround within which
illumination inhibits the cell. This was done in the
following way for each retinal neuron. The membrane
potential (E
m
) was set to 2.5 times the sum of the
illumination at each point in the image multiplied by
the value of a normal pdf (mean μ = 0 and standard
deviation σ = 1) at the Euclidean distance between the
image point and the location of the neuron, minus .6
times the sum of the illumination at each point in the
image multiplied by the value of a normal pdf (μ = 0
and σ = 4) at the Euclidean distance between the
image point and the location of the neuron. Using this
method, E
m
is affected by light in the simulated
images as shown in the top left panel of Figure 2. The
probability of an AP increased monotonically with E
m
above a threshold.
Figure 2: ON-center, OFF-surround neurons and RNN
neurons are depicted in the top and middle panels. A retinal
response to a 15 x 15 pixel image and a snapshot of RNN
excitatory neuron action potentials (APs) are shown in the
bottom panel.
Retinal neuron APs map retinotopically to
excitatory synapses on excitatory single compartment
model RNN neurons, which are also arranged in a 33
x 33 lattice and shown in Figure 2 as dots. An AP
produced by any retinal neuron is assigned the value
1 (present) or 0 (absent), and the effect on any
excitatory RNN neuron is given by this value
multiplied by a synaptic weight, which is .01 times
the value of a normal pdf (μ = 0 and σ = .03) at the
Toward Sentient Neurotechnology - Visual Object Unity May Be Structured by and Constrain Neural Interactions
83
Euclidean distance between the 2-dimensional
location of the retinal neuron and the 2-dimensional
location of the excitatory RNN neuron. The summed
effects of all retinal inputs on each neuron affected
excitatory sodium conductance according to an alpha
function (Sterratt et al., 2011); specifically, the value
of the conductance on each iteration of the network
was set to 0.7 times the summed weighted inputs plus
0.3 times the current value of the conductance.
Each excitatory RNN neuron sends output to all
excitatory neurons and also to inhibitory neurons
(shown in Figure 2 as circles) that are interspersed
among the excitatory neurons in an 11 x 11 lattice.
The inhibitory neurons, in turn, send outputs to all
excitatory neurons. All synaptic weights decrease
exponentially with distance (plus a random
component) between the source and target neurons,
with inhibition following off less rapidly than
excitation. The exponential functions were chosen to
promote very stable network dynamics. Excitatory
weights vary from a minimum of 0.15 to a maximum
of 0.23, and inhibitory weights vary from a minimum
of 0.34 to a maximum of 0.37 over the range of
distances in the lattice of neurons (distances range
from 0. to (2x32
2
)
1/2
).
Conductance based equations for the point
neurons follow standard sources (Sterratt et al.,
2011), and parameter values are taken from O’Reilly
and Munakata (2000). Both excitatory (sodium) and
inhibitory (chloride) conductance values produced by
RNN neuron APs were calculated in the same fashion
as the excitatory conductance values produced by
retinal neurons. The value of E
m
of each neuron was
determined by treating the membrane as an RC circuit
with time constant .2 and each synapse as a variable
conductance in series with the appropriate
equilibrium potential. All synapses were in parallel
with each other and with the resting E
m
and leak
conductance. Values were scaled so that E
m
varied
between 0 and 1. An AP was produced with a low
probability (.01) if E
m
is less than a threshold value =
.25, and the probability of an AP increased
monotonically for E
m
> .25. Updating was
synchronous, with every value in the RNN updated
on each iteration of the simulation using values of
current inputs and values of network variables from
the previous iteration. Retinal neuron membrane
potentials and APs produced by RNN excitatory
neurons on one iteration in response to a 15x15 pixel
image are shown in the bottom panel of Figure 2.
2.1 Singular Value Decomposition of
the Recurrent Excitatory
Conductance Matrix
After approximately 11 iterations, the RNN achieves
a stable response to an image. As indicated in Section
1, previous work demonstrated that a small number of
dimensions describe the row space of G(t). The entry
in the i
th
row and j
th
column of this matrix is the
conductance value g
ij
produced in excitatory neuron j
by excitatory neuron i. Thus, row i is vector g
i
of
conductance values in all RNN excitatory neurons
produced by neuron i. SVD of G(t) reveals that the
first three singular vectors serve as basis vectors for
the row space of G(t), accounting for over 99% of the
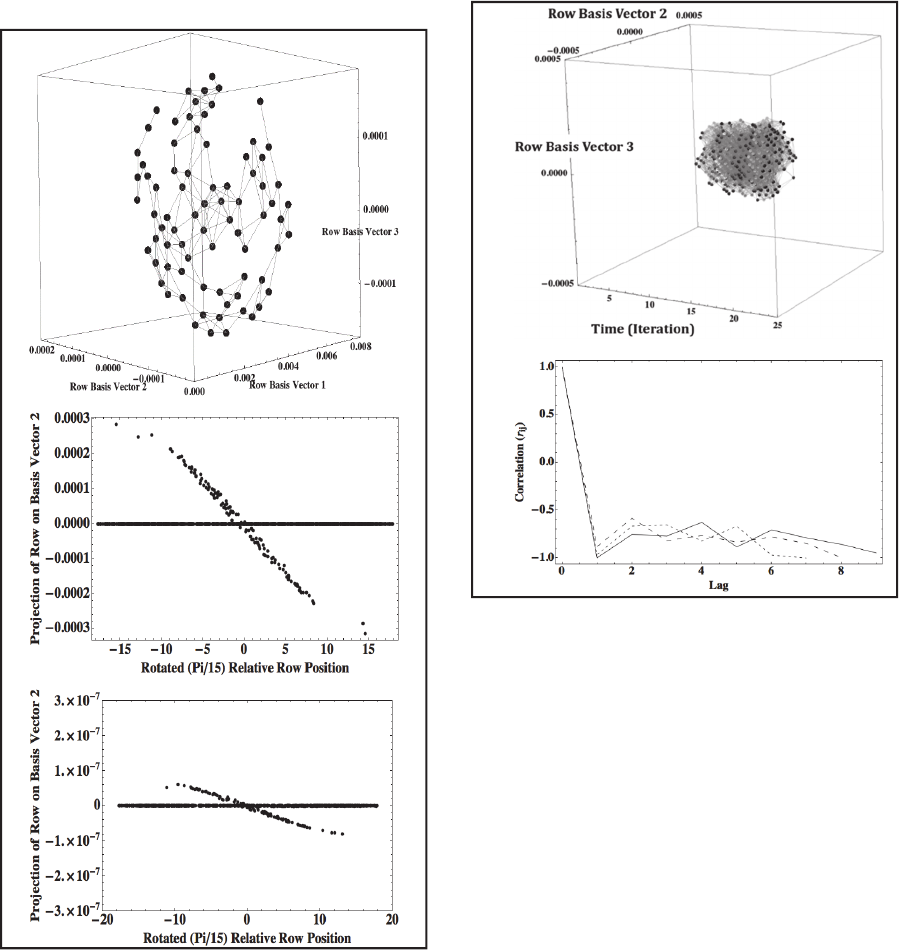
variance in the entries of the matrix. The top panel of
Figure 3 shows row projections on the basis vectors
for a COS that results from an 11 x 11 pixel input
image on one iteration of the simulation.
The log of the projections of conductance vectors
on the first basis vector are linearly dependent on the
time of the most recent AP (r
2
> 0.99). This is
expected because each conductance falls off
exponentially over time following the most recent
AP. The projections of each conductance vector on
the second and third singular vectors are linearly
related to the relative row and column position of the
neuron giving rise to that conductance vector. It is not
possible to quantify the goodness of fit with a single
correlation coefficient because the slope of the best-
fit line is much smaller for smaller conductance
values that are produced by APs occurring in the past.
This is illustrated by the middle and bottom panels of
Figure 3, which show projections of conductance
vectors plotted as functions of each neuron’s row
position in the lattice shown in Figure 2. For
simplicity, axes of all subsequent plots of COSs will
continue to be labelled as Row Basis Vectors.
2.2 Connected Open Sets of Vectors of
Conductances Result from
Tolerance to Small Differences in
Recurrent Inputs
It is easy to recognize a natural source of tolerance in
the RNN. Adjacent excitatory neurons are very likely
to receive virtually identical inputs from retinal
neurons and from other RNN neurons. They are
therefore likely to fire very similar trains of APs and
thus to produce very similar vectors of conductance
values. This is confirmed by simulations. For
example, closely positioned neurons that recently
fired an AP in response to a 7 x 7 image yield a mean
difference between conductance vector magnitudes
NEUROTECHNIX 2015 - International Congress on Neurotechnology, Electronics and Informatics
84
equal to 5.05 x 10
-6
(se = 2.23 x 10
-7
)
and a mean
difference in angular orientations of .03 rad (se = 4.46
x 10
-4
). Such small differences in conductance vector
magnitudes and orientations are of no consequence
with respect to their impact on the temporal evolution
of conductance vectors.
Figure 3: Plot of COS conductance vector projections on
three dominant singular vectors (top). Vectors within a
tolerance are joined by lines. The projection of each
conductance vector on the second singular vector is linearly
related to the rotated row position of the neuron giving rise
to that conductance vector with a slope determined by the
time of the most recent AP (middle, bottom). See Sections
2.1 and 2.2 for details.
Frequency histograms of vector magnitude
differences and orientation differences imply that a
magnitude difference less than 10
-4
and an orientation
difference less than .03 rad are appropriate criteria for
a pair of vectors to belong to the tolerance relation.
Figure 4: A COS occurs on iterations 11-20 in response to
an 11 x 11 input image presented on iterations 6-15 (top).
Projections of conductance vectors on the second and third
basis vectors for the rows of conductance matrix G(t) are
shown as a function of iteration number. Conductance
vectors on successive iterations that are within a tolerance
are joined by light gray line segments. No lines are drawn
between vectors within a tolerance on a given iteration for
this and subsequent figures. The solid curve in the bottom
graph plots the function r
ij
for iteration i= 11 of the
simulation, the dashed curve plots results for i=12, and the
dotted curve plots results for i=13. Lag = t
j
– t
i
.
The top panel of Figure 4 plots the COSs that arise
from an 11 x 11 pixel input image. The image was
shown on iterations 6-15, and COSs appear on
iterations 11-20. In this figure, the iteration number is
used as the x-axis, and the second and third singular
vectors are used for y and z as they were in Figure 3.
Conductance vectors on successive iterations that
meet tolerance criteria are joined by gray line
segments. The spatiotemporal consistency in COS
composition occurs jointly with large fluctuations in
neurons giving rise to vectors in the COS. This is
Toward Sentient Neurotechnology - Visual Object Unity May Be Structured by and Constrain Neural Interactions
85
demonstrated by the bottom panel, which plots the
simple correlation function
r
i
j
= (N
i
j
- N
i.
- N
.
j
) / D
i
j
(1)
where N
ij
is the number of distinct pairs of neurons
giving rise to conductance vectors within a tolerance
(tolerance pairs) at times t
i
and t
j
, N
i.
is the number of
tolerance pairs that are present at time t
i
but not at
time t
j
, N
.j
is the number of tolerance pairs that are
present at time t
j
but not at time t
i
, and D
ij
is the total
number of distinct tolerance pairs present at time t
i
or
at time t
j
. The majority of tolerance pairs occurred
only once or twice over the 10 iterations of the
network for which the correlation function is plotted
in Figure 4. Thus, similar conductance vectors are
produced on sequential iterations by different pairs of
neurons.
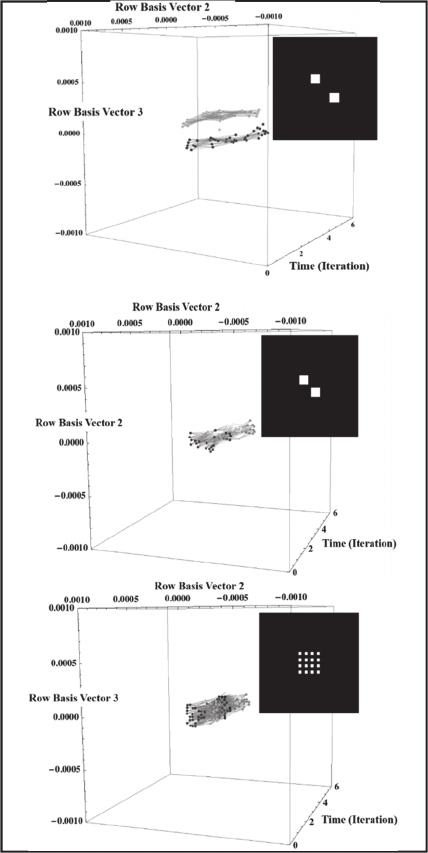
2.3 COS Phenomena Mimic Visual
Phenomena
COSs demonstrate just noticeable differences (jnd’s)
and grouping by proximity. These phenomena are
demonstrated by simulation results depicted in Figure
5. The COSs are shown after the RNN has stabilized
(i.e., beginning on iteration 12).
It has been shown that fMRI data from human
primary visual cortex (V1) show a moving pattern of
activation during perception of real motion and
apparent motion (Larsen et al., 2006). It is of interest
that the COSs that emerge from the smooth motion of
an image and from simulation of the conditions for
apparent motion behave very similarly to V1 fMRI
data. The COSs that result from these two conditions
over 20 iterations are shown in the top and bottom
panels of Figure 6.
In a similar fashion, COSs track the change of
orientation of the image of a rectangle, a change of
size of a square, and rotation of a rectangle, as shown
in Figure 7. The behaviour of the COSs mimics object
constancy over similar changes in object images.
3 IS A COS IN RECURRENT
NETWORK INPUTS A MODEL
OF LARGE-SCALE ORDER?
Results presented in Section 2.2 demonstrate that
similar pairs of conductance vectors that are elements
of a COS are produced by different pairs of neurons
on sequential iterations of the simulated RNN.
Figure 5: Two COSs emerge in response to two, 3x3 pixel
images that are separated by three pixels diagonally (top).
One COS emerges when the diagonal separation is reduced
to one pixel (middle). Grouping by proximity results in one
COS to an image of 16 one-pixel elements with one-pixel
spacings (bottom).
This finding suggests the possibility that a COS
models emergent large-scale order that is invariant
over participating neurons. COS phenomena that
mimic visual phenomena (Section 2.3) are consistent
with this possibility. For example, a single COS
persists over time even as size and orientation of an
image change, and a COS persists under the
conditions of apparent motion, which involve brief
elimination of the image of an object.
NEUROTECHNIX 2015 - International Congress on Neurotechnology, Electronics and Informatics
86
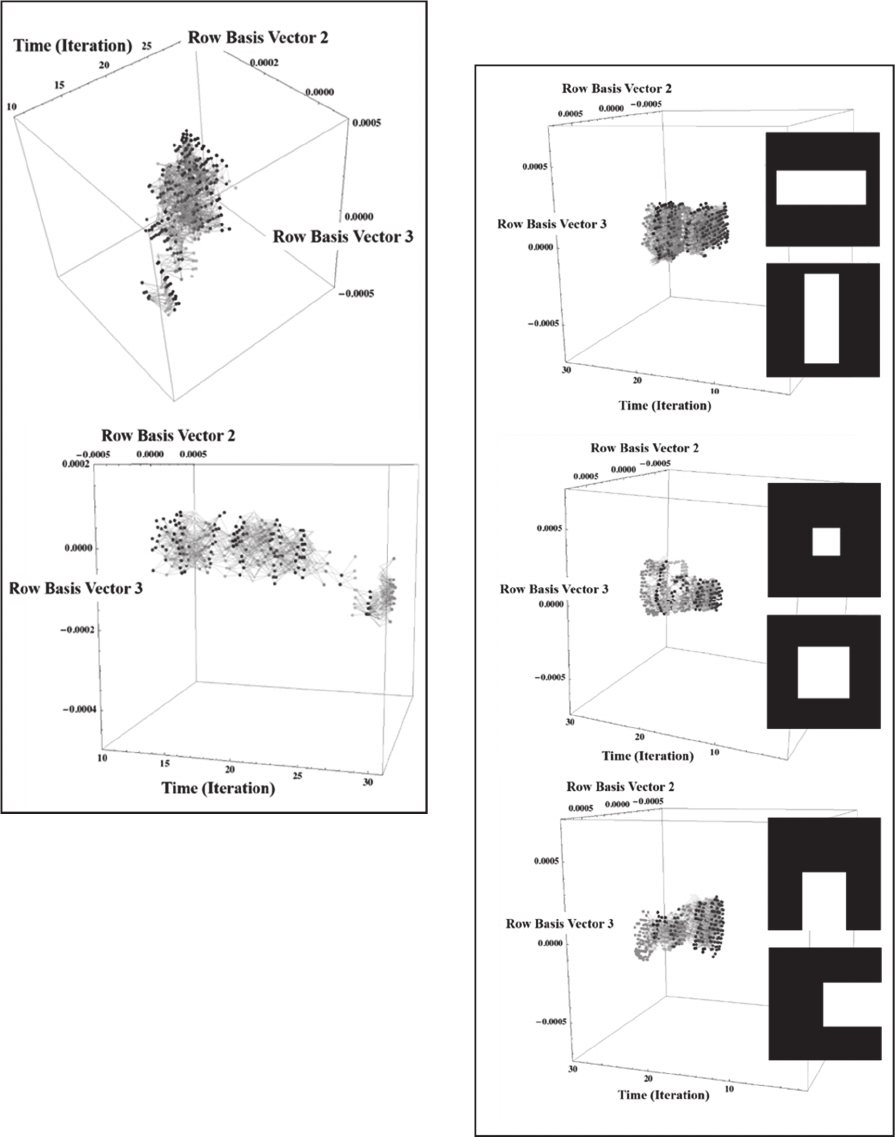
Figure 6: The COSs in the top panel on iterations 11-30
result from an 11 x 11 image shown in one corner for 10
iterations, then shown displaced by 5 pixels horizontally
and vertically for 5 iterations repeatedly until finishing at
the diagonally opposite corner for 5 iterations. The COSs in
the bottom panel shown on iterations 11-30 result from a 5
x 7 image shown in one position for 20 iterations, then not
shown for 2 iterations. Each point is then displaced
vertically by 9 pixels and shown for 10 iterations.
These results should be replicated using a much
larger scale simulation that would include
arrangements of a retina and RNN with receptive
fields that overlap like those in mammalian visual
systems. This would permit the use of more realistic
images of multiple objects and should also enhance
the similarities in recurrent inputs between adjacent
neurons. In addition, asynchronous updating using
very small time steps would more closely
approximate biological vision and should enhance the
temporal persistence of COSs.
Figure 7: COSs smoothly track step changes in orientation
(top) and in size (middle), and a step rotation (bottom). The
top image of each pair was shown for 15 iterations and
replaced by the bottom image for 15 iterations, and the
COSs are plotted from iterations 16-30.
Toward Sentient Neurotechnology - Visual Object Unity May Be Structured by and Constrain Neural Interactions
87
A network with these characteristics should make
it possible to analyse the projections of G(t) on row
basis vectors for the presence of topological
properties such as the number of connected objects
and the number of holes. Such work would provide
an approach that would complement the direct
introduction of a tolerance relation, as done here.
Two strategies might be then be followed in
testing the hypothesis that large-scale topological
objects emerge within recurrent interactions. The first
is to use simulations in order to determine if a COS
possesses typically-observed properties of such large-
scale order. We expect to find a control parameter that
can be varied to modulate the shape of a potential that
is a function of an order parameter, such as the density
of a COS (e.g., number of conductance vectors per
unit volume). Using data gathered from human
participants (see Section 4), we will attempt to find a
potential function empirically, and to incorporate this
in simulations in order to make predictions that can
then be tested with human participants.
A second strategy involves implementing a RNN
in an electronic circuit. In principle, it should be
possible to interface an analog electronic RNN with a
biological visual system so that they cooperate to
produce one or more COSs. Such an arrangement
could serve both as a critical test of ideas that underlie
the approach to the hard problem that is advocated,
and as a prototype for a prosthetic device. There is no
question that many difficult obstacles must be
overcome for this strategy to become feasible. Poon
and Zhou (2011) provide a fairly recent overview of
the challenges and opportunites presented by
neuromorphic silicon neurons and large scale neural
networks, and a wide-ranging and thorough review of
such circuits is provided by Indiveri et al., (2011).
4 IS A COS IN RECURRENT
NETWORK INPUTS AN
OBJECTIVE SIGNATURE OF
PERCEIVED OBJECT UNITY?
The results presented above are consistent with the
hypothesis that a COS of recurrent vectors of sodium
ion conductance is an objective signature of perceived
object unity. Empirical tests using data collected from
human participants and from non-human species are
required to test this hypothesis.
Two approaches to devising such tests are
considered in this section. The first approach is based
on comparisons of dynamical phenomena exhibited
by COSs in neural network simulations with
dynamical phenomena in human visual perception.
This approach has a strong existing basis in the
perception literature, particularly in work based on
Haken’s (1996) Synergetics. The second approach is
much more direct, as it is based on a search for
evidence of a COS in recordings of brain activity.
4.1 Do Perceived Object Unity and
COSs Exhibit the Same Dynamical
Phenomena?
In addition to the visual phenomena that are
mimicked by COSs as presented above, dynamical
effects of sequential presentations of stimuli are well
documented in perception. For example, categorical
perception of speech sounds has been shown to
exhibit both enhanced contrast and hysteresis (Tuller
et al., 1994). Enhanced contrast occurs when a
perception changes from one category to another at
one parameter value as values are initially increased
and at a higher parameter value as values are
subsequently decreased. In hysteresis, the change
occurs at a higher parameter value for initial increases
than for subsequent decreases. Tuller et al., (1994)
showed that the data collected from human
participants fit an underlying model for which
hysteresis dominates during early trials, and enhanced
contrast dominates as experience with the task brings
certain cognitive factors into play. The simple RNN
has no capacity for such cognitive functions, and is
therefore expected to display hysteresis.
The phenomenon of grouping by proximity was
used to test this hypothesis. The images used consist
of 140 one-pixel spots. One hundred of the spots are
repositioned randomly within the 33 x 33 pixel image
area on each iteration. The remaining 40 spots are
positioned randomly within a square window the
sides of which are reduced from a length of 33 pixels
to a length of seven over the first 31 iterations; the
sides increase over the remaining 30 iterations to the
original length of 33. The inset in the top panel of
Figure 8 shows images from iterations 1, 10, 20 (top
row), 30, 31, 32 (middle row), and 42, 52, and 61
(bottom row). The portion of the
graph with forward
arrows (→)
plots the size of the emergent COS as the
sides of the window containing the critical 40 dots is
initially decreased, and the portion of the graph with
backward arrows (←) plots COS size as window size
is subsequently decreased. It is clear that hysteresis is
present. We are currently testing human participants
with a version of the grouping by proximity task that
has been modified to make it appropriate for the
human visual system. The procedure used by Tuller
et al., (1994) for categorical perception of speech
NEUROTECHNIX 2015 - International Congress on Neurotechnology, Electronics and Informatics
88
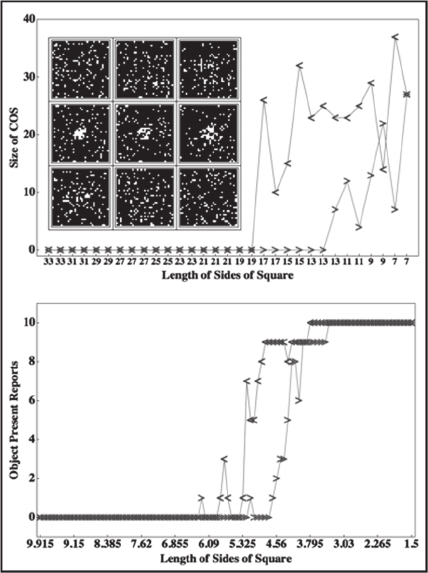
sounds was changed slightly in order to apply it to
perception of object unity. In this task, 1600 dots are
displayed on each trial. Of these, 1500 are randomly
positioned within a 10 x 10 square on each trial. An
additional 100 dots are randomly positioned within a
square window that grows or shrinks over trials. Dot
diameter is 0.2 percent of the width of the 10 x 10
square. The bottom panel of Figure 8 illustrates
results from five pilot subjects. On each of two blocks
of trials, the length of the sides of the square
containing the additional 100 dots was reduced from
10 to 1.5 over the first 100 trials and then increased
over the remaining 100 trials to the original length of
10. Hysteresis is present in the total number of reports
of a unified object (out of 10 maximum).
Figure 8: The top panel shows hysteresis in the number of
conductance vectors that are elements of a COS. The inset
shows simulated retinal images for nine iterations of one
simulation, as described in the text. The graph with forward
arrows (→) plots the number of conductance vectors in the
resulting COS on iterations 1-31, and the graph with
backward arrows (←) plots the size of the COS on iterations
32-61. This graph clearly demonstrates hysteresis. The
bottom panel shows hysteresis in perception of a unified
object for five participants.
4.2 Can the Presence of a COS Be
Inferred from Recordings of Brain
Activity?
A direct test of the hypothesis that a COS of
excitatory recurrent conductance vectors is indicative
of the experience of visual object unity would be
possible if extracranial or intracranial recordings
could be used to detect a COS. It is possible that large-
scale brain simulations and visualizations (e.g., Jones
et al., 2013) could answer this question.
Such large-scale simulations have been shown to
model successfully network dynamics of primary
visual cortex at multiple scales (e.g., Rangan et al.,
2009), and the network model appears to account for
V1 activity associated with the line-motion illusion
(Rangan et al., 2005). It is important to replicate the
strategy used by previous researchers in order to
determine if the presence of a COS produces a
signature in simulations of recorded activity that
include single unit, population, and
electroencephalogram recordings and optical imaging
with voltage-sensitive dyes. Some of these studies
would employ non-invasive methods and can be
performed with human participants. Others are
clearly invasive and would have to be performed with
non-human species.
5 CONCLUSIONS
Progress in the development of neurotechnologies is
necessarily limited by our current understanding of
the specific ways in which neural network activities
are involved with particular aspects or qualities of
conscious experience. The central problem that we
face is theoretical. It is precisely the famous ‘hard
problem’ (Chalmers, 1996; Hut and Shepard, 1996).
The introduction of a formal model of an aspect
of experience makes it possible to state a testable
hypothesis that bears directly on the hard problem:
the unified aspect of a visual object arises as a COS
of vectors of recurrent excitatory conductance values
emerges from cooperative network activity. Results
using a small RNN driven by simulated activity of
retinal neurons with a concentric receptive field
organization are very promising. These results
demonstrate a natural source of tolerance that
underlies the formation of a COS, and visual
phenomena that include just noticeable differences,
grouping by proximity, similarities to V1 fMRI
activity patterns in response to real and apparent
motion, and visual object constancy with changes in
size, shape and rotation are all reproduced by COSs.
Toward Sentient Neurotechnology - Visual Object Unity May Be Structured by and Constrain Neural Interactions
89
The COS is also subject to the nonlinear phenomenon
of hysteresis that characterizes multistability in
perception.
It is important to use a variety of strategies to test
two hypotheses that arise from the work reported
here: (1) a COS of excitatory recurrent conductance
vectors is a model of large-scale order within
recurrent network interactions; and (2) such a COS is
an objective signature of the unity or oneness aspect
of a visual object.
ACKNOWLEDGEMENTS
The author wishes to thank Dr. Charles Lamb of the
IUP Department of Mathematics for the many
positive contributions that he has made to the work
reported here in our numerous discussions. The
author also thanks Mr. Ian Bright who collected the
pilot data reported in Section 4.1 and who contributed
in all aspects of that work. Two anonymous reviewers
are also thanked for their thoughtful and useful
comments.
REFERENCES
Block, N. (2001). Paradox and cross purposes in recent
work on consciousness. Cognition, 79, 347-357.
Block, N. (2007). Consciousness, accessibility, and the
mesh between psychology and neuroscience.
Behavioral and Brain Sciences, 30, 481-499.
Chalmers, D. J. (1996). The conscious mind: In search of a
fundamental theory. New York, NY: Oxford University
Press.
Chen, L. (2005). The topological approach to perceptual
organization. Visual Cognition, 12(4), 553-637.
Dehaene, S. (2014). Consciousness and the brain:
Deciphering how the brain codes our thoughts. New
York, NY: Penguin Books.
Edelman, G. M., Gally, J. A., Baars, B. J. (2011). Biology
of consciousness. Frontiers in Psychology, doi:
10.3389/fpsyg.2011.00004.
Haken, H. (1996). Principles of brain functioning: A
synergetic approach to brain activity, behavior and
cognition. New York, NY: Springer.
Huang, Y., Huang, K., Tan, T., Tao, D. (2010). A novel
visual organization based on topological perception.
Computer vision – ACCV 2009. Lecture notes in
computer science, Volume 5994, 180-189.
Hut, P., Shepard, R. N. (1996). Turning ‘the hard problem’
upside down & sideways. Journal of Consciousness
Studies, 3, 313-329.
Indiveri G., Linares-Barranco B., Hamilton T.J., van Schaik
A., Etienne- Cummings R., Delbruck T., Liu S-C.,
Dudek P., Häfliger P., Renaud S., Schemmel J.,
Cauwenberghs G., Arthur J., Hynna K., Folowosele F.,
Saïghi S., Serrano- Gotarredona T., Wijekoon J., Wang
Y. Boahen K. (2011). Neuromorphic silicon neuron
circuits. Frontiers in Neuroscience, 5:73. doi:
10.3389/fnins.2011.00073.
Jones, A., Cardoza, J., Liu, D. J., Jayet Bray, L. C., Dascalu,
S. M., Louis, S. J., Harris Jr., F. C. (2013). A novel 3D
visualization tool for large-scale neural networks. BMC
Neuroscience 2013, 14 (Suppl 1):P158
Larsen, A., Madsen, K. H., Lund, T.E., Bundesen, C.
(2006). Images of illusory motion in primary visual
cortex. Journal of Cognitive Neuroscience, 18(7),
1174-1180.
Minsky, M. L., Papert, S. A. (1998). Perceptrons: An
introduction to computational geometry (Expanded
edition).Cambridge, MA: MIT Press.
O’Reilly, R. C., Munakata, Y. (2000). Computational
explorations in cognitive neuroscience: Understanding
the mind by simulating the brain. Cambridge, MA: MIT
Press.
Pavloski, R. (2011). Learning how to get from properties of
perception to those of the neural substrate and back: An
ongoing task of Gestalt Psychology. Humana.Mente
Journal of Philosophical Studies, 17, 69-94.
Peters, J. F., Wasilewski, P. (2012). Tolerance spaces:
Origins, theoretical aspects and applications.
Information Sciences, 195, 211-225.
Pomerantz, J. R. (2003). Wholes, holes, and basic features
in vision. Trends in Cognitive Sciences, 7(11), 471-473.
Poon, C.-S., Zhou, K. (2011). Neuromorphic silicon
neurons and large-scale neural networks: Challenges
and opportunities. Frontiers in Neuroscience, 5:108.
doi: 10.3389/ fnins.2011.00108.
Rangan, A. V., Cai, D., McLaughlin, D. W. (2005).
Modeling the spatiotemporal cortical activity
associated with the line-motion illusion in primary
visual cortex. Proceedings of the National Academy of
Sciences, 102(52), 18793-18800.
Rangan, A. V., Tao, L., Kovacic, G., Cai, D. (2009).
Multiscale modeling of the primary visual cortex. IEEE
Engineering in Medicine and Biology Magazine, May
2009, 19-24.
Roelfsema, P. R. Houtkamp, R. (2011). Incremental
grouping of image elements in vision. Attention
Perception & Psychophysics, 73, 2542-2572.
Sterratt, D., Graham, B., Gillies, A., Willshaw, D. (2011).
Principles of computational modelling in neuroscience.
New York, NY: Oxford University Press.
Tuller, B., Case, P., Ding, M., Kelso, J.A.S. (1994). The
nonlinear dynamics of speech categorization. Journal
of Experimental Psychology: Human Perception and
Performance, 20(1), 3-16.
Zhang, J. (2005). Object oneness: The essence of the
topological approach to perception. Visual Cognition,
12(4), 683-690.
NEUROTECHNIX 2015 - International Congress on Neurotechnology, Electronics and Informatics
90
