Social Network Analysis for Predicting Emerging Researchers
Syed Masum Billah
1
and Susan Gauch
2
1
Computer Science, Stony Brook University, Stony Brook, NY, U.S.A.
2
Computer Science and Computer Engineering, University of Arkansas, Fayetteville, AR, U.S.A.
Keywords: Social Networks, Impact Factor, Relationship Mining, Author Impact Prediction.
Abstract: Finding rising stars in academia early in their careers has many implications when hiring new faculty,
applying for promotion, and/or requesting grants. Typically, the impact and productivity of a researcher are
assessed by a popular measurement called the h-index that grows linearly with the academic age of a
researcher. Therefore, h-indices of researchers in the early stages of their careers are almost uniformly low,
making it difficult to identify those who will, in future, emerge as influential leaders in their field. To
overcome this problem, we make use of social network analysis to identify young researchers most likely to
become successful as measured by their h-index. We assume that the co-authorship graph reveals a great
deal of information about the potential of young researchers. We built a social network of 62,886
researchers using the data available in CiteSeer
x
. We then designed and trained a linear SVM classifier to
identify emerging authors based on their personal attributes and/or their networks of co-authors. We
evaluated our classifier’s ability to predict the future research impact of a set of 26,170 young researchers,
those with an h-index of less than or equal to two in 2005. By examining their actual impact six years later,
we demonstrate that the success of young researchers can be predicted more accurately based on their
professional network than their established track records.
1 INTRODUCTION
Finding rising stars in academia is an interesting
problem. When departments hire new, young
faculty, they need a way to assess which of the many
candidates show the best potential. When funding
agencies or companies want to award funding, they
want to send to researchers with the highest potential
for having an impact on their field. Typically, the
impact and productivity of a researcher are assessed
by a popular, widely used metric called the h-index
that is defined as follows: “a scientist has index h if
h of his/her N
p
papers have at least h citations each,
and the other (N
p
− h) papers have no more than h
citations each” (Hirsch, 2005). Despite many
criticisms, this simple measurement is taken into
account when a researcher is applying for
promotion, requesting grants, or being interviewed
for a new position. Some new graduate students
even choose their advisors based on this score.
The h-index grows linearly with the academic age
and productivity of researchers (Guns et al., 2009).
Although it can be reasonably accurate for
established researchers, it fails to identify rising stars
from among a group of young researchers. In the
early stages of their careers, every researcher has an
almost identical, low, h-index.
Social network analysis has gained considerable
interest in recent years as a way of studying inter-
relationships among individuals. In most
approaches, the relationships between social actors
are modeled as a graph, allowing a variety of new
and existing graph algorithms to be applied.
Applying social networks to a research community,
co-authorship graphs have been widely studied,
wherein nodes represent researchers, and edges
represent co-authorship between pairs of nodes.
Properties of social graphs are described with
respect to two levels: ‘global graph metrics’ and
‘local graph metrics’. Global graph metrics consider
the characteristic of the graph as a whole e.g., its
diameter, mean node distance, betweenness, size of
the giant component, clusters, small-worldness
(Watts, 2001), etc., whereas the ‘local metrics’ relate
to the features native to individual nodes such as
degree, neighborhood, etc. (Scott, 2000). Although
they are well-defined, little work has been done to
Billah, S. and Gauch, S..
Social Network Analysis for Predicting Emerging Researchers.
In Proceedings of the 7th International Joint Conference on Knowledge Discovery, Knowledge Engineering and Knowledge Management (IC3K 2015) - Volume 1: KDIR, pages 27-35
ISBN: 978-989-758-158-8
Copyright
c
2015 by SCITEPRESS – Science and Technology Publications, Lda. All rights reserved
27
study the ability of these metrics to predict an
author’s impact.
We argue that the co-authorship graph reveals a
great deal of information about the potential of
young researchers. The basic idea is that young
researchers with strong social connections to
established researchers are more likely to have
successful research careers. Our intuition is that
these young researchers benefit from superior
mentoring, and have strong colleagues who will
continue to work with them as they establish their
own, independent research careers. In this work, we
will evaluate the ability of a variety of local graph
metrics to identify, from among a set of new
researchers, those who have the most potential to
have an impact on their field. This addresses a
weakness of the existing h-index, its inability to
predict future success.
In this paper, we study a social network of
authors in Computer Science. To do so, we build a
weighted, undirected graph in which authors are
nodes, co-authorships and the weights represent the
number of papers on which the authors have
collaborated. We focus our study on new authors
within the social network, i.e., those with few
publications and thus a low h-index. Our goal is to
predict which of the authors within that set will
emerge as influential researchers within a few years.
In this work, we define two classes for these new
authors, namely ‘emerging’ and ‘non-emerging’ in
terms of their h-index 6 years later. Then, we study
the members of the two groups to identify which
features of the authors and their social networks
allow us to distinguish between the two classes of
authors. With the class definitions and features in
hand, we train a Support Vector Machine (SVM)
classifier using the historical data available in
CiteSeer
x
database. Once the SVM is trained, it is
used to predict the potential impact of unseen, young
researchers.
In a nutshell, our contributions are as follows: (1)
we offer a list of individual and social factors that
are important for success in an academic position;
and (2) we create a classifier to find emerging
researchers from among a set of low-impact
researchers.
The rest of the paper is organized as follows. In
Section 2, we present the existing works on h-index
and social network analysis in different use cases.
Section 3 describes our system. Section 4 contains
experimental results, and Section 5 summarizes our
findings and offers suggestions for possible future
improvements.
2 RELATED WORK
2.1 H-Index
In 2005, Hirsch proposed the h-index measure to
characterize the cumulative impact of the research
works of individual scientists. Since then it has been
drawing widespread attention of the scientific
community, policy-makers, and the public media. It
has been enthusiastically received by scientific news
editors (e.g., Ball (2005)), and researchers in various
fields of science (e.g., Popov (2005), Batista et al.
(2005), etc.). At the same time, it has been criticized
as well. Some of the criticisms are as follows: the h-
index relies on pure citation counts treating all
citations as equal and ignores the context of citations
(Lindsey, 1989; Lawrence, 2007); 40% of citations
were found to be irrelevant (Moravcsik et al., 1975);
it never decreases, and does not account the number
of coauthors of a paper.
However, in a study on committee peer review,
Bornmann and Daniel (2005) found that, on average,
the h-index for successful applicants for post-
doctoral research fellowships was consistently
higher than for non-successful applicants. This
particular result justifies our assumptions. Although
h-index does not accurately measure the productivity
of young researchers, after a 5- or 6-year window, it
can be considered as an important success indicator.
2.2 Social Network Analysis
Social network analysis (SNA) is not a formal
theory, but rather a wide strategy for investigating
social structures. As pointed by many researchers
such as Watt (2001), Scott (2000), Wasserman and
Faust (1994), SNA borrows most of its core
concepts from sociometry, group dynamics, and
graph theory. Some of those borrowed notions and
metrics are discussed in the following sections.
Throughout our discussion, we use the terms graph
and network, node and author interchangeably.
A graph G (V, E) is an ordered pair of (V, E),
where =
{
:
}
is a set of
vertices or nodes, and ={
,
:
∈
∈} is a set of edges or links. A graph G
(V, E) is called multigraph when multiple edges are
permitted between two vertices.
A component of a graph G (V, E) is a subgraph
G’ (V’, E’), where
⊆,
⊆, and there exists a
path between any nodes in V’. If the whole graph
forms one component, it is said to be fully
connected.
KDIR 2015 - 7th International Conference on Knowledge Discovery and Information Retrieval
28
Degree centrality of a node in an undirected
graph is simply the number of edges adjacent to this
node. For a node i, the degree centrality d(i) is
defined by
(
)
=
∑
, where
=1 if there is
an edge between nodes i and j, and 0 otherwise. For
directed graphs, it becomes in-degree and out-
degree centralities depending on the edge direction.
In a co-authorship graph, the degree centrality of a
node is just the number of authors in the graph with
whom he or she has co-authored at least one article.
Social network analysis has a history of at least
half a century, and it has produced many results
related to social influence, inequality, groupings;
disease and epidemic propagation; information flow,
and ‘indeed almost every topic that has interested
20th century sociology’ (Wasserman 1994; Otte,
2002; Watt, 2001; Scott, 2000; Farkas, 2002;
Garfield, 1979).
Diverse phenomena can spread within social
networks. For example, there exists a number of
scientific evidence that suggests that ‘influence’ can
induce behavioral changes among the agents in a
network. In 2007, Christakis et al. conducted an
intriguing study to determine whether obesity might
also spread from person to person (Christakis et al.,
2007). They concluded that a person’s chances of
becoming obese increased by 57% if he or she had a
friend who became obese in a given interval. We are
also motivated by somewhat similar intention: if a
researcher collaborates with other ‘good’
researchers, does the ‘goodness’ flows towards him
or her?
2.3 Coauthorship Networks
Co-authorship networks, in which two researchers
are considered connected if they have co-authored
one or more scientific papers, are one of the most
extensively studied social networks. Garfield (1979)
conducted an early work in this area under the guise
of citation network analysis. In comparison to
citation, co-authorship implies a much stronger
social bond, since it is likely that pair of scientists
who have co-authored a paper together are
personally known to each other (Newman, 2001).
Currently, the publication record of scientists is well
documented by a variety of publicly available
electronic databases; and unlike citation data, co-
authorship data are available immediately after the
publication of a paper. This allows for the
construction of large and relatively complete
networks via automated means.
One of the early examples of a co-authorship
network is the Erdös Number Project wherein the
smallest number of coauthorship links between any
individual mathematician and the Hungarian
mathematician Erdös is calculated (Castro, 1999).
Newman (2001) studied and compared the
coauthorship graph of four major databases (arXiv,
Medline, SPIRES, and NCSTRL) and measured
different network parameters such as average
number of publications, degree, coauthors of a node;
clustering factors; the size of the giant component;
betweenness-based node centrality; and phenomena
such as the ‘funneling effect’. He showed that some
of these parameters are correlated with an individual
author’s impact versus his or her peers.
Similar studies have been conducted by
numerous researchers on different digital libraries,
conference papers, and journals articles as well. For
example, Smeaton et al. (2002) studied the
coauthorship graph for papers published at SIGIR
conferences, Nascimento et al. (2003) focused on
SIGMOD, and He et al. (2002) on JASIST papers. A
large body of works in the literature (Newman,
2001; Farkas, 2002; He, 2002) has been dedicated to
finding the ‘influential’ or ‘center’ nodes in
coauthorship networks. Early efforts utilize different
global graph metrics such as betweenness and
clustering (Adali, 2011) to locate ‘social Superstars’
in the network.
Other recursive algorithms are also being used to
measure the ‘prestige’ of the nodes in social network
analysis (Liu, et al., 2005). PageRank (Brin and
Page, 1998) was originally developed by Page and
Brin to rank web pages by their importance within
the Google search engine. Although it was applied to
a network in which nodes represented web pages
and links hypertext references, it has been applied by
Xiaoming et al. (2005) to a coauthorship network. In
their work, called AuthorRank, they found that
AuthorRank outperformed degree, closeness and
betweenness centrality metrics in identifying
program committee members, i.e., influential
members of the research community. Similarly, the
HITS algorithm developed for web page ranking has
also been used to identify influential authors
(Kleinberg, 1999).
Irfan et al. (2013) take a game theoretic approach
to identify the most influential nodes in a network.
They applied their approach to the network of the
U.S. Supreme Court Justices and the network of
U.S. senators. In these graphs, they identified a
small coalition of senators that could prevent
filibusters.
We have summarized several existing projects
that apply social network analysis to co-authorship
graphs that all focus on finding the most influential
Social Network Analysis for Predicting Emerging Researchers
29
authors. Although this is an interesting problem, it is
also a problem that the existing h-index addresses
reasonably well. Our goal is to tackle a problem for
which the h-index is poorly suited. In our previous
work (Billah, 2013), we showed that social network
analysis can be used to identify ‘rising-stars’ from
among a group of new authors. In that work, we
also presents an architecture that provides a generic
framework for running different experiments on a
social network of researchers. In the research
presented here, we report on a specific experiment
using that framework: can social network features
alone tell us something about the prospects of the
new researchers?
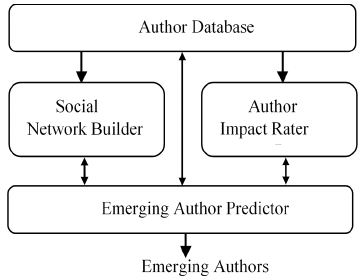
3 OUR DESIGN
The system for identifying emerging authors
consists of four building blocks: an Author
Database, a Social Network Builder, an Author
Impact Rater, and an Emerging Author Identifier
(Billah, 2013). Figure 1 diagrams the main
components of the system architecture that are
discussed in more detail in the following
subsections.
Figure 1: Block Diagram of our System.
3.1 Author Database
One difficulty in building a social network of
authors is to accurately identify all of their works.
Author names may appear in many different
formats, so we need to normalize the names and
collect information on a per author basis rather than
a per name basis. The main purpose of this module
is to provide the fully qualified names of the
researchers together with their publications and
citation records. It also contains a rich set of
metadata associated with each scientific paper such
as publication year, venue, bibliography, citations by
year, etc.
Our primary source of data is CiteSeer
x
, a well-
known scientific document digital library. It is an
automatic citation indexing system that indexes
academic literature in electronic format (e.g.
Postscript files on the Web) (Giles et al., 1998). As
of 2013, it contains 308,116 authors from different
academic disciplines; 2,190,179 entries for papers;
and 25,982,373 citation records. Since the whole
library is built in an automated manner, there are
many identity duplications, ambiguities, and noise.
One quick way to disambiguate the names is to use
another source of information for cross matching.
Microsoft Academic Search (MAS) (2013)
provides services similar to CiteSeer
x
, and it is
comparatively less noisy. Papers are associated with
authors, regardless of the format in which the name
appears in the paper. Although we use CiteSeer
x
as
the basis of information for our social network, we
make use of the disambiguated author names
available in MAS, using a crawler to collect the
99,982 canonical names of researchers in the field of
Computer Science.
Our next goal is to identify unique authors from
ambiguous names in the CiteSeer
x
database. We
have two sets of names: 99,982 canonical names
(‘first name’, ‘middle name/initial’,’ last name’)
from MAS and 308,116 noisy names from CiteSeer
x
.
To identify unique authors in CiteSeer
x
, we take the
intersection of these two sets, ending up with 62,884
names (exact matches). We expect each of these
names represent unique authors, although there
might be some homonymous authors.
3.2 Social Network Builder
This module builds co-authorship multigraph G(a)
for an individual a who exists in the Author
Database. The multigraph representation allows us
to generate an instance or snapshot of co-authorship
graph (G
t
(a)) of an individual a at a specific
time/year, t.
Generating G
t
(a) from G(a) at a particular time t
requires only the merging of multiple edges between
each pair of nodes under certain condition(s). For
example, to get a co-authorship graph up to the year
2005, we simply (i) count the number of edges
between each pair of nodes in G(a) with property
‘publication year’ ≤ 2005, and (ii) replace those
edges with a single edge having weight equal to the
count. Therefore, the snapshot graph G
t
(a) is an
undirected weighted graph. We use Neo4j (2013)
graph database to facilitate all these operations.
KDIR 2015 - 7th International Conference on Knowledge Discovery and Information Retrieval
30
3.3 Author Impact Rater
The Author Impact Rater’s primary purpose is to
compute the impact factors (h-index) of the authors
in the Author Database, at a given year/time t. Then,
based on the impact scores, it outputs a list of low-
impact authors at time t, which is fed to the next
module of our system.
We calculate the h-index of an individual author
using the metadata available in CiteSeer
x
. For a
particular author, we collect all of the papers he or
she has written and sort those papers by their
citations. Both publications and citation data are
collected from CiteSeer
x
.
3.4 Emerging Author Predictor
Emerging Author Predictor (EAP) is fundamentally
a binary classifier. From the feeds of the Social
Network Builder, the Author Impact Rater, and the
Author Database modules, the EAP performs the
tasks necessary to predict emerging authors, i.e.,
those whose research impact is likely to increase
substantially in the years to come. The EAP can be
implemented using many different features, and
these are compared to the authors’ actual future
performance to evaluate which features or
combination of features are the most effective in
Section 4.
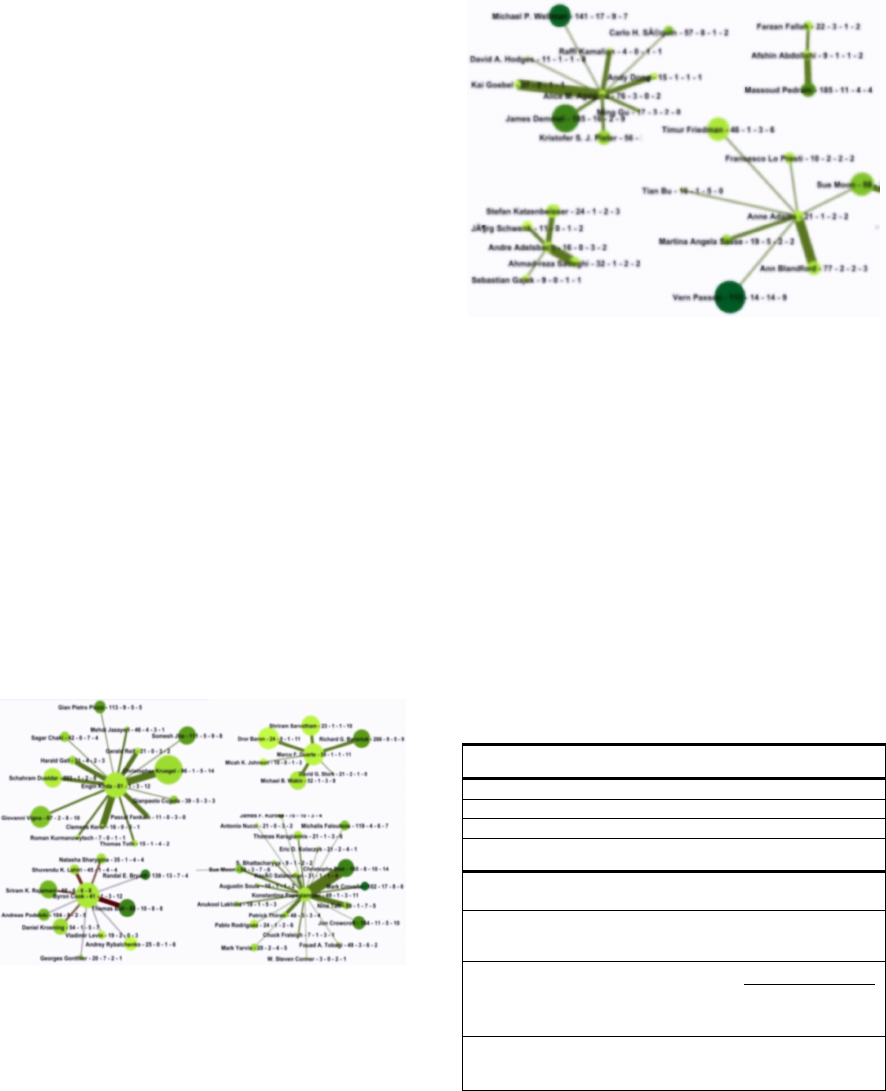
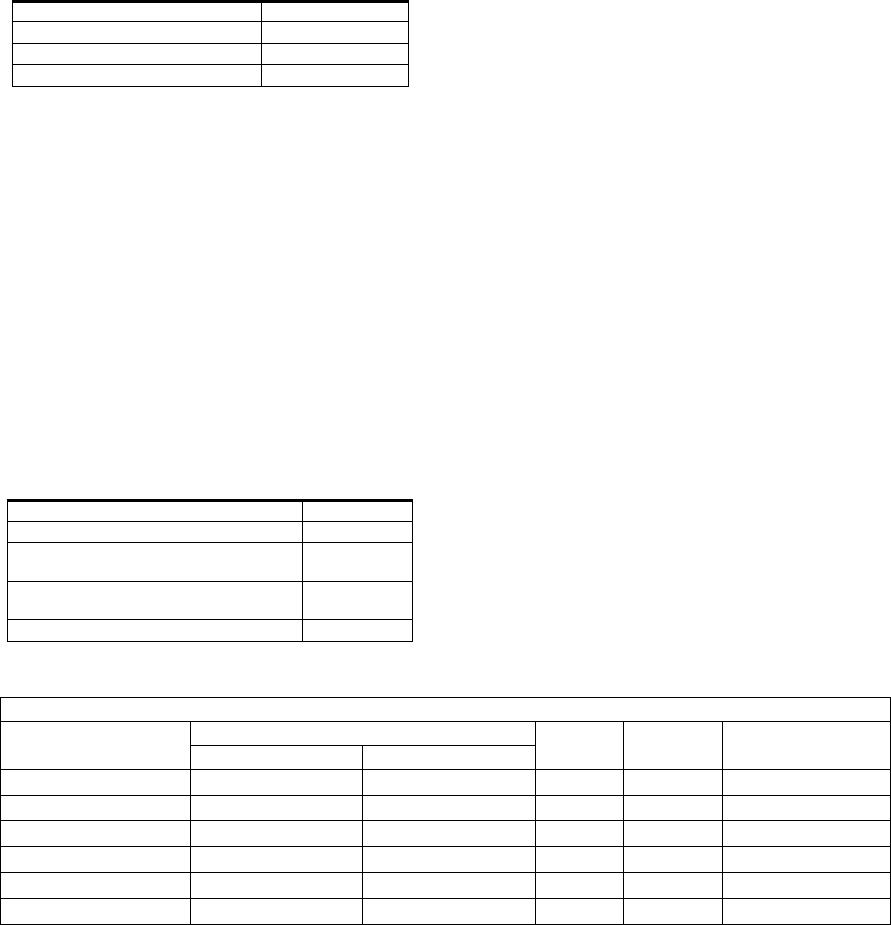
To build our intuition about the relationship
between low-impact authors’ co-authorship
networks and their future research success, we
studied their 1-level deep neighborhood graphs.
Figures 2 displays the co-authorship graphs for four
authors who had much higher h-indices in 2011, i.e.,
‘Emerging’ authors. Similarly, Figure 3 shows the
same graphs for four ‘Non-Emerging’ authors.
Figure 2: Social Network of Emerging authors. The nodes
are also labeled with author names and other network
features. Although we intentionally blurred the figure to
make the names unreadable, it is the graph structure that is
key.
The center node of each graph is the author being
studied, the size of each node represents the increase
in h-value from 2005 to 2011, and the color
represents their h-indices as of 2005. Thus, a large,
dark circle indicates a researcher who had high h-
index as of 2005 and whose h-index grew from 2005
to 2011 substantially.
Figure 3: Social Network of Non-Emerging authors.
Again, it is the graph structure that is the key.
We observed that co-authorship graphs of the
Emerging authors exhibit the following
characteristics:
- They have higher degrees than non-emerging
authors (more co-authors).
- Their neighbors are also dynamic (larger circles)
- Their neighbors have higher h-indices (darker in
color).
Based on these observations, we identified
features that we wish to study to evaluate their
effectiveness at predicting emerging authors. These
are grouped into two main categories: personal
features and social features, listed in Table 1.
Table 1: Features Extracted for Low-Impact Authors.
Personal Features
Features
.
_
() = total number of citations of n at t
.
_
(
)
= total number of publications of n at t
Social Features
.
(
)
=
|
(
)|
, where
(
)
is the set o
f
adjacent nodes of n in the co-authorship graph at time t.
. . ℎ
ℎ =
(
∑
ℎ-
(
)
∈
(
)
) /degree
t
(n)
. . ℎ
ℎ
""
=
∑
ℎ-
(
)
∈
(
)
/
_
()
(see Section 3.4.2)
6.
_
∆ℎ
_
() =
∑
(ℎ
(
)
−
∈
(
)
,
−ℎ
(
)
)
Social Network Analysis for Predicting Emerging Researchers
31
3.4.1 Personal Features
As for personal features, we choose to use the most
popular and easily quantifiable metrics for a
researcher, such as the number of their publications,
and the number of citations to their existing works.
Since h-indices of the young researchers are almost
uniformly low, we do not use the h-index as a
feature. Our results will demonstrate that in
comparison to a researcher’s social features, these
early-stage personal features contribute very little to
no information about his or her future research
prospect.
3.4.2 Social Features
We compute the social features of a researcher
solely from his or her coauthor graph. One obvious
feature is degree count or the number of co-authors
an author has at a particular time. Also, we capture
the dynamism of an author’s neighbors by
computing their cumulative change of h-indices in
the past (feature 6). Similarly, the richness of a
researcher’s neighborhood is measured by summing
up all the h-indices of his or her neighbors, and
taking the average by dividing that quantity by his or
her degree (feature 4).
The most interesting feature in this category is
feature 5 (Table 1), where we divide the total h-
indices of a researcher’s neighbors by the square
root of his or her citation count. We’ll show that the
square root of an author’s total number of citations is
an indication of his or her number of ‘good’ or
‘cited’ publications.
According to Hirsch (2005), a total number of
citations (num_citations) of an author is proportional
to his or her hindex
2
. Therefore, we can also say
ℎ
∝ _, or ℎ ∝
√(_). Since h-index of ‘h’ means an
author has at least h ‘good’ or ‘cited’ publications
(num_good_publications), we can further write
__ ∝ √(_).
Thus, feature 5 considers the relationship between
an author’s number of ‘good’ publications to the h-
indices of his or her neighborhood.
4 EXPERIMENT
4.1 Dataset
To build a reliable dataset, we need a set of low-
impact authors whose future success is known. The
authors are separated into two classes: Emerging
(E) and Non-emerging (NE) based on their h-indices
at time t, and the increase of h-indices at time t + Δt,
where both t and t + Δt are in the past, and values of
the h-indices are also known. We choose to use Δt =
6 years, and time t=2005.
According to Bornmann et al. (2005), an h-index
of 5.15 is an indication of a successful researcher.
Based on their work, we define ‘low-impact’ authors
as authors having h-index<= 2 at t=2005. Among
them, if an author’s h-index is increased by at least 4
at a later time, (h-index >= 6 at t + Δt=2011), then
he or she is considered as Emerging (E), otherwise
they are considered Non-Emerging (NE).
From our dataset (Citesser
x
), we extracted 26,170
authors who were low-impact authors in 2005.
Based on their h-indices in 2011, 1,164 were labeled
Emerging (E), and the remaining 25,006 were Non-
emerging (NE). We split these authors into two sets,
using 70% for training (894 E and 19,234 NE) and
30% testing (270 E and 5,772 NE). We further
divide the training set into two halves, and perform
5-fold cross-validation and grid search on one-half
to figure out the optimal model parameters. Once the
optimal parameters are found, we train our classifier
on the entire training set.
4.2 Experimental Setup
We used a Support Vector Machines (SVM)
classifier, specifically the LIBLINEAR package (Fan
et al., 2008). Since the training data is very
unbalanced, (i.e., non-emerging authors are ~22
times more than the emerging authors), we use
different class weights (e.g., the E class is 22 times
heavier than the NE class). Also, prior to training the
classifier, we normalize each of the individual
features to lie between [0-1] range. In order to show
the relative strength of personal vs. social features,
we trained three models: the first one uses only the
personal features, the second one uses only the
social features, and final one sees all the personal
and social features listed in Table 1 in section 3.4.
4.3 Results
Table 2 shows the classification accuracy reported
on our testing set for each of our three classifiers.
Not surprisingly, the personal features did not do
well, resulting in only 61% accuracy in predicting
future emerging authors. In contrast, the social
features by themselves did the best, resulting in 82%
accuracy. The combination of all features showed a
dip in performance (accuracy 81%) versus social
network features alone. Because the personal
KDIR 2015 - 7th International Conference on Knowledge Discovery and Information Retrieval
32
features were very weak predictors, combining them
with social features actually degraded the classifier
accuracy. Furthermore, based on a student t-test, the
social features are statistically significantly better
than the personal features (p = 9.8071E-1343) at
predicting success, but a classifier trained on all
features is not statistically significantly worse than
the classifier using social features alone (p =
0.2604). This data supports our hypothesis that
social features that capture an author’s connections
to their research community are important for
predicting their future research impact.
Table 2: Classification Accuracy.
Features Accuracy (%)
61.357
82.657
81.529
4.4 Relative Importance of Social
Features
We configure and use LIBLINEAR package in a
way that it internally maintains a linear model and
learns weights for each individual feature.
Therefore, by looking at the weights, we can get an
idea of relative importance of different social
features (see Table 3). From Table 3, we can say
that, in general, the degree (feature 3) of an author
impacts mildly negatively, but being connected to a
high h-index neighborhood helps greatly. On the
contrary, if an author’s number of highly-cited
publications (or h-index) is comparatively lower
Table 3: Relative Strength of Social Features.
Features Weight
.
(
)
-7.913
..
107.468
. . ℎ
ℎ
""
-23.203
6.
_
∆ℎ
_
()
27.059
than the average h-index of his or her neighborhood,
then it has a negative impact. Finally, connection to
a dynamic neighborhood that grows rapidly has
strong positive impact on an author’s prospect in the
future.
4.5 Prediction
We validated our model by applying it to low-
impact authors in 2011 to see how well it predicts
emerging authors in 2014, three years later. We ran
our model on 8,849 researchers who had an h-index
of 2 or less in 2011. Table 4 lists the top six authors
with the highest predicted likelihood of emerging as
top researchers in their field. We report their current
impact (in 2015) by extracting data from Google
Scholar (2015). Also, we present the ranking of their
currently affiliated institutions from the U.S. News
and World Report (2015). Our model successfully
predicts relatively unknown researchers at that time
whom had strong potential. In fact, most of the top
predicted researchers are now influential and this top
group has an average h-index of 19, a very strong
growth in impact in just four years. Although our
current work is not specific for predicting a future h-
index, we are looking forward to comparing our
results with existing work such as (Acuna and
Kording, 2012) that has this specific goal.
5 CONCLUSION
In this paper, we empirically classify young
researchers into two classes, namely emerging and
non-emerging, depending on their h-indices. Then,
we investigate which are the key characteristics of
emerging authors based on their personal and social
features. We concluded that the success of a young
individual researcher largely depends on his or her
early collaborators, number of collaborators, and the
impact and recent research activity of the
collaborators.
Table 4: Predicted Emerging Authors (high to low).
Predicted Emerging Authors
Initials Affiliation Current
h-index
# pubs
2012-2015
Current # Citations
(2015)
Institution Type CS Rank
P. F.
University Top-15 23 13 7803
R. D.
University Top-5 10 22 273
V. W
University Top-5 14 15 741
I. R.
University Top-5 16 12 1296
J. Z.
University Top-120 31 30 8911
M.W.
University Top-15 25 24 3785
Social Network Analysis for Predicting Emerging Researchers
33
After we completed our experiments with our
test and training data set, our classifier was used to
make the prediction of producing research impacts
in the coming years of a set of 8,849 researchers
who had an h-index of less than or equal to two in
2011. Finally, when we examined the results, we
found that after just four years (in 2015), the
predicted emerging researchers became mature in
present time.
While this work provides the basic framework
for finding emerging authors, there is still plenty of
room for improvement. For example, we extract
social features of a node from its immediate
neighbors (1-level deep) only. It would be an
interesting study to see the effect of extracting
features from nodes at distance two or more, making
more use of an author’s academic social network.
Moreover, other than the degree centrality, we do
not use any centrality measurement of a node (such
as betweenness, eigenvalue centrality, etc.) in the
coauthorship graph. Finally, we would like to see the
results of our algorithm on a more recent data-set.
ACKNOWLEDGEMENTS
This research is partially supported by the NSF grant
number 0958123 - Collaborative Research:
CIADDO-EN: Semantic CiteSeerX.
REFERENCES
Adali, S., Lu, X., Ismail, M., and Purnell, J., 2011.
Prominence Ranking in Graphs with Community
Structure, ICWSM.
Acuna, D., Allesina, S., Kording, K., 2012. Future impact:
Predicting scientific success. Nature. 489, 201–202.
Ball, P., 2005. Index Aims for Fair Ranking of Scientists.
Nature, 436 (7053), pp. 900.
Batista, P., Campiteli, M., Kinouchi, O., and Martinez, A.,
2005. Is it Possible to Compare Researchers with
Different Scientific Interests? ArXiv:physics/0509048,
accessible via http://arxiv.org/abs/physics/0509048.
Billah, S., M., 2013. Identifying Emerging Researchers
using Social Network Analysis. University of
Arkansas, 1549393.
Bornmann, L., Daniel, H. D., 2005. Does the H-index for
Ranking of Scientists Really Work? Scientometrics, 65
(3), pp. 391-392.
Brin, S., Page, L., 1998. The Anatomy of a Large-scale
Hypertextual Web Search Engine. Proceedings of the
7th International World Wide web Conference.
Castro, R., and Grossman, J., 1999. Famous trails to Paul
Erdös. MATHINT: The Mathematical Intelligencer.
21, pp. 51–63.
Christakis, N., Fowler, J., 2007. The Spread of Obesity in
a Large Social Network Over 32 Years. N. Engl. J.
Med., 357, pp. 370–379.
Fan, R., Chang, K., Hsieh, C., Wang, X., and Lin, C.,
2008. LIBLINEAR: A Library for Large Linear
Classification. Journal of Machine Learning Research
9, 1871-1874.
Farkas, I., Derenyi, I., Jeong, H., Neda, Z., Oltvai, Ravasz,
Z., Schubert, E., Barabasi, A., and Vicsek, T., 2002.
Networks in life: Scaling Properties and Eigenvalue
Spectra. Physica A, 314 (1-4), pp. 25-34.
Garfield, E., 1979. Citation Indexing-Its Theory and
Application in Science, Technology, and Humanities,
John Wiley and Sons, New York, NY.
Giles, C., Bollacker, K., and Lawrence, S., 1998.
CiteSeer
x
: An Automatic Citation Indexing System.
Proceedings of the 3
rd
ACM conference on Digital
libraries, New York, NY, pp. 89–98.
Google Scholar, 2015. [Online] Available from:
https://scholar.google.com/. [Accessed: 20 June 2015].
Guns, R., Rousseau, R., 2009. Simulating Growth of the
H-index. JASIST. 60 (2), pp. 410-417.
He, S., and Spink, A., 2002. A comparison of Foreign
Authorship Distribution in JASIST and the Journal of
Documentation, Journal of the American Society for
Information Science and Technology. 53 (11), pp.
953–959.
Hirsch, J., 2005. An Index to Quantify an Individual’s
Scientific Research Output. PNAS. 102 (46), 16569–
16572.
Irfan, M., Ortiz, L., 2013. On Influence, Stable Behavior,
and the Most Influential Individuals in Networks: A
Game-Theoretic Approach. CoRR, accessible via
http://arxiv.org/abs/1303.2147.
Kleinberg, J., 1999. Authoritative Sources in a Hyper-
linked Environment. Journal of ACM (JASM), 46 (5),
1999, pp. 604-632.
Lawrence, P., 2007. The Mismeasurement of Science.
Current Biology. 17 (15), R583.
Lindsey, D., 1989. Using Citation Counts as a Measure of
Quality in Science Measuring What’s Measurable
Rather Than What’s Valid. Scientometrics. 15(3), pp.
189–203.
Liu, X., Bollen, J., Nelson, M., and Sompel, H., 2005. Co-
Authorship Networks in the Digital Library Research
Community, Information Processing and
Management, 41 (6), pp. 1462-1480.
Microsoft Academic Search, 2013. [Online] Available
from: http://academic.research.microsoft.com/.
[Accessed: 21 July, 2013].
Moravcsik M., and Murugesan, P., 1975. Some Results on
the Function and Quality of Citations, Social Studies
of Science, 5 (1), pp. 86.
Nascimento, M., Sander, J., and Pound, J., 2003. Analysis
of SIGMOD’s Co-authorship Graph. SIGMOD, 32 (3).
Neo4j, 2013. The World's Leading Graph Database.
[Online] Available from: http://neo4j.com. [Accessed:
21 July, 2013].
Newman, M., 2001, Scientific Collaboration Networks: I.
Network Construction and Fundamental Results,
Physical Review E. 64:016131.
KDIR 2015 - 7th International Conference on Knowledge Discovery and Information Retrieval
34
Newman, M., 2001. Scientific Collaboration Networks: II.
Shortest Paths, Weighted Networks, and Centrality.
Physical Review E., 64:016132.
Otte, E., and Rousseau, R., 2002. Social Network
Analysis: a Powerful Strategy, also for the Information
Sciences. Journal of Information Science. 28 (6), pp.
441–453.
Popov, S., 2005. A Parameter to Quantify Dynamics of a
Researcher’s Scientific Activity, ArXiv:physics/
0508113, accessible via http://arxiv.org/abs/physics/
0508113.
Scott, J., 2000. Social Network Analysis: A Handbook, 2nd
ed., Sage Publications, London.
Smeaton, A., Keogh, G., Gurrin, C., McDonald, K., and
Sodring, T., 2002. Analysis of Papers from Twenty-
Five Years of SIGIR conferences: What have we been
Doing for the Last Quarter of a Century. SIGIR,36 (2).
U.S. News and World Report, 2015. Best Computer
Science Program. [Online] Available from: http://grad-
schools.usnews.rankingsandreviews.com/best-
graduate-schools/top-science-schools/computer-
science-rankings. [Accessed: 19th May 2015].
Wasserman, S., and Faust, K., 1994, Social Network
Analysis: Methods and Applications, Cambridge
University Press.
Watts, D., 2001. Small Worlds: The Dynamics of Networks
between Order and Randomness, Princeton University
Press.
Social Network Analysis for Predicting Emerging Researchers
35
