An Evolutionary and Graph-Rewriting based Approach to Graph
Generation
Aaron Barry, Josephine Griffith and Colm O’Riordan
Computational Intelligence Research Group, NUI, Galway, Ireland
Keywords:
Graph Rewriting, Evolutionary Computation, Graph Generation.
Abstract:
This paper describes an evolutionary computation based graph rewriting approach to generating classes of
graphs that exhibit a set of desired global features. A set of rules are used to generate, in a constructive
manner, classes of graphs. Each rule represents a transformation from one graph to another. Each of these
transformations causes local changes in the graph. Probabilities can be assigned to the rules which govern the
frequency with which they will be applied. By assigning these probabilities correctly, one can generate graphs
exhibiting desirable global features. However, choosing the correct probability distribution to generate the
desired graphs is not an easy task for certain graphs and the task of finding the correct settings for these graphs
may represent a difficult search space for the evolutionary algorithms. In order to generate graphs exhibiting
desirable features, an evolutionary algorithm is used to find the suitable probabilities to assign to the rules.
The fitness function rewards graphs that exhibit the desired properties. We show, using a small rule base, how
a range of graphs can be generated.
1 INTRODUCTION
Graphs are used in a large range of domains in com-
puter science and mathematics and in a range of ap-
plications of these fields. Many problems can be
elegantly and intuitively modelled or abstracted as
graph problems. Popular classes of graph problems
include path finding (Pohl, 1970), graph colouring
(Wood, 1969) and graph partitioning (Kernighan and
Lin, 1970).
Many problem domains such as simulation in spa-
tial game theory or modelling the spread of informa-
tion in a population involve the need to create classes
of graphs that exhibit specific features. Often the
question of interest relates to exploring the potential
impact of certain features in a graph. In these scenar-
ios, analysis can be facilitated by generating graphs
that exhibit those features.
One approach that has been used to create these
classes of graphs is to sample data from the real prob-
lem domain and build graphs from these samples.
There have been many attempts to undertake such
a task in a range of domains; for example
´
Alvarez-
Garc
´
ıa build multi-partite graphs from given data
(
´
Alvarez-Garc
´
ıa et al., 2014). Oftentimes, such data
is prohibitively expensive or impossible to obtain. In
such domains, global features of these graphs can be
observed and measured and one can then build graphs
exhibiting these features.
Many approaches have been used to generate ar-
tificial graphs that exhibit various features. There
have been a range of approaches to generating ran-
dom graphs including Erd
˝
os-R
´
enyi graphs (Erd
˝
os and
R
´
enyi, 1961), (Gilbert, 1959) and random geometric
graphs (Penrose, 2003) and a number of techniques
to generate graphs that exhibit the scale free property
(Barab
´
asi and Albert, 1999), small world properties
(Newman, 2000) and other properties such as a de-
sired clustering coefficient (Li and O’Riordan, 2013)
and community structure (Seshadhri et al., 2012).
These approaches generate a class of graphs that ex-
hibit a set of features.
A graph rewriting system represents a more gen-
eral approach to generating graphs. Graph rewrit-
ing systems involve transforming a graph by apply-
ing rewrite rules; a component of the original graph is
replaced with a new component. Many existing tech-
niques such as preferential attachment (Barab
´
asi and
Albert, 1999), the Chung-Lu model (Chung and Lu,
2002) forest fire model (Leskovec et al., 2005b) can
be viewed as graph-rewriting system where an origi-
nal graph is transformed by the application of a num-
ber of transformations. The type of graphs generated
depends on both the set of rules to be applied and
Barry, A., Griffith, J. and O’Riordan, C..
An Evolutionary and Graph-Rewriting based Approach to Graph Generation.
In Proceedings of the 7th International Joint Conference on Computational Intelligence (IJCCI 2015) - Volume 1: ECTA, pages 237-243
ISBN: 978-989-758-157-1
Copyright
c
2015 by SCITEPRESS – Science and Technology Publications, Lda. All rights reserved
237

the frequency with which they are applied. Other ap-
proaches that have been adopted include generating
graphs using evolutionary computation and then ap-
plying noise to the graphs (Bach et al., 2013), using
multiplication of Kronecker matrics (Leskovec et al.,
2005a), (Leskovec et al., 2010).
The contributions of this work are two-fold: first,
we introduce an approach that combines evolutionary
computation and re-writing rules to generate graphs
that exhibit desired global features and second, we il-
lustrate the approach by generating classes of graphs
that display desired global features (in our case, a de-
sired clustering coefficient and a fixed set of nodes),
using a small set of rewriting rules.
The paper is laid out as follows. Some prelim-
inary concepts are introduced and then we discuss
the proposed model. We then discuss some simple
rules and demonstrate the ability of the evolution-
ary algorithm to generate a class of graphs exhibit-
ing pre-defined properties. We compare the approach
with existing graph generation techniques. Finally,
we present some conclusions and suggest future di-
rections for the research.
2 BACKGROUND CONCEPTS
A graph, G, comprises a set, V, of nodes (or vertices)
and a set E of edges such that each edge e in E com-
prises an unique pair (v
i
, v
j
) of nodes in V . A graph
rewriting system comprises a set of rules of the form
α → β which transform a graph G to a new graph G
0
.
In these rules, α represents an existing construct in
the graph (α ∈ G(V, E)) and β represents a new con-
struct which replaces α. Typically, the construct β is
bigger than the construct α and results in the graph
growing in terms of the number of vertices, number
of edges, or both. The re-write rules to be applied can
be selected based on probabilities assigned to them.
Many previous graph creation approaches have
led to the creation of graphs with specific features
(low average degree, small world property, commu-
nity structure etc.). Depending on the domain, dif-
ferent properties may be of interest. These include,
among others, the following features:
• Degree Distribution: the degree distribution of a
graph is the fraction of nodes in the network with
a given degree.
• Diameter: the diameter of a graph is the length of
the longest path between any pairs of nodes.
• Clustering Coefficient: the clustering coefficient
of a graph is a measure of how closely clustered
together vertices on the graph are. The local clus-
tering coefficient of a node is defined as the num-
ber of edges between a node’s neighbours divided
by the possible number of edges between a node’s
neighbours. The global clustering coefficient is
the average of the local clustering coefficient over
all nodes.
• Centrality Measures: centrality measures are used
to quantify how central or important a given
node is. There are many measures of centrality
that have been proposed in the literature includ-
ing degree centrality (the higher the degree of a
node, the higher this measure), closeness central-
ity (measures how close the node is to other nodes
in the graph) and betweenness centrality (mea-
sures how often a node is a member of the shortest
path between two pairs of nodes).
3 GRAPH CREATION MODEL
The approach contains two distinct components—
first, a graph generation component which repeatedly
applies a number of transformation rules to create a
new graph from an original graph (outlined in Al-
gorithm 1), and second, an evolutionary component
which, for a set of specified desired features, learns
the best probabilities to assign to the rules (outlined
in Algorithm 2).
The graph generation model comprises the fol-
lowing components: an initial state which comprises
an initial graph G
0
(V
0
, E
0
), a set of re-write rules
{R}, which can transform a graph G to a new graph
G
0
, a probability distribution {P
i
} over these rules
and the number of times (NumSteps), to select and
apply a rule.
Algorithm 1: Generate.
Graph Generation Algorithm(G
0
(V
0
, E
0
), {R}, {P
i
}, NumSteps)
G ← G
0
for i ← 1 to NumSteps
Choose R
i
with probability P
i
Apply R
i
to G to create G
0
G ← G
0
return(G)
The evolutionary component uses a genetic algo-
rithm over a population of size m where the chromo-
somes are of length n + 1 when there are n rules; the
final n + 1
st
gene, Num Steps, is used to determine
how many rules are to be applied.
Genecode =< P
R
1
, P
R
2
, . . . P
R
n−1
, P
R
n
, NumSteps >
ECTA 2015 - 7th International Conference on Evolutionary Computation Theory and Applications
238

A set of predefined features are used to guide the
search; the overall fitness function is defined by how
close the graph is to having these features. If a user
specifies k features, the following fitness function is
used:
Fitness =
∑
k
i=1
ω
i
× closeness
i
(G, f
i
)
∑
k
i=1
ω
i
The set of closeness
i
functions measure how well
the graph G exhibits each feature f
i
. The ω
i
values
allow the user to give higher priority to some features
over others. The overall fitness is effectively a linear
combination of a number of closeness measures.
Algorithm 2: Evolution Algorithm.
Evolution Algorithm(Gen, G
0
, PopSize, Samplesize)
Create a population of chromosomes, {C
i
}, each of
length m
G ← G
0
for g ← 1 to Gen
for p ← 1 to PopSize
for s ← 1 to Samplesize
NumSteps ← C
i
[m]
G
ps
← Generate(G
0
, {R},C
i
[0. . . m −
1], NumSteps)
for i ← 1 to NumberFeatures
Measure presence of feature f
i
in G
ps
Calculate overall fitness of G
ps
Calculate average fitness over graphs from the
sample
Tournament Selection
Mutation
Crossover
Due to the stochasticity in the graph generation al-
gorithm, samples of graphs are created to evaluate
each chromosome; the features are measured for each
graph in the sample and the fitness assigned to the
chromosome is calculated as the average of these fit-
ness values. Tournament selection is adopted to select
chromosomes for the next generations; these selected
chromosomes are then subjected to potential mutation
and crossover.
Mutation has two aspects. If the gene to be mu-
tated represents the NumSteps, creep mutation is used
to increase or decrease this value by an amount cho-
sen randomly from a pre-defined range. If the gene
chosen represents a probability associated with a spe-
cific rule, then that probability is modified using creep
mutation. To ensure correctness, the change and its
magnitude is reflected across the other probabilities
equally to ensure the resulting probabilities sum to
unity. Crossover is one-point and similar considera-
tion is given to ensuring correctness.
4 SAMPLE GRAPH
GENERATION USING
RE-WRITING RULES
4.1 Sample Rule Set
In this illustrative example, we include three rather
simple rules. The semantics of these rules are for-
malised in Tables 1 to 3. The rules are used to trans-
form an existing graph into a new graph. The first rule
adds a new vertex and a new edge; the new vertex is
connected together to an existing vertex. This exist-
ing vertex is chosen randomly. This can be viewed as
a rewriting rule where a vertex is replaced by a vertex
connected to a new vertex.
The second rule attempts to add an edge between
two existing vertices in the graph where one does not
already exist. This has the effect of increasing the
density of the graph. The vertices to connect together
are chosen randomly. If no such pair of vertices exist
(i.e. on a complete graph), the rule is not applied.
The third and final rule included was one that re-
places an existing vertex with a ‘triangle’, i.e two new
vertices are added to the graph; these vertices are both
connected to an existing vertex; finally an edge is
added to these two vertices. This rule can be seen
as a re-writing rule that changes an existing node to
a ‘triangle’ of nodes. This new ‘triangle’ will contain
some vertices with a high local clustering coefficient.
Each of these rules transforms a graph G(V, E) to
another graph G
0
(V
0
, E
0
). For all our rules V
0
⊇ V and
E
0
⊇ E and so the graph grows monotonically.
Table 1: Conditions for Rule 1.
Name Add a vertex
Pre-condition v
i
∈ V, v
j
6∈ V
Post-condition v
i
∈ V
0
, v
j
∈ V
0
, e(v
i
, v
j
) ∈ E
0
Table 2: Conditions for Rule 2.
Name Add an edge
Pre-condition v
i
∈ V, v
j
∈ V, e(v
i
, v
j
) 6∈ E
Post-condition v
i
∈ V
0
, v
j
∈ V
0
, e(v
i
, v
j
) ∈ E
0
Table 3: Conditions for Rule 3.
Name Add a triangle
Pre-condition v
i
∈ V, v
j
, v
k
6∈ V
Post-condition 1 v
i
, v
j
, v
k
∈ V
0
Post-condition 2 e(v
i
, v
j
), e(v
j
, v
k
), e(v
i
, v
k
) ∈ E
0
An Evolutionary and Graph-Rewriting based Approach to Graph Generation
239
4.2 Illustration of Graph Generation
By assigning probabilities to the rules and specifying
the number of times to apply the rules, we can gen-
erate a large set of graphs. Depending on the prob-
abilities assigned, the graphs generated may exhibit
different global properties. We now show two such
examples.
For the first example, we assigned the probabili-
ties 0.1, 0.8 and 0.1 to the first, second and third rules
respectively. We apply the rules 100 times starting
with a simple original graph of two vertices connected
with an edge. Given the high probability associated
with the second rule, we expect to generate graphs
with a high number of edges and a high density. The
graph shown in Fig. 1 has been generated with this
probability distribution over the rules. As expected,
the graph displays a high density. The graph has 28
vertices, 117 edges, an average degree of 8.357, and a
clustering coefficient of 0.56.
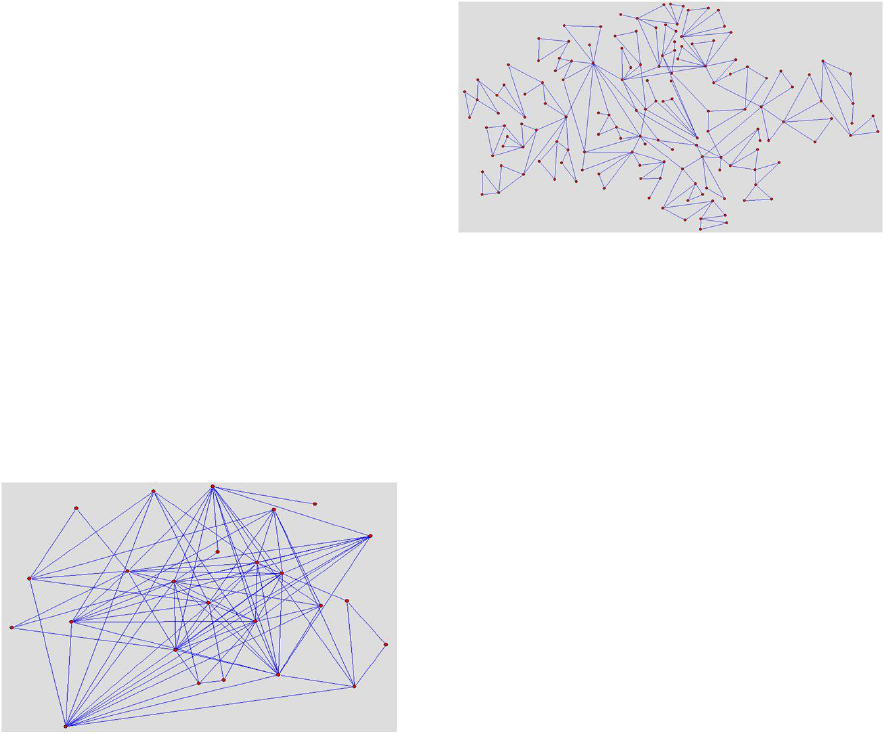
Figure 1: An illustrative graph generated with probabilities
0.1, 0.8, 0.1.
The second example involves generating a graph
using a different probability distribution. The graph
in Fig. 2 shows a graph generated with the same three
simple rules and probabilities 0.1, 0.1 and 0.8 respec-
tively. In this case, the graph should have more ‘tri-
angles’ and hence more nodes and a higher clustering
coefficient. The resulting graph has 158 vertices, 235
edges, an average degree of 2.97 and a clustering co-
efficient of 0.698.
These examples illustrate the graph generation ap-
proach using a set of simple graph rewriting rules.
By choosing, different distributions we can generate
classes of graphs that exhibit substantially different
global phenomena. It is worth noting, that due to the
stochastic nature of the process, we can generate a
large set of graphs with the same probability distribu-
tion over the rule set which will exhibit similar global
phenomena.
Figure 2: An illustrative graph generated with probabilities
0.1, 0.1, 0.8.
5 SAMPLE EVOLUTION AND
GRAPH GENERATION
5.1 Evolutionary Settings
In the evolutionary setting, the desirable global fea-
tures must be specified. In order to facilitate search,
some mechanism is needed to measure their presence
in the graph in order to define the closeness func-
tions needed in the fitness function. The genetic algo-
rithm, outlined in Algorithm 2, evolves a population
of weightings and converges towards settings that al-
low the generation of graphs with the desired features.
To illustrate its performance, we adopt a small set
of features as the desirable global features: namely
the number of vertices and the clustering coefficient.
The genetic algorithm parameters are as follows:
population size 100, number of generations 30, mu-
tation 1%, no crossover, tournament size 10. For the
fitness function, we give equal credence to both the
desirable functions, i.e., ω
i
= 1, ∀ω
i
.
We illustrate the evolutionary process with three
different settings for the features representing three
fitness landscapes for the evolutionary process to
search:
1. No. of vertices = 100; Clustering coefficient = 0.0
2. No. of vertices = 100; Clustering coefficient = 0.4
3. No. of vertices = 100; Clustering coefficient = 0.7
5.2 Illustration of Graph Evolution
For the first fitness function, with minimal clustering
of nodes, the evolutionary algorithm quickly evolves
to finding such a graph with the ideal number of nodes
and ideal clustering coefficient according to the fit-
ness function. The chromosome selected by the evo-
lutionary algorithm is as follows: < 100, 0, 0, 100 >,
indicating that the second and third rule were never
ECTA 2015 - 7th International Conference on Evolutionary Computation Theory and Applications
240
applied and rule 1 (adding a new vertex to an exist-
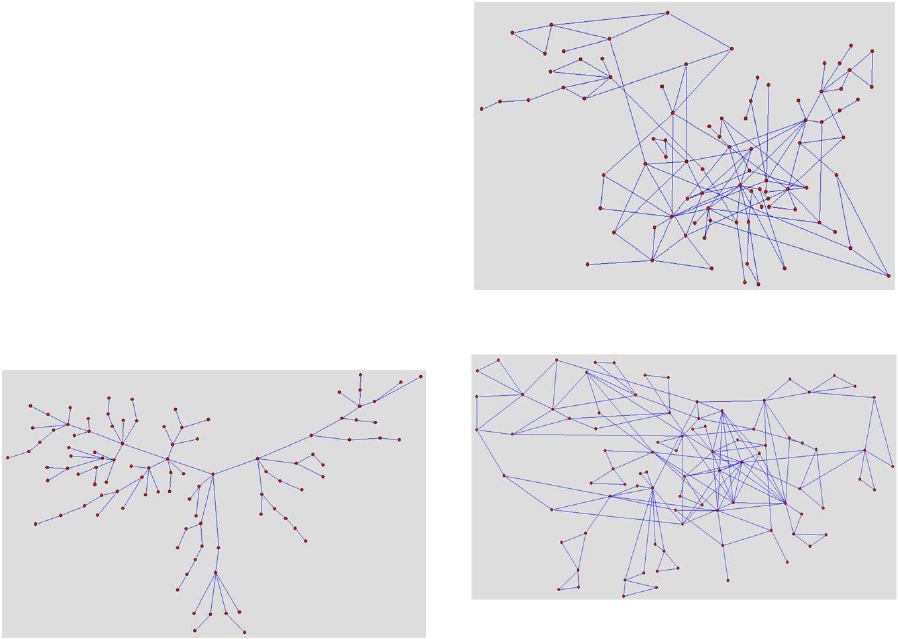
ing vertex) is applied 100 times. Figure 3 illustrates a
graph generated using these evolved values.
We see a tree like structure emerge. It is worth
noting, that other graphs can be formed that are not
strictly trees but that can have a low or zero level of
clustering. However, given the set of rules, it would
seem that the less one applies the rule involving add
‘triangles’, the lower the clustering coefficient. Simi-
larly, in applying the second rule involving adding an
edge, there is a probability of forming triangles in the
graph which would increase the clustering coefficient.
The best rule to apply in creating a graph with mini-
mal clustering coefficient is the rule that adds a node
connected to an existing node.
Figure 3: Desired features: number of nodes 100, clustering
coefficient= 0.0.
For the second fitness function, the genetic algo-
rithm quickly finds a chromosome with a set of val-
ues that captures the balance between applying the
three rules and the correct number of time steps. A
chromosome found by the genetic algorithm is as fol-
lows: < 44, 25, 21, 86 >. Figure 4 illustrates a graph
generated with these rules. The illustrated graph has
just less than 100 nodes and clustering coefficient of
0.403.
For the third and final fitness function, a much
higher clustering coefficient is required. This takes
longer to find and a greater variance is witnessed in
applying the evolved rules. An illustrative chromo-
some found was as follows: < 1, 61, 38, 83 > which
was used to generate the graph in Figure 5.
In summary, these examples show that we can
search the space of possible probability values to as-
sign to the rules and find suitable settings in order to
generate graphs exhibiting the desirable global fea-
tures. It is worth noting that for any evolutionary run,
we may find a number of settings that generate suit-
able graphs (this will depend on the landscape and
whether it is unimodal or not), and for each setting,
we can generate a family of graphs.
Figure 4: Desired feature - number of nodes 100, clustering
coefficient= 0.4.
Figure 5: Desired feature - number of nodes 100, clustering
coefficient= 0.7.
5.3 Evolutionary Algorithm
For each of the problem cases, we run the algorithm
twenty times. In all cases, the evolutionary algo-
rithm finds suitable graphs in each run with little vari-
ation in the number of generations taken per individ-
ual cases. For the intermediate case with a cluster-
ing coefficient of 0.4, the genetic algorithm converged
to good graphs quickly; the genetic algorithm found
very good solutions (fitness value less than 0.005)
within a small number of generations (5-7). This is
not surprising given that there are many graphs with
such a value for the clustering coefficient.
For the problem where graphs with a clustering
coefficient of 0.7 of required; the genetic algorithm
never reached solutions with as low fitness function
values as for the previous case. Runs typically con-
verged in 10 to 15 generations to a reasonably good
set of rules to generate graphs with the desirable fea-
tures. The stochastic nature of the problem domain
meant that fitness values of between 0.05 and 0.1 were
found and maintained through the evolutionary run.
For the third case involving attempting to evolve a
graph with a clustering coefficient of zero had a sim-
ilar trajectory to the previous case with convergence
An Evolutionary and Graph-Rewriting based Approach to Graph Generation
241
happening in the first 10-15 generations and a fitness
value of between 0.05 and 0.1 achieved.
6 DISCUSSION
Bach et al. (Bach et al., 2013) discuss an approach
to generating graphs with evolutionary algorithms.
Their approach involves using motif generators which
create specified topological patterns and a module that
introduces noise to the graph. Of the works encoun-
tered, this work is most similar to ours in that an
evolutionary algorithm is used to guide the search.
There are also parallels in that a level of abstraction is
adopted in both approaches; we adopt rules to trans-
form graphs whereas in the work of Bach et. al. mo-
tifs are used as building blocks. The work differs from
ours in that they extend the basic approach to allow
user feedback also guide the evolution.
Another well-known evolutionary approach to
generate graphs has been described by Stanley and
Miikkulainen and others (e.g. (Stanley and Miikku-
lainen, 2002), (Stanley et al., 2003)) where evolution-
ary approaches are used to evolve neural networks.
The focus in this work is less on producing graphs or
networks with specific topological features, but rather
on the resulting neural network’s ability to learn a par-
ticular task.
Many existing graph generator models can pro-
duce graphs that guarantee specific statistical proper-
ties (diameter, average degree). As argued by Shuail
et. al (Shuai et al., 2013), it can be difficult to main-
tain other properties. They report on their work which
allows the generation of very large graphs that pre-
serve other patterns that may be important given the
semantics of a particular domain. Our approach can
capture succinctly the requirements of a particular do-
main by incorporating specific rules to produce de-
sired local properties; the required local and global
properties can be ensured via the genetic algorithm.
The application problem tackled in this paper of
generating graphs with a predefined clustering coeffi-
cient is one that been addressed by other researchers;
for example, Herrera et al (Herrera and Zufiria, 2011),
(Heath and Parikh, 2011) and Holme et al (Holme and
Kim, 2002) present techniques to generate different
types of graphs with a tunable clustering coefficient.
Graphs with different levels of clustering have been
explored in the domain of evolutionary game theory
in order to explore the effect of clustering on the emer-
gence of cooperation (Gang et al., 2008), (O’Riordan
et al., 2008); in order to pursue research in a similar
vein it is important to be able to generate graphs with
particular features.
We have shown with a small example rule set and
a small set of features how this approach can be used
to generate classes of graphs exhibiting these features.
For simulation domains, one often wishes to generate
a large potentially diverse set of graphs that exhibit
similar global features. Adopting an evolutionary ap-
proach, a set of chromosomes with similar fitness can
be evolved. Each chromosome can be used to gen-
erate a set of graphs that will include some level of
variation. This is a useful benefit of the approach.
Another benefit is the level of abstraction af-
forded. Given the ability to specify the desirable
graph features and some means to measure these fea-
tures, the approach can be applied. Furthermore,
if domain knowledge is available about useful local
properties, we can augment our set of rules accord-
ingly.
One caveat worth noting is that genetic algorithms
are a suitable approach where a non-binary measure
can be assigned to the solution. This is true for many
features of graphs of interest in social science and so-
cial simulation. For example, for the features con-
sidered in this paper (clustering coefficient, degree),
we can calculate how close the graph is to exhibiting
these features. For other graph features, defining such
a measure may be computationally expensive or even
intractable.
On a related note, the specified desirable proper-
ties may conflict with each other in some way; for ex-
ample adding an edge will increase the average degree
but it might also have another effect (introducing a
cycle, increasing the clustering coefficient etc.). Sim-
ilarly, one or more rules may partially cover another
rule. In these cases, an alternative type of fitness func-
tion may be reasonable. Adopting a multi-objective
fitness function and returning a range of graphs may
be suitable.
7 CONCLUSIONS AND FUTURE
WORK
We have shown that graph rewriting rules can be used
in conjunction with genetic algorithms to generate
classes of graphs that exhibit specified global features.
While the approach discussed and presented in this
paper has been successful in generating graphs exh-
biting certain properties, further work is needed to test
the approach on more complex graph generation. In
order to further motivate and justify this approach, it
is necessary to illustrate its ability on a wider range of
graphs types and properties.
Proposed future work includes applying the ap-
proach to a wider range of graph properties to further
ECTA 2015 - 7th International Conference on Evolutionary Computation Theory and Applications
242
explore the applicability of this approach. We aim to
show that graphs generated by other approaches can
be generated adopting this approach. It would also
be interesting to discover if there are graph genera-
tion approaches that we cannot replicate with this ap-
proach.
Another strand of future work is to explore an ex-
tended set of rules that includes rules of a different
type. Currently all our rules are like those in a regular
grammar; the right hand side of the rules are merely
graph constructs. One could include non-terminals in
the right hand side which would in turn trigger an-
other rule.
REFERENCES
´
Alvarez-Garc
´
ıa, S., Baeza-Yates, R., Brisaboa, N. R.,
Larriba-Pey, J.-L., and Pedreira, O. (2014). Auto-
matic multi-partite graph generation from arbitrary
data. Journal of Systems and Software, 94:72–86.
Bach, B., Spritzer, A., Lutton, E., and Fekete, J.-D. (2013).
Interactive random graph generation with evolution-
ary algorithms. In Graph Drawing, pages 541–552.
Springer.
Barab
´
asi, A.-L. and Albert, R. (1999). Emergence of scal-
ing in random networks. science, 286(5439):509–512.
Chung, F. and Lu, L. (2002). The average distances in ran-
dom graphs with given expected degrees. Proceedings
of the National Academy of Sciences, 99(25):15879–
15882.
Erd
˝
os, P. and R
´
enyi, A. (1961). On the evolution of random
graphs. Bull. Inst. Internat. Statist, 38(4):343–347.
Gang, W., Kun, G., Han-Xin, Y., and Bing-Hong, W.
(2008). Role of clustering coefficient on cooperation
dynamics in homogeneous networks. Chinese Physics
Letters, 25(6):2307.
Gilbert, E. N. (1959). Random graphs. The Annals of Math-
ematical Statistics, pages 1141–1144.
Heath, L. S. and Parikh, N. (2011). Generating random
graphs with tunable clustering coefficients. Phys-
ica A: Statistical Mechanics and its Applications,
390(23):4577–4587.
Herrera, C. and Zufiria, P. J. (2011). Generating scale-
free networks with adjustable clustering coefficient
via random walks. arXiv preprint arXiv:1105.3347.
Holme, P. and Kim, B. J. (2002). Growing scale-free net-
works with tunable clustering. Physical review E,
65(2):026107.
Kernighan, B. W. and Lin, S. (1970). An efficient heuristic
procedure for partitioning graphs. Bell system techni-
cal journal, 49(2):291–307.
Leskovec, J., Chakrabarti, D., Kleinberg, J., and Faloutsos,
C. (2005a). Realistic, mathematically tractable graph
generation and evolution, using kronecker multiplica-
tion. In Knowledge Discovery in Databases: PKDD
2005, pages 133–145. Springer.
Leskovec, J., Chakrabarti, D., Kleinberg, J., Faloutsos, C.,
and Ghahramani, Z. (2010). Kronecker graphs: An
approach to modeling networks. The Journal of Ma-
chine Learning Research, 11:985–1042.
Leskovec, J., Kleinberg, J., and Faloutsos, C. (2005b).
Graphs over time: densification laws, shrinking diam-
eters and possible explanations. In Proceedings of the
eleventh ACM SIGKDD international conference on
Knowledge discovery in data mining, pages 177–187.
ACM.
Li, M. and O’Riordan, C. (2013). The effect of clustering
coefficient and node degree on the robustness of co-
operation. In Evolutionary Computation (CEC), 2013
IEEE Congress on, pages 2833–2839. IEEE.
Newman, M. E. (2000). Models of the small world. Journal
of Statistical Physics, 101(3-4):819–841.
O’Riordan, C., Cunningham, A., and Sorensen, H. (2008).
Emergence of cooperation in n-player games on small
world networks. In ALIFE, pages 436–442.
Penrose, M. (2003). Random geometric graphs, volume 5.
Oxford University Press Oxford.
Pohl, I. (1970). Heuristic search viewed as path finding in a
graph. Artificial Intelligence, 1(3):193–204.
Seshadhri, C., Kolda, T. G., and Pinar, A. (2012). Commu-
nity structure and scale-free collections of erd
˝
os-r
´
enyi
graphs. Physical Review E, 85(5):056109.
Shuai, H.-H., Yang, D.-N., Yu, P. S., Shen, C.-Y., and Chen,
M.-S. (2013). On pattern preserving graph genera-
tion. In Data Mining (ICDM), 2013 IEEE 13th Inter-
national Conference on, pages 677–686. IEEE.
Stanley, K. O., Bryant, B. D., and Miikkulainen, R. (2003).
Evolving adaptive neural networks with and with-
out adaptive synapses. In Evolutionary Computa-
tion, 2003. CEC’03. The 2003 Congress on, volume 4,
pages 2557–2564. IEEE.
Stanley, K. O. and Miikkulainen, R. (2002). Evolving neu-
ral networks through augmenting topologies. Evolu-
tionary computation, 10(2):99–127.
Wood, D. (1969). A technique for colouring a graph appli-
cable to large scale timetabling problems. The Com-
puter Journal, 12(4):317–319.
An Evolutionary and Graph-Rewriting based Approach to Graph Generation
243
