Data Driven Structural Similarity
A Distance Measure for Adaptive Linear Approximations of Time Series
Victor Ionescu, Rodica Potolea and Mihaela Dinsoreanu
Computer Science Department, Technical University of Cluj-Napoca,
26-28 G.Baritiu Street, 400027, Cluj-Napoca, Romania
Keywords: Time Series, Similarity Search, Structural Similarity, Linear Approximation, Data Adaptive.
Abstract: Much effort has been invested in recent years in the problem of detecting similarity in time series. Most
work focuses on the identification of exact matches through point-by-point comparisons, although in many
real-world problems recurring patterns match each other only approximately. We introduce a new approach
for identifying patterns in time series, which evaluates the similarity by comparing the overall structure of
candidate sequences instead of focusing on the local shapes of the sequence and propose a new distance
measure ABC (Area Between Curves) that is used to achieve this goal. The approach is based on a data-
driven linear approximation method that is intuitive, offers a high compression ratio and adapts to the
overall shape of the sequence. The similarity of candidate sequences is quantified by means of the novel
distance measure, applied directly to the linear approximation of the time series. Our evaluations performed
on multiple data sets show that our proposed technique outperforms similarity search approaches based on
the commonly referenced Euclidean Distance in the majority of cases. The most significant improvements
are obtained when applying our method to domains and data sets where matching sequences are indeed
primarily determined based on the similarity of their higher-level structures.
1 INTRODUCTION
Due to its applicability in a wide range of real-world
problems from various domains, there has been an
increased interest in mining time series data over the
last two decades. Ever since the seminal paper
(Agrawal, et al., 1993), many contributions have
been brought to the body of knowledge, aiming to
solve problems such as identification of recurring
patterns, anomaly detection and querying for similar
sequences. (Fu, 2011) (Lin, et al., 2012)
When tackling the problem of similarity search
in time series, a large portion of the proposed
approaches operate under the assumption that
matching sequences will be identical. Such
approaches will commonly use similarity measures
that evaluate the local(or point-by-point) differences
among candidate sequences, and accumulate them in
order to obtain the global picture of whether the
sequences are a match or not.
While such approaches work well in ideal
situations in which matches are indeed exact, for
many real-world scenarios this is not the case, and
approximate similarity search techniques are
necessary (Shatkay and Zdonik, 1996). In fact, it has
been shown (Lin, et al., 2012) that similarity search
through point-by-point comparison produces poor
results when applied to longer time series having
imperfect matches. This is mostly due to local
divergences between the candidate sequences, e.g.
temporary shifting or scaling on any axis (time or
amplitude), that cannot be corrected through a global
pre-processing step and which cause the similarity
search to produce erroneous results. As a
consequence, these challenges would need to be
tackled by the search algorithm whenever an
approximate similarity search in longer time series is
performed.
Despite these issues, there has been considerably
less work targeted at identifying “structural”
similarity, i.e. similarity on a higher-level, in time
series. Due to this fact, in the current paper we
propose one such approach, based on the use of a
data driven approximate time series representation
format.
We propose a similarity search technique based
on a piecewise linear approximation of data obtained
through data-adaptive segmentation, and a
corresponding similarity measure to be used with
this representation format. We illustrate through
Ionescu, V., Potolea, R. and Dinsoreanu, M..
Data Driven Structural Similarity - A Distance Measure for Adaptive Linear Approximations of Time Series.
In Proceedings of the 7th International Joint Conference on Knowledge Discovery, Knowledge Engineering and Knowledge Management (IC3K 2015) - Volume 1: KDIR, pages 67-74
ISBN: 978-989-758-158-8
Copyright
c
2015 by SCITEPRESS – Science and Technology Publications, Lda. All rights reserved
67
experiments performed on commonly referenced
data sets that, when it comes to the detection of
higher level structural similarity, our approach
outperforms the most common distance measures
that are used to evaluate local similarity in time
series. In addition, we highlight the benefits of using
the data adaptive segmentation, in contrast to a
typical fixed-width piecewise linear approximation.
The rest of the paper is organized as follows. In
section 2 we discuss related work. Our proposed
approach is presented in section 3. The experiments
we have performed are detailed in section 4. Section
5 contains our conclusions and a discussion of future
work.
2 RELATED WORK
Time series are sequences of data points, having a
fixed temporal order, which represent the variation
in time of some quantifiable measure. Time series
can originate from a large spectrum of fields. Due to
their nature, in many fields time series often exhibit
recurring formations, or patterns, making the field of
similarity search interesting to study from a
knowledge discovery perspective.
In order to quantify the similarity of two time
series sequences a multitude of distance measures
have been proposed. Most commonly these are also
used in conjunction with an alternate representation
format for time series: PAA (Keogh, et al., 2001),
APCA (Keogh, et al., 2001), PLA (Pazzani and
Keogh, 1998), SAX/iSAX (Shieh & Keogh, 2008),
which is introduced primarily with the aim of
reducing the dimensionality of time series. An
overview and empirical evaluation of the most
common representation formats and corresponding
distance measures is provided in (Wang, et al.,
2013).
2.1 Approximate Similarity Search
While most existing work has focused on methods
for exact similarity search, in many situations it is
necessary to identify approximate matches between
time series sequences (Shatkay and Zdonik, 1996).
E.g. the Euclidean Distance (Faloutsos, et al., 1994),
which is by far the most commonly referenced
distance measure, operates by calculating the
difference between candidate sequences on a point-
by-point basis. Due to this fact it is also very
sensitive to shifts on the time axis, which can lead to
poor results even in the case of minor local
misalignments: in (Lin, et al., 2012), the use of
Euclidean Distance has been shown to produce poor
results when applied to longer sequences, where
local divergences should be of smaller significance.
One proposed solution for such issues has been
the use of elastic distance measures such as
Dynamic Time Warping (Ratanamahatana & Keogh,
2005). Alternative approaches have also been
proposed, such as (Keogh, 2003), which uses a
probabilistic technique for the discovery of motifs,
in which small subsections of the time series are
allowed to vary between the candidate sequences
(e.g. in order to cancel out temporary noise).
However, when it comes to identification of
similarity in sequences of larger dimensions,
approaches that search for higher level (“structural”)
similarity have been shown to produce promising
results. These have mostly been based on extracting
certain features from the original sequences, and
evaluating the similarity based on this information.
We will highlight such approaches in the following
section.
2.2 Structural Similarity
Inspired by the bag-of-words technique commonly
used in text mining, (Lin, et al., 2012) represents
sequences by a histogram of the shapes occurring
within that sequence (i.e. “bag of patterns”). Once
obtained, the similarity among two candidate
sequences can be determined by applying a distance
measure directly on this bag of patterns.
An approximation of time series by using a set of
predefined parameterizable primitive shapes is
proposed in (Olszewski, 2001). However the
approach does not come with a corresponding
distance measure for evaluation of structural
similarity based on this representation method.
(Fu, et al., 2005) proposes the representation of
time series by means of their perceptually most
important points. The sequences represented using
this compressed format are then indexed with the
aim of obtaining improved retrieval times due to the
reduced dimensionality.
2.3 Linear-Approximation-based
Approaches
While the representation of time series through
piecewise linear approximations (PLA) (Pazzani &
Keogh, 1998) is a well-known approach, in the
context of similarity search we have found that
methods based on other representation methods have
been favoured, despite the fact that PLA-based
approaches are intuitive and easy to compute, while
KDIR 2015 - 7th International Conference on Knowledge Discovery and Information Retrieval
68
at the same time producing competitive results
(Wang, et al., 2013).
In (Chen, et al., 2007) iPLA, an indexable
extension of PLA, is proposed, for which a lower
bound distance can be defined assuring no false
dismissals during the similarity search.
In the same context of linear-approximation-
based techniques, a series of approaches have been
proposed that operate on the derivative (or slope) of
the identified segments:
In (Toshniwal and Joshi, 2005) an approach for
performing similarity search is introduced, based on
the intuition that similar sequences will have similar
variations in their slopes. The approach operates by
accumulating the (weighted) slope difference
between corresponding strips of the candidate
sequences.
(Keogh and Pazzani, 2001) proposes an
extension of the Dynamic Time Warping distance
measure, that takes into account the local derivative
of the time series segments.
In the next section we evaluate an approach to
identifying similarity in time series by means of a
distance measure that focuses on structural similarity
by employing a linear-approximation-based repre-
sentation of data.
3 DATA DRIVEN STRUCTURAL
SIMILARITY SEARCH
We argue that the use of linear-approximation-based
search techniques can provide good results for the
problem of detecting structural similarity in time
series. As a consequence in this paper we propose a
variation to the classical PLA representation of time
series and define a distance measure that can be used
in conjunction with this representation format.
3.1 Data Adaptive Representation
Format
While most approaches that are based on a PLA
representation of data perform the segmentation of
the original sequence using a fixed-width predefined
segment size (Pazzani & Keogh, 1998), (Chen, et al.,
2007), we have chosen to use a data-adaptive
segmentation approach instead. The reasons behind
avoiding the use of a fixed-width segmentation are
twofold:
On one hand the result of fixed-width
segmentation approaches is always dependant on the
starting point of the segmentation, since this choice
automatically determines the location of all
subsequent segmentation (or “cutting”) points. As a
consequence the selection of the segmentation
starting point is a challenging task, since a poor
choice can lead to incorrect results.
On the other hand, by using a fixed-width
segmentation an additional variable is added to the
similarity search problem: the segment width, i.e.
the number of data points in the original sequence
that correspond to a single segment in the linear
approximation. The choice for the segment width
that shall be used represents another challenge, since
this choice is always dependent on the nature of the
problem and on the characteristics of the analysed
data set, which means that additional effort is
necessary to determine the optimum width.
It is important to note that there is also a
downside to the use of a data adaptive segmentation.
Since the endpoints for each segment cannot be
calculated automatically, it is required to store (at
least) 2 pieces of information per segment:
The slope of the segment
The length, endpoint or any equivalent
measure that can be used to determine the run
length of the segment
This information can be derived and stored for each
segment during the pre-processing phase when the
linear approximation of the sequence is computed.
Furthermore in our approach we store every segment
in the form of an independent linear function (ax +
b), in order to ease the calculation of our proposed
distance measure, as will become clear in the
following sections.
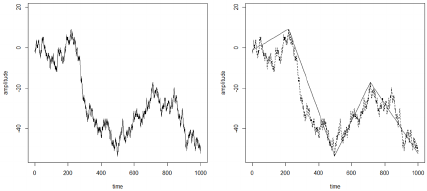
Figure 1: Sample time series sequence (left) and its
corresponding data-adaptive linear approximation (right).
3.2 Segmentation
To obtain the individual linear approximation
segments from the raw data, a bottom-up
segmentation is applied, which has been shown to
produce the representations with the smallest errors
(Keogh, et al., 2001).
Bottom-up segmentation operates by iteratively
merging the adjacent segments that produce the
Data Driven Structural Similarity - A Distance Measure for Adaptive Linear Approximations of Time Series
69

smallest error, until some stopping criteria is met.
This means that a sequence can be represented by
any number N of segments, with 1 ≤ N ≤ l-1, l being
the number of data points of the initial sequence.
Starting from this observation, we introduce a new
metric G
l
, representing the granularity of the linear
approximation for a sequence of initial size l:
100*
2
1
)(
−
−
=
l
N
NG
l
(1)
The granularity function is 0 when the sequence is
approximated through a single linear segment, and
100 when the initial sequence is represented by l-1
segments. One of the objectives of this paper is to
study the change in pattern identification
performance with varying granularities of the linear
approximation. This aspect is described in more
detail in the fourth section.
3.3 Distance Measure
When using a data adaptive representation format,
the benefit of having low representation errors
comes at a cost: the “cutting points” determined
during the segmentation process are not aligned
across the sequences that are being compared. As a
consequence it is necessary to define a more flexible
distance measure in order to determine the similarity
of two sequences that are stored using this data
adaptive format.
Thus, we have introduced a new Area-Between-
Curves distance measure (ABC), to quantify the
similarity of two such sequences.
The algorithm for calculation of the ABC
distance is described below, where A and B are two
sequences of equal length for which the ABC-
distance should be calculated, and N represents the
number of segments by which the segments should
be approximated before the calculation. The distance
measure is defined in such a way that it is applicable
to different segmentation techniques:
ABC(A, B, segType, N)
{
A = zNormalize(A);
B = zNormalize(B);
sA = segment(A,segType, N);
sB = segment(B,segType, N);
i = 0;
do
{
j = nextCuttingPoint(sA, sB, i);
result += SectDif(sA, sB, i, j);
i = j;
}
while ( j < N );
return result;
}
The first step of the algorithm is represented by
the pre-processing phase, in which sequences A and
B are z-normalized. This assures that any global
scaling or offset of the sequences' amplitudes is
eliminated. Afterwards the sequences are
transformed into their piecewise linear
approximation. This is done through a call of the
segment(*, segType, N) function, where:
N represents the number of segments used to
approximate the sequence, being the
parameter through which the segmentation
granularity can be controlled
segType is a control parameter, determining
the segmentation approach to be used (in our
case fixed-width and data-adaptive). In case of
the data-adaptive approach, a bottom-up
segmentation is performed iteratively, until
both sequences are represented through N
segments
The algorithm then sequentially traverses both
segmentations in parallel from one "cutting point" to
the next. For this, the nextCuttingPoint() function
returns the next-nearest segment endpoint,
originating either from sequence A or from sequence
B. At each iteration, the area between the linear
sections of A and B, located in the range [i, j], is
calculated by the SectDif() function, which in
analytical terms can be defined as:
()
−=
j
j
BAjiBASectDif ),,,(
(2)
(2) enables the distance calculation for a section in
constant time, but is only applicable if the individual
segments have indeed been stored in the form of
linear functions. This can be achieved by means of
an additional pre-processing step during the linear
approximation phase, as mentioned before.
Figure 2 provides the graphical intuition behind
the ABC distance metric, with the shaded area
representing the distance between the two
sequences:
Figure 2: Data-adaptive linear approximation of two
sequences (left and middle plots), and their corresponding
ABC distance (shaded area in the right plot).
KDIR 2015 - 7th International Conference on Knowledge Discovery and Information Retrieval
70
4 EXPERIMENTAL RESULTS
4.1 Evaluation Methodology
In order to assess the efficiency of the proposed
data-adaptive representation method and its
corresponding ABC distance metric, we have chosen
an approach commonly used in literature. 1-NN
classification is performed on a labelled set of test
data: every test set is composed of clusters of time
series sequences, the label of each sequence
identifying the cluster (or class) to which the
sequence belongs to. The classification is performed
by using the Area-Between-Curves as the underlying
distance measure in order to determine the pairwise
similarity between sequences.
4.1.1 Accuracy
To quantify the similarity search performance
obtainable through use of our ABC distance metric
the error rate of the previously described 1-NN
classification has been used. This is justified by the
fact that the error rate reflects the effectiveness of
the similarity measure.
For every test set, the error rates obtained by
using 3 distinct similarity measures have been
compared:
Euclidean Distance, calculated on the original
(without any dimensionality reduction), z-
normalized data set
ABC(data-adaptive), our proposed similarity
measure, calculated on the data-adaptive
linear approximation of the initial sequence
ABC(fixed-width), the same distance measure
calculated for a fixed-width representation of
the initial sequence
The reasons behind this choice are revealed next.
In (Wang, et al., 2013) authors have shown that
despite its simplicity, the Euclidean Distance (ED)
performs very well in comparison to other more
complex distance measures. In fact, the same work
has shown that while elastic distance measures such
as Dynamic Time Warping (DTW) might
outperform the Euclidean Distance for small data
sets (at the cost of lower speeds), the difference
between DTW and ED in terms of both accuracy and
amortized speed becomes statistically insignificant
with increasingly larger data sets.
As a consequence the error rates obtained by
means of the intuitive and easy-to-compute
Euclidean Distance are a good starting point that can
be used as base reference when interpreting the
results obtained with our ABC similarity measure.
In addition to this, the ED-based approach also
operates in a fundamentally different way than our
proposed similarity measure: while the ED is a lock-
step measure that is sensitive to noise and shifts on
the time axis, our approach is aimed at identifying
similarity on a broader scope, with local divergences
having less influence on the outcome of the
similarity search. Thus, we aim to determine
whether a certain similarity measure is better suited
for particular data types from the various evaluated
sources.
4.1.2 Speed of Convergence
In addition to the actual similarity search
performance, one other aspect of the similarity
search that has been evaluated is the variation in
classification accuracy for approximations of
increasingly larger granularity. In other words, what
is the change in the accuracy of the similarity search,
when using N and N +1 segments to approximate the
time series respectively, and how fast does the error
rate converge towards its minimum value?
4.2 Data Sets
In the interest of reproducible research, the
experiments have been conducted on the UCR Time
Series Classification data sets (Keogh, et al., 2011),
which have been gathered from diverse sources and
referenced extensively in more than 100 recent
works (Aghabozorgi & Teh, 2014), (Batista, et al.,
2014), (Lines & Bagnall, 2014), (Fulcher & Jones,
2014).
4.3 Results
Figure 3 highlights the 1-NN error rates (vertical
axis) obtained for the synthetic_control data set by
means of the 3 distance measures (ED, ABC(data-
adaptive), ABC(fixed-width) ).
While the ED error rate is 0.12 (horizontal line),
the error rate for the ABC-based classification
depends on the granularity of the piecewise linear
approximation, i.e. the number of segments used to
approximate the sequence (horizontal axis). In this
case, given the original time series length of 60
points, a granularity G = 100% corresponds to a
linear approximation composed of 59 segments.
Data Driven Structural Similarity - A Distance Measure for Adaptive Linear Approximations of Time Series
71
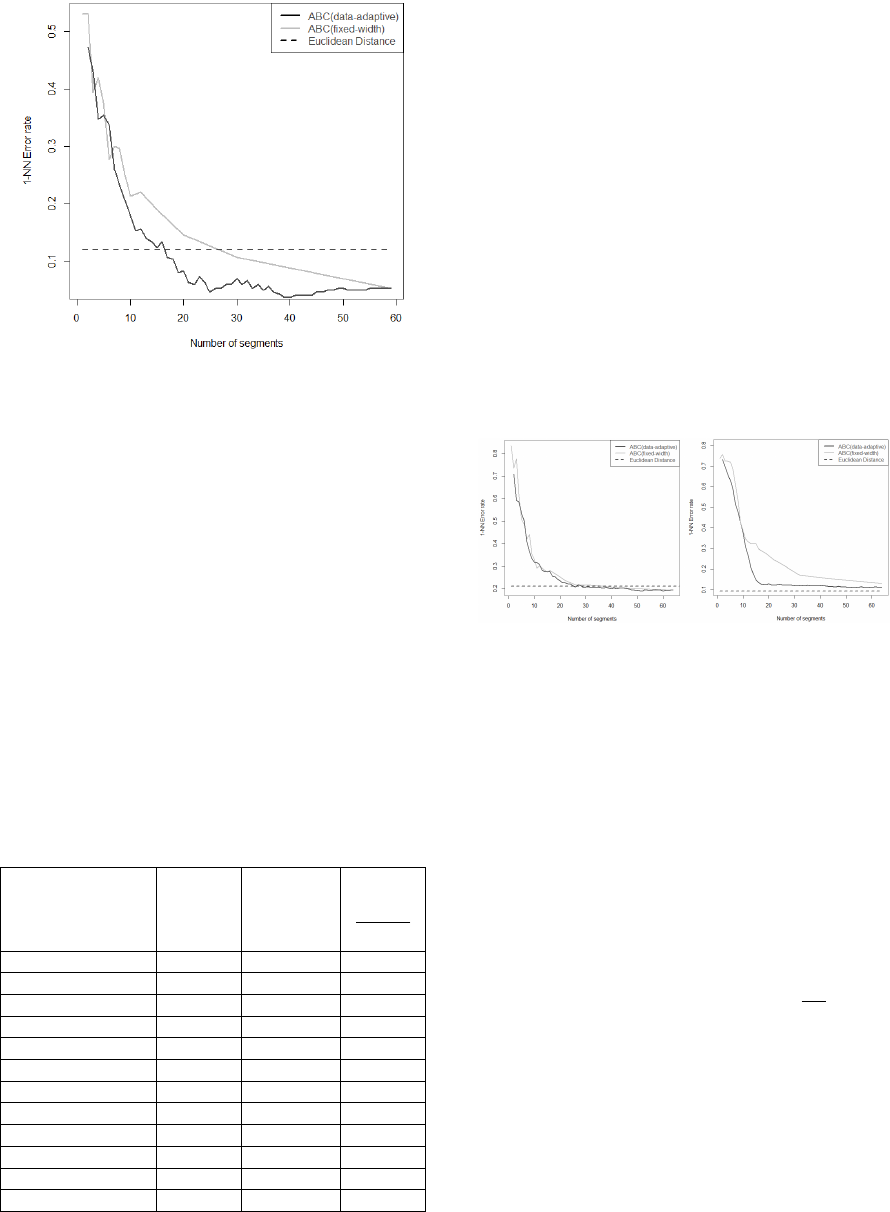
Figure 3: Error rate plot for synthetic_control data set.
Several conclusions can be drawn from this first
error rate plot, which have also been confirmed by
subsequent evaluations on further data sets (as can
be seen also in the additional error rate plots in
Figure 4):
4.3.1 Accuracy
At its minimum level (0.036), the error rate for the
data-adaptive linear approximation is considerably
lower than that of the Euclidean distance. While this
result does not hold true across all of the evaluated
data sets, the linear approximations have in many
cases (7 out of 11) outperformed or at least matched
the performance of the point-by-point Euclidean
Distance similarity measure.
Table 1: Error rates obtained by using the ED and
ABC(data-adaptive) distance measures for distinct data
sets, and the relative change between the two approaches.
Data Set
Error rate
for ED
Min. error
rate for
ABC(data-
adaptive)
∆
relative
−
ED
EDABC
CBF 0.147 0.124 -15.65%
FaceAll 0.286 0.207 -27.62%
Lightning7 0.424 0.301 -29.01%
Synthetic_ control 0.120 0.036 -70.00%
GunPoint 0.088 0.080 -9.09%
Adiac 0.388 0.396 +2.06%
Fish 0.217 0.228 +5.07%
ItalyPowerDemand
0.044 0.048 +9.09%
Wafer 0.004 0.004 0.00%
Swedish Leaf 0.211 0.198 -6.16%
Two Patterns 0.093 0.111 +19.3%
average
0.184 0.158 -11.09%
Table 1 displays the minimum error rates for the ED
and ABC(data-adaptive) similarity measures,
calculated for different data sets of the UCR suite.
While some results might be regarded as statistically
insignificant (with variations of ± 5% between the
two similarity measures), there are also data sets
(e.g. FaceAll, Lightning7) for which a considerable
improvement is visible when using the ABC-based
similarity. The different outcome from one data set
to the other might be justified by the varying nature
of the data sets: e.g. the separation into distinct
classes of patterns in case of the Adiac and Fish data
sets is based on differences of finer granularity,
while for the other data sets the higher level
structure determines the class of the data. However
on average, as can be seen in Table 1, the ABC-
based classification has achieved error rates 11.09%
lower than the ED-based approach.
Figure 4: Additional error rate plots for the
SwedishLeaf(left) and TwoPatterns(right) data sets.
4.3.2 Speed of Convergence
One other important observation noticeable in
Figure 3 and 4 is that with increasing segmentation
granularity (number of segments used for the linear
approximation, i.e. X-axis), the error rate drops
rapidly towards its minimum level. In order to
quantitatively evaluate this aspect, we consider it
relevant to introduce an additional metric. (3)
The accuracy threshold, T(x), represents the
level at which x% of the lowest achievable error rate
has been reached:
−−=
100
*)()(
x
errorMinerrorMaxerrorMaxxT
(3)
e.g. the error rates for the synthetic_control data set
range from 0.52 to 0.036 (see Figure 3). In this case,
the 90% accuracy threshold, T(90) is represented by
an error rate of 0.085.
The experimental results summarized in Table 2
have shown that, for most data sets, the 90%
accuracy threshold can be reached with a
segmentation granularity G < 15%. In fact, for
individual date sets such as Fish the 90% threshold
KDIR 2015 - 7th International Conference on Knowledge Discovery and Information Retrieval
72
is reachable with a granularity below 5%. The first
two columns of Table 2 provide an overview of
these experimental results for several data sets.
Table 2: Speed of convergence test (minimum required
approximation granularity to reach 90% accuracy
threshold) for data-adaptive and fixed-width linear
approximation respectively.
Data Set Min. segmentation granularity
Data-adaptive Fixed-width
Fish 4.3% 4.7%
wafer 4.9% 8.6%
adiac 13.1% 14.2%
swedish leaf 14.9% 16.5%
CBF 14.9% 29.1%
Lightning7 15% 78%
FaceAll 20% 30.7%
synthetic_control 31.6% 75%
average
14.8% 32.6%
The conclusion to be drawn from this experiment
is that using data-adaptive linear approximations
allows a high compression of the initial data set
without degrading the performance of similarity
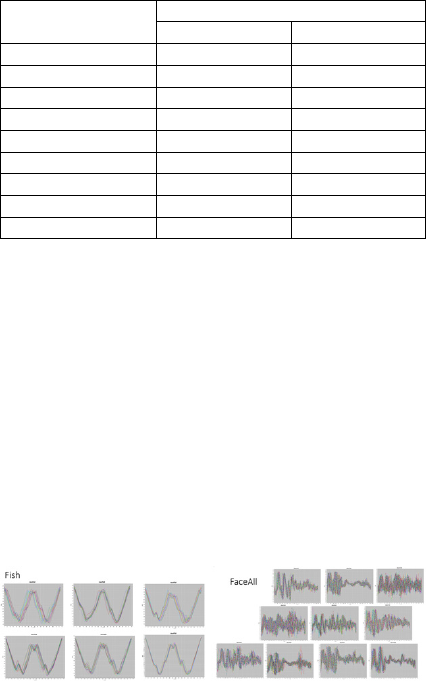
identification. The fact that the minimum necessary
segmentation granularity varies significantly from
one data set to the other can easily be justified by
visually analysing the data sets (Figure 5). While
simpler, “smooth” sequences (e.g. Fish data set) can
be approximated accurately with very few segments,
more segments are needed in the case of sequences
that have a higher variation/complexity (e.g.
FaceAll)
Figure 5: Plot of Fish and FaceAll data sets.
Finally, we have compared these results with the
same “speed of convergence” obtainable through use
of a fixed-width segmentation. As can be seen in
Figures 3 and 4, although both approaches
ultimately converge towards the same error rate, the
rate drops faster in the case of the data-adaptive
segmentation.
As a result the same error rate can be achieved
with a lower approximation granularity when data-
adaptive segmentation is employed, enabling a better
dimensionality reduction, which ultimately also
saves up processing time during similarity search.
Our conclusion is also backed by the experimental
results conducted on the data sets, as can be seen in
the last column of Table 2, with error rates
associated to the data-adaptive segmentation
consistently outperforming fixed-width
segmentation.
5 CONCLUSIONS AND FUTURE
WORK
While much effort has been invested in previous
work in the field of similarity search in time series,
only a fraction of this work addresses the problem of
approximate matching between sequences. As a
consequence, in the current paper we have proposed
a similarity search approach aimed at covering this
gap. The approach uses a novel Area-Between-
Curves distance measure, which operates on a data-
adaptive linear approximation of the original data
sets.
We have shown that the 1-NN classification
performed by means of our proposed similarity
measure has managed to outperform the ED-based
approach, having on average a 11.09% lower error
rate for the evaluated data sets.
While the similarity identification performance
of the ABC measure has been better or equal for
many (7 out of 11) of the analysed data sets, in some
cases better results have been obtained by using the
ED-based approach. In a future work we plan to
analyse if, based on certain data set meta-data, rules
can be inferred for an automatic identification of
data sets that are suitable for the ABC distance
measure.
By comparing the ABC-measure performance
for data-adaptive and fixed-width approximations of
the original data sets, we have also shown that the
use of a data-adaptive representation method enables
a significantly better compression of the data,
without any loss in classification accuracy.
The results lead us to the conclusion that the
proposed approach provides a competitive solution
to the problem of similarity search in time series,
with significant performance improvements in
particular for domains in which the matching criteria
for time series is the high-level/structural similarity
of the sequences.
In future work we intend to further build upon
the advantage of high compressibility, by using
indexing techniques to store the reduced time series
representation, thus enabling lower lookup times
during the similarity search.
Furthermore, the time series representation
format used in this paper poses an additional
Data Driven Structural Similarity - A Distance Measure for Adaptive Linear Approximations of Time Series
73
opportunity: the data-adaptive linear approximation
is relatively easy to scale in length and amplitude,
which could make our ABC-based approach a good
candidate for identifying similarity even among time
series of varying lengths. We intend to evaluate this
aspect in future work.
Finally, the problem of similarity search in time
series is often used in combination with streaming
sets of data. For such scenarios however the entire
similarity search approach needs to be designed in
consideration of this incremental nature of the data
sets.
As a consequence, in future work we plan to
analyse the applicability of the ABC distance
measure in combination with an index structure in
the context of online similarity search, where
sequences are represented by continuously flowing
streams of data.
REFERENCES
Aghabozorgi, S. and Teh, Y. W., 2014. Stock market co-
movement assessment using a three-phase clustering
method. Expert Systems with Applications, 41(4), pp.
1301-1314.
Agrawal, R., Faloutsos, C. and Arun, S., 1993. Efficient
Similarity Search in sequence databases. Proceedings
of the 4th international Conference on Foundations of
Data Organization and Algorithms, pp. 69-84.
Batista, G., Keogh, E., Tataw, O. M. and de Souza, V. M.
A., 2014. CID: an efficient complexity-invariant
distance for time series. Data Mining and Knowledge
Discovery, 28(3), pp. 634-669.
Chen, Q. et al., 2007. Indexable PLA for Efficient
Similarity Search. Proceedings of the 33rd
international conference on Very Large Data Bases,
pp. 435-446.
Faloutsos, C., Ranganathan, M. and Manolopoulos, Y.,
1994. Fast subsequence matching in time-series
databases. Proceedings of the 1994 Annual ACM
SIGMOD Conference, pp. 419-429.
Fulcher, B. D. and Jones, N. S., 2014. Highly Comparative
Feature-Based Time-Series Classification. IEEE
Transactions on Knowledge and Data Engineering,
26(12), pp. 3026-3037.
Fu, T.-c., 2011. A review on time series data mining.
Engineering Applications of Artificial Intelligence,
24(1), pp. 164-181.
Fu, T.-c., Chung, F.-l., Lunk, R. and Ng, C.-m., 2005.
Preventing meaningless Stock Time Series Pattern
Discovery by Changing Perceptually Important Point
Detection. Fuzzy Systems and Knowledge Discovery,
pp. 1171-1174.
Keogh, E., 2003. Probabilistic Discovery of Time Series
Motifs. Proceedings of the ninth ACM SIGKDD
international conference on Knowledge discovery and
data mining, pp. 493-498.
Keogh, E., Chakrabarti, K., Pazzani, M. and Mehrotra, S.,
2001. Dimensionality Reduction for fast similarity
search in large time series databases. Knowledge and
information Systems, Volume 3, pp. 263-286.
Keogh, E., Chakrabarti, K., Pazzani, M. and Mehrotra, S.,
2001. Locally Adaptive Dimensionality Reduction for
Indexing Large Time Series Databases. ACM
SIGMOD Record, Volume 30, pp. 151-162.
Keogh, E., Chu, S., Hart, D. and Pazzani, M., 2001. An
online algorithm for segmenting time series.
Proceedings IEEE International Conference on Data
Mining, pp. 289-296.
Keogh, E. and Pazzani, M., 2001. Derivative Dynamic
Time Warping. SDM, Volume 1, pp. 5-7.
Keogh, E., Zhu, Q., Hu, B., Hao. Y., Xi, X., Wei, L. and
Ratanamahatana, C. A., 2011. The UCR Time Series
Classification/Clustering Homepage
Lines, J. and Bagnall, A., 2014. Time series classification
with ensembles of elastic distance measures. Data
Mining and Knowledge Discovery, 29(3), pp. 565-592.
Lin, J., Khade, R. and Li, Y., 2012. Rotation-invariant
similarity in time series using bag-of-patterns
representation. Journal of Intelligent Information
Systems, 38(2), pp. 287-315.
Lin, J., Williamson, S., Borne, K. and DeBarr, D., 2012.
Pattern Recognition in Time Series. Advances in
Machine Learning and Data Mining for Astronomy,
Volume 1, pp. 617-645.
Olszewski, R., 2001. Generalized Feature Extraction for
Structural Pattern Matching in Time-Series Data.
Pazzani, M. and Keogh, E., 1998. An enhanced
representation of time series which allows fast and
accurate classification, clustering and relevance
feedback. KDD, Volume 98, pp. 239-243.
Ratanamahatana, C. A. and Keogh, E., 2005. Exact
indexing of dynamic time warping. Knowledge and
information systems, 7(3), pp. 358-386.
Shatkay, H. and Zdonik, S., 1996. Approximate Queries
and Representation for Large Data Sequences.
Proceedings of the Twelfth International Conference
on Data Engineering, pp. 536-545.
Shieh, J. and Keogh, E., 2008. iSAX: Indexing and
Mining Terabyte Sized Time Series. Proceedings of
the 14th ACM SIGKDD international conference on
Knowledge discovery and data mining, pp. 623-631.
Toshniwal, D. and Joshi, R. C., 2005. Similarity Search in
Time Series Data Using Time Weighted Slopes.
Informatica, 29(1).
Wang, X. et al., 2013. Experimental comparison of
representation methods and distance measures for time
series data. Data Mining and Knowledge Discovery,
pp. 275-309.
KDIR 2015 - 7th International Conference on Knowledge Discovery and Information Retrieval
74
