Use of Frequent Itemset Mining Techniques to Analyze Business
Processes
Vladimír Bartík and Milan Pospíšil
Faculty of Information Technology, Brno University of Technology, Božetěchova 2, Brno, Czech Republic
Keywords: Business Process, Process Mining, Frequent Itemsets, Simulator of Production History, Association Rules.
Abstract: Analysis of business process data can be used to discover reasons of delays and other problems in a business
process. This paper presents an approach, which uses a simulator of production history. This simulator al-
lows detecting problems at various production machines, e.g. extremely long queues of products waiting be-
fore a machine. After detection, data about products processed before the queue increased are collected.
Frequent itemsets obtained from this dataset can be used to describe the problem and reasons of it. The
whole process of frequent itemset mining will be described in this paper. It is also focused on description of
several necessary modifications of basic methods usually used to discover frequent itemsets.
1 INTRODUCTION
The paper is focused on application of data mining
techniques to the data, which describe business pro-
cesses. This task is called process mining and it is
focused on analysis of information from event logs
that were produced by business processes. In process
mining, the typical result is the process description,
which is previously unknown.
In this paper we assume that we know descrip-
tion of a process but the process log often needs
further analysis. Our objective is to obtain other
knowledge, which should be a previously unknown,
potentially useful and valid knowledge, which leads
to an improvement of a business process.
There are two basic kinds of data mining tech-
niques: descriptive and predictive. In process min-
ing, predictive techniques, such as classification, can
be, for example, used to predict events leading to
delay in a process. Based on the learning dataset
collected in past, a user can be warned during the
process about high probability of a problem appear-
ing in the process.
On the other hand, descriptive techniques, such
as association rules or frequent itemsets can help an
analyst to a better understanding of the reasons of
various problems in a business process. The main
objective of this contribution is the use of frequent
itemsets to describe some critical moments in the
business process. Its application will be presented
using a business process in a manufacturing compa-
ny.
The event log used for our analysis is usually in
a form of a relational table. Therefore, it is possible
to use an arbitrary data mining method to analyze it.
Frequent itemsets and association rules have been
originally designed for transactional databases usual-
ly used in the market domain. But it is not a problem
to adapt it for analysis of relational data. Some is-
sues regarding this adaptation will be described in
the following sections in detail.
Data used for analysis are collected by the simu-
lator of producing history, which takes the event log
as an input. The simulator takes the input and scans
the queues before each production machine. If the
queue before a production machine in a relatively
short time interval is rapidly increased, the products
and their properties are stored into a database table,
which is used subsequently for analysis.
The organization of our paper will be following.
After a summarization of works related to our prob-
lem, the simulator of producing history and the way
how the data for analysis are obtained is described in
Section 3. Then, in Section 4, the process of frequent
itemset mining and several related problems needed
to be solved are described. Then, results of our pro-
cess mining method are shortly summarized in Sec-
tion 5 and an outline of various extensions of our
approach for the future and conclusion are contained
in the last sections.
Bartík, V. and Pospíšil, M..
Use of Frequent Itemset Mining Techniques to Analyze Business Processes.
In Proceedings of the 7th International Joint Conference on Knowledge Discovery, Knowledge Engineering and Knowledge Management (IC3K 2015) - Volume 1: KDIR, pages 273-280
ISBN: 978-989-758-158-8
Copyright
c
2015 by SCITEPRESS – Science and Technology Publications, Lda. All rights reserved
273
2 RELATED WORK
Data mining techniques are often used in business
process management. The research area is referred
to as Process Mining (Van der Aalst et al., 2007,
2011). It is focused on analysis of information from
event logs that were produced by business processes.
The results can be used to build a model from an
unknown process (this is called process discovery
(Rozinat et al., 2009)) or to make the model more
precise.
Data mining techniques can also be used to ana-
lyse the behaviour of a process, for example decision
tree based classification can be used to predict the
process performance (Wetzstein et al., 2009). An-
other prediction based method was proposed in (Po-
lato et al., 2014). In (Grigori et al., 2001) it was
shown that classifiers can also be used to predict the
execution time of the process, based on case attrib-
utes and time information of preceding tasks.
Descriptive data mining techniques have not
been used frequently in the process mining yet. This
paper shows that one of them (frequent itemsets
mining) can be used to describe the problems which
occur during the process and understand them.
Association rules and frequent itemsets were
first introduced in (Agrawal et al., 1993). Mining
association rules was primarily designed for usage in
transactional data, typically used in the market do-
main. Here, the goal is to find sets of items, which
occur frequently together in the same transaction. A
lot of algorithms for mining frequent itemsets in
transactional data have been developed. The Apriori
algorithm (Agrawal and Srikant, 1994) is probably
the most famous of them because of its simplicity.
On the other hand, the FP-Growth algorithm (Han et
al., 2000) proved to be much more efficient than the
Apriori algorithm. A lot of modifications and im-
provements have been proposed for both algorithms.
Our dataset obtained by the simulator is in a
form of a relational table. Mining frequent itemsets
in relational tables is quite different because some of
the attributes are continuous and they need to be
discretized. Discretization can be very simple, if we
use equi-depth or equi-width discretization, but there
have also been several advanced methods proposed,
such as distance-based methods described in (Miller
and Yang, 1997) and (Li et al, 1999), where discreti-
zation is based on clustering. After discretization, we
can consider one record in a table as a transaction
and use a slight modification of basic methods of
frequent itemset mining.
A set of frequent itemsets can also be further
used as a classifier, as it was presented in (Liu et. al,
1999) and (Bartik, 2007). Therefore, the results of
our paper can be used also to a predictive analysis of
event logs afterwards.
3 ACQUIREMENT OF THE DATA
FROM AN EVENT LOG
Our approach is used in the manufacturing company,
which is producing doors. The event log describes
the whole production process. The process is im-
plemented by a set of various production machines,
each of which is responsible for one aspect of a door
production. One record in the event log represents a
production task of one product at one machine.
We also have a set of attributes for each product.
The manufacturing company needs to know how the
attributes of various products to be produced affect
the queues before some of the machines. Some of
them lie on the critical path, which consists of a set
of machines, which work in serial. These machines
are most probable to have a long queue before it and
that is why we have to focus our attention on these
machines.
To analyze the queues before the machines and
to obtain the data for analysis, we use the simulator
of production history.
3.1 Data Acquirement
The task, for which we use the simulator of produc-
tion history, is to analyze the queues before the ma-
chines on the critical path and if the queue becomes
very long, we have to store the information about
last products produced by that machine immediately
before the increase of the queue into a special rela-
tional table.
We have to mention that the length of a queue is
not the most important criterion to store that infor-
mation because a long queue can be caused by high-
er number of products at the input of the production
line and this does not necessary mean a problem in
the business process.
Data about the products, which possibly cause
some problem, are collected in the moment when the
queue is increased rapidly in a short time interval.
The queue before each machine in the critical path is
monitored continuously and the actual length of the
queue is compared with its length recorded, for ex-
ample, one hour before. If the difference is greater
than a constant specified by the user, then infor-
mation about the last batch of doors is stored into the
dataset for analysis. In our business process of a
KDIR 2015 - 7th International Conference on Knowledge Discovery and Information Retrieval
274
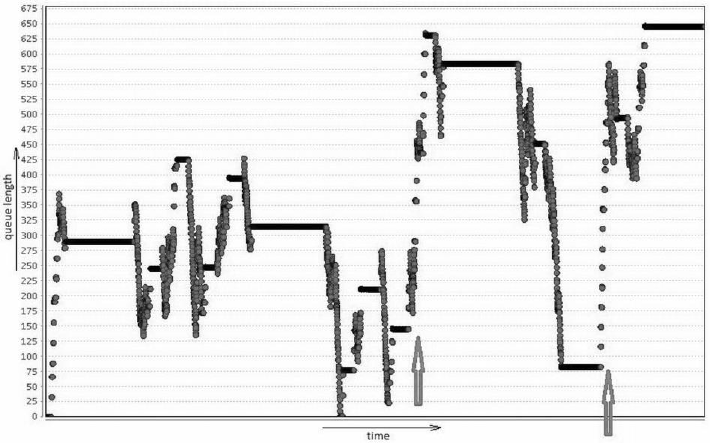
Figure 1: Histogram of queue lengths at a production machine.
manufacturing company, this constant has been set
to a value of 100. But this number can be different
for other processes
There is an example of a histogram of queue
lengths at one production machine depicted in Fig-
ure 1. The points in time, in which the queue in-
creased rapidly and therefore the data about products
are collected into the dataset, are labelled by the
arrows. Data are stored into a relational table and the
task will be to obtain properties of products, which
occur frequently together in records collected in
moments when the queue is rapidly increased.
3.2 Description of the Data
Each record in the input relational table represents
one piece of product. In our case, the table consists
of 17 attributes, both continuous and categorical.
Continuous attributes include primarily proportions
of each product, which should be discretized in some
suitable way. The categorical attributes are stored in
a form of strings and they represent some visual
properties and material of which the product is
made.
The information about production machine, on
which the increased queue was identified, is also
assigned to each record. This allows manager to
specify if he needs to mine frequent itemsets repre-
senting “problematic” products for all machines
together or for a specific machine that he currently
needs to be analyzed.
We also collect the information about time, when
the product has been processed by the machine but
this information is not needed for frequent itemset
mining but it can be used for further analysis of data.
The algorithm for collecting the data was execut-
ed for an event log, which describes the production
process during the interval of two years. The rela-
tional table consists of approximately 15000 records
for three production machines at the critical path.
There is no need for complex pre-processing of
this data, except discretization of continuous attrib-
utes, which will be discussed later.
3.3 Problems of Data Quality and
Their Solutions
There are several types of problems that could be
resolved to improve frequent itemset mining accura-
cy. In this section, they will be reviewed and sum-
marized. Here is the list of common problems:
• Incomplete Measurement. Some workplaces are
measured only partially. Only start or finish time
information is available. The worst case is when
no measurement is available – the information
can be derived from context tasks around. But in
this case, the precision of data can be significant-
ly lower.
• Cluster Measurement. This happens when setup
time and errors are measured together with work
time.
• Hidden Subprocess. If the execution time of task
is measured, task could contain a subprocess with
unknown execution time – we know only execu-
tion time of the whole process but sometimes we
Use of Frequent Itemset Mining Techniques to Analyze Business Processes
275

need to know the times of its subtasks to better
predict real execution time or analyze the event
log. This problem is similar to the process dis-
covery problem.
• Changes in Time. Real processes are not static;
their execution times change in time. There are
two possible solutions – adjust method to changes
or ignore changes and work only with new rele-
vant data. We have to choose between these two
solutions. It depends on the concrete situation.
When changes of processes are small and slow,
methods could be easily adjusted, when changes
are larger, using only the newer data may be a
better solution.
• Other Reasons of Wrong Execution Time. If
the queue before a production machine increases,
it is not caused by a problem of the process in all
cases. There are also other reasons of it, such as
the worker had a break or the machine had some
failure etc. These cases should not be collected
into the dataset for analysis. The problem should
be solved in the pre-processing phase, if we are
able to detect these situations.
4 FREQUENT ITEMSET MINING
In this section, the problem of mining of frequent
itemsets in relational tables used in our process min-
ing task will be defined formally. Then, our modifi-
cation of the basic Apriori algorithm will be de-
scribed, together with other various solutions of
related problems.
4.1 Formal Definition
Assume that we have a relational table R, which is
defined on domains D
1
, D
2
, …, D
n
. It is defined as a
an ordered pair R=(H, R*), where H is the heading
of a relational table and R* is its body, which con-
tains records. The heading of a table is defined as a
set H={(A
1
:D
1
), (A
2
:D
2
), …, (A
n
:D
n
)}, where A
i
≠
A
j
,
for each i
≠
j. A
i
, for each i=1,2, …, n are the attrib-
utes of a table and D
i
are their corresponding do-
mains (sets of possible scalar values of an attribute,
which must be of the same type). The body R* of a
relational table is defined as a relation R*
⊆
D
1
×
D
2
×
…
×
D
n
.
If the domain D
i
of an attribute A
i
is finite, then
the attribute is categorical. On the other hand, if the
domain is infinite and there is an ordering defined
for that attribute then the attribute is continuous (or
quantitative).
We have to find a set of frequent itemsets in a re-
lational table. A frequent itemset FI in a relational
table R is defined as a set of predicates p of a form
{a
1
, a
2
, …, a
n
}. This set of predicates with their val-
ues must correspond with a given count of rows
from the body R*. The count of rows must be higher
than a minimum specified by means of minimum
support threshold. The set FI of all frequent itemsets
can be then specified as:
FI = { fi | support(fi)
≥
minsup }
(1)
The value of support s for a set of predicates S is
defined as a ratio of row count in the table, in which
their values correspond to the values contained in
the set of predicates S to the overall count of rows in
the relational table. It can be expressed as follows:
s(fi) =
(2)
where N is the count of all rows in the table R
and n is the count of rows, which correspond to the
set of items S.
If a set of predicates p={a
1
, a
2
, …, a
n
} has a sup-
port value higher than a minimum support threshold,
then there must exist a set Rows, which contains
records from the table R, for which:
∀
∈:
≈
:
||
≥
(3)
The expression a
k
≈ r
i
denotes that values contained
in a given predicate a
k
are contained in the record r
i
of the relational table R.
If A is a categorical, Boolean attribute or a nu-
merical attributes with a small domain of values, the
expression a
k
≈ r
i
is defined as:
(
=
)
≈
∃:
=
= (4)
On the other hand, if A is a continuous attribute
with a large domain, it is defined as:
(
=[,ℎ]
)
≈
∃:
=
≤
≤ℎ (5)
The equation (5) leads to the problem of continuous
attribute discretization, where the values of the l and
h values must be set.
Except support and confidence, there have sev-
eral alternative measures of frequent itemset and
association rule frequency proposed. This includes
the crossSupportRatio measure (Xiong et al., 2003),
which means the ratio of support value of the least
frequent item to support value of the most frequent
item. The next possible measure is the allConfidence
(Omiecinski, 2003), which is defined as the mini-
mum confidence value among all possible associa-
tion rules generated from that itemset.
In our work, the support and confidence
measures proved to be sufficient to represent the
frequency of itemsets and association rules.
KDIR 2015 - 7th International Conference on Knowledge Discovery and Information Retrieval
276

4.2 Description of the Method
In general, there are two basic kinds of methods
available to discover frequent itemsets: Apriori
based algorithms and methods based on the FP
Growth algorithm. Since the efficiency of the algo-
rithm is not the critical problem in our application,
we have decided to use the Apriori based algorithm
in the first phase. This algorithm works in two fol-
lowing iterative phases.
The first of them is the generation of k-itemsets –
itemsets with k items (candidates): In the first itera-
tion, the frequent 1-itemsets are generated from the
database. In all consecutive iterations, a set of fre-
quent k-itemsets is generated from a set of frequent
(k-1)-itemsets obtained in the previous iteration.
This step consists two phases: concatenation and
extraction. The first one generates all possible k-
itemsets (candidates). The second one extracts the
itemsets any subset of which is not contained in
frequent itemsets generated in the previous itera-
tions. This results from the fact that the support of a
k-itemset cannot be higher than the support of its
subset (this property is also called the Apriori prop-
erty).
The second step is counting and checking the
minimum support threshold. All transactions in the
database are scanned and if the itemset is found, its
support is incremented. Then, the minimum support
threshold is checked.
If no new (k+1)-itemsets are generated in some
iteration, the algorithm is stopped and the final result
is the union of all frequent itemsets generated by
previous iterations, which contain 1 to k items.
The next section contains description of several
modifications needed to adapt the Apriori algorithm
to use it in our relational dataset generated from the
event log for the purpose of process mining.
For the FP-tree method, these modifications can
be the same. No other modifications are needed.
4.3 Discretization and Other Necessary
Modifications
As it was mentioned above, the first problem needed
to be solved is discretization of continuous attrib-
utes. This is necessary because of the fact that sup-
port of items containing continuous values is much
lower than those with categorical values. This leads
to a result consisting only from frequent itemsets
with categorical values.
In our project, we decided to use the equi-width
discretization. The main disadvantage of this ap-
proach is the fact that continuous attributes usually
do not have uniform distribution and therefore the
differences of support values for various intervals of
continuous values can differ very much. Influence of
this factor will be significantly reduced by arrange-
ments described below.
The next modification is the filtering of frequent
itemsets, which is performed after the set of all fre-
quent itemsets is obtained. If we obtain a lot of fre-
quent itemsets with very high values of support, it is
necessary to compare the value with its frequency of
occurrence in the overall event log.
For example, in the manufacturing company, if
we obtain a frequent itemset containing properties of
products {height=[x
1
, x
2
], edge_surface = ‘yyyy’}
with the value of support equal to 20%, we have to
scan the whole event log and count the support of
this itemset within the event log. If the value of sup-
port is similar (or higher), the frequent itemset has
no significance for the analysis of delays. The sup-
port of an itemset in the dataset collected when the
queues are rapidly increased should be significantly
higher than in the whole event log.
Therefore we have decided to set the minimum
support threshold at a quite lower value because a lot
of frequent itemsets is filtered. This causes that the
time complexity of the algorithm is quite higher but
this makes it possible to obtain more interesting
frequent itemsets meeting the requirements men-
tioned above because there is an assumption that
problems can be caused by products with some non-
standard properties, which are not very frequently
produced and therefore their support in the dataset
will probably be lower but its value of interest is
higher.
For this purpose, we have defined a new measure
called percentage change of support value (PCS). It
is defined as:
(
)
=
(
) −
(
)
(
)
(6)
where s
1
is the support value of frequent itemset
fi in the whole event log and s
2
is the support value
of the same frequent itemset in the dataset collected
when queues are significantly increased. The user
has to specify a value of minimum PCS value before
the process of mining frequent itemsets is started.
Some results of mining frequent itemsets with
various values of minimum PCS will be summarized
in the next section.
Use of Frequent Itemset Mining Techniques to Analyze Business Processes
277
5 EXPERIMENTS AND THEIR
RESULTS
As it was mentioned in Section 3, our dataset con-
sists of 15000 records and 17 attributes that describe
properties of products present at production ma-
chines at the critical path in time when some delay
occurred. The value of minimum PCS has been set
to 0.1. We recommend setting this value higher than
zero to ensure that the frequent itemset is really sig-
nificant with respect to delays in the business pro-
cess.
Next, we have to find a suitable minimum sup-
port value. The value must ensure that the count of
all frequent itemsets is high enough. In our first
experiment, we have set it to a value of 30%. The
count of frequent itemsets obtained by the Apriori
algorithm was 105, but almost all of them have been
deleted by our pruning phase because their support
in the whole dataset has not been high enough to
satisfy the condition of minimum PCS value.
Therefore we recommend setting the minimum
support value between 15% and 25%. The Table 1
shows the dependence of the frequent itemsets count
on the minimum support.
From Table 1 we can see that the reduction of
frequent itemsets with the PCS value is very strong.
Due to the very high time complexity of the algo-
rithm for the lowest minimum support value and a
small difference between counts of frequent itemsets
after pruning, we consider the value 0.2 as the opti-
mal value. But this optimal value can be slightly
different with use of other datasets.
Table 1: Counts of frequent itemsets.
Minimum
support
After
Apriori
After
pruning
0,15 1160 110
0,20 593 95
0,25 426 69
Regarding the values in the frequent itemsets ob-
tained by our method, their length does not usually
exceed 6 items. The most of them contain attributes
describing material, model names or edges of doors
produced in the manufacturing company. Only a
small number contains information about product’s
size or other numeric values. This can be caused by
the fact that most of products are usually produced
in some standard sizes and other sizes appear in data
very rarely.
The typical form of a frequent itemset obtained
in our dataset, which satisfies the minimum support
and minimum PCS is following:
{model_line = ‘STD 01’, edge_A = ‘C 0101’,
frame_type = ‘standard’}
This leads to a conclusion that delays in our
business process of door production are mainly af-
fected by some specific values of categorical attrib-
utes describing visual properties of doors and the
model name of a door.
To prove the correctness of these conclusions,
we have used the obtained frequent itemsets for a
simple classification. The main idea of this experi-
ment is that we try to predict long queue with use of
product parameters. If some count (denoted as c) of
products, parameters of which satisfy the frequent
itemsets obtained with support 0,2 (for this experi-
ment, we take only frequent itemsets with at least 2
items), these products are classified as “longer
queue”. The results of classification accuracy and its
dependence on the c value, is shown in the Table 2.
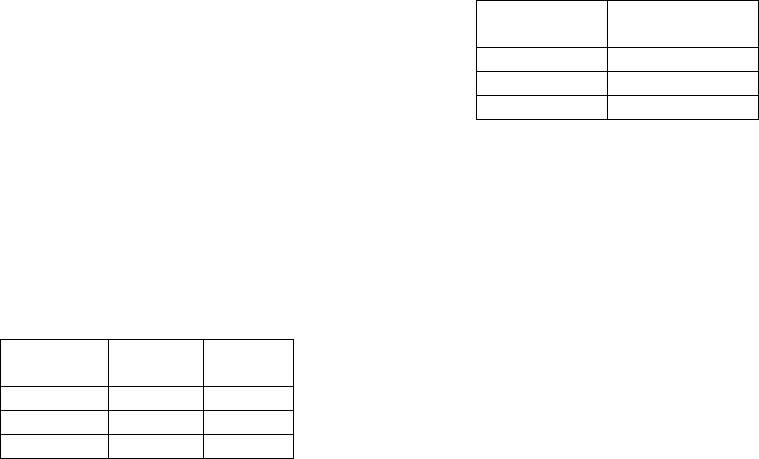
Table 2: Results of simple association-based classification.
Value of ‘c’
Accuracy of
classification
2 67%
4 88%
6 84%
We can see from the results that the longer
queues are often caused by more than one product.
This is probably caused by the fact that very similar
products are usually grouped together into batches
before they are produced. We can see that at least 4
products, parameters of which satisfy the frequent
itemsets cause delays in most cases.
Of course, not all delays in the process are
caused by specific product attributes. There are also
reasons like machine failures or big amount of prod-
ucts at the input. Therefore, our approach does not
cover all possible problems in the process. On the
other hand, our approach solves the problem, which
is typical for processes in manufacturing companies
and it can substantially help managers in planning of
their production.
One of the issues regarding presentation of asso-
ciation rules to managers is their visualization. For
this purpose, the simplex representation (Kenett and
Salini, 2010) can be used.
6 FUTURE RESEARCH
There are several possibilities to extend the results
described in this paper and use the frequent itemsets
for other tasks. The main focuses of our future re-
KDIR 2015 - 7th International Conference on Knowledge Discovery and Information Retrieval
278
search in this area are described in the next subsec-
tions.
6.1 Further Pre-Processing
In the moment, when a problem appears and data are
collected, information about a set of products (doors,
in our case) is collected. This can include for exam-
ple 50 products, which are similar very frequently.
Therefore there is a possibility to join these
products in one record (or more), which represents
the main properties of a set of products. Higher val-
ue of support must be assigned to this new record.
This step will make the mining simpler and therefore
it will probably increase the efficiency of the whole
frequent itemset mining process.
6.2 Association-based Classification
Predictions, recommendations, and dynamic optimi-
zations could be realized with use of some predictive
data mining technique, such as classification.
As it was proposed in (Liu et. al, 1999), (Bartik,
2007) and Section 5, a set of frequent itemset can be
used as a classifier. For each predefined class, a set
of frequent itemsets representing the records of that
class is discovered. Then, in the classification phase,
we are able to compare a new record, class of which
is not known, with frequent itemsets for each class
and determine the class according to frequent item-
sets, which correspond to the record most.
For example, if we separate the processing time
attribute into three categories (low, medium, high)
and discover frequent itemset for each of them, we
are able to predict the delay during the process and
warn workers before the problem happens.
6.3 Use of Sequential Patterns
Frequent itemsets can be also extended to take the
order of events before the delay into account. There-
fore, frequent itemsets could be substituted by se-
quential patterns. In our event log, the time infor-
mation is present for each event that is why the order
of products that have been processed by the produc-
ing machine is easily detectable.
Given a set of sequences (sets of records ordered
according to their time) and the support threshold,
the task is to find the complete set of frequent sub-
sequences. There are several algorithms proposed
for sequential pattern mining, mainly based on the
frequent itemset mining algorithms, for example the
AprioriAll algorithm or the PrefixScan algorithm
based on the FP-Growth method.
This can be helpful in the advanced analysis of
business processes to find some frequent sequences
of events leading to delays or other kinds of
knowledge about the manufacturing process.
7 CONCLUSIONS
In this paper, we have proposed the method for
analysis of data from event logs based on frequent
itemset mining. It can be used to analyze the reasons
of problems that can appear during the business
process. This can help the analyst to determine
products, which usually cause delays at production
machines in the manufacturing company.
Our experiments have been executed on the da-
taset consisting of products, which were processed
by the production machine before the problem ap-
peared. All attributes of these products have been
collected. Then, our task was to find sets of values,
which occur frequently in the processes, where some
problem causes the delay. The experiments showed
the necessity of a pruning phase, where the support
of an itemset in our dataset must be compared to its
support measured in the whole event log.
In our future works, except those mentioned in
Section 6, we have to find a way to detect records, in
which the execution time is measured wrongly. This
must be accomplished by a deep analysis of the data
and the business process itself.
ACKNOWLEDGEMENTS
This research was supported by the grants of MPO
Czech Republic TIP FR-TI3 039 and the European
Regional Development Fund in the IT4Innovations
Centre of Excellence project (CZ.1.05/1.1.00/
02.0070).
REFERENCES
Van der Aalst, W. M. P, Reijers, H. A., Weijters, A. J. M.
M., Van Dongen, B. F., Alves de Medeiros, A. K.,
Song, M., Verbeek, H. M. W. Business process min-
ing: An industrial application, In Information Systems,
Volume 32, Issue 5, July 2007, pp. 713-732, ISSN
0306-4379.
Van der Aalst, W. M. P., Weijters, A. J. M. M, 2004.
Process mining: a research agenda. In Computers in
Industry, Volume 53, Issue 3, Process / Workflow Min-
ing, pp. 231-244, ISSN 0166-3615,
Van der Aalst, W. M. P., 2011. Process Mining, Springer
Use of Frequent Itemset Mining Techniques to Analyze Business Processes
279
Berlin, Heidelberg, ISBN 978-3-642-19344-6.
Rozinat, A., Mans, R. S., Song, M., Van der Aalst, W. M.
P., 2009. Discovering simulation models. In Infor-
mation Systems, Volume 34, Issue 3, pp 305-327.
Wetzstein, B., Leitner, P., Rosenberg, F., Brandic, I.,
Dustdar, S., Leymann, F., 2009. Monitoring and Ana-
lyzing Influential Factors of Business Process Perfor-
mance. In Enterprise Distributed Object Computing
Conference, IEEE, pp. 141-150.
Polato, M., Sperduti, A., Burattin, A., de Leoni, M. 2014.
Data-Aware Remaining Time Prediction of Business
Process Instances. In 2014 International Joint Confer-
ence on Neural Networks, Beijing, China, pp. 816-
823.
Grigori, D., Casati, F., Dayal, U., Shan, M. C., 2001. Im-
proving Business Process Quality through Exception
Understanding, Prediction, and Prevention, In Pro-
ceedings of the 27th VLDB Conference, Rome, Italy.
Agrawal, R., Imielinski, T., Swami, A., 1993. Mining
Association Rules Between Sets of Items in Large Da-
tabases. In Proceedings of the ACM SIGMOD Confer-
ence on Management of Data, Washington, USA, pp.
207-216.
Agrawal, R., Srikant, R., 1994. Fast Algorithms for Mining
Association Rules in Large Databases. In Proceedings
of the 20th International Conference on Very Large Da-
ta Bases, San Francisco, USA, pp. 487—499.
Han, J., Pei, J., Yin, Y., 2000. Mining Frequent Patterns
without Candidate, In Proceedings of the ACM-
SIGMOD Conference on Management of Data
(SIGMOD'00), Dallas, TX, pp. 1-12.
Miller, R. J., Yang, Y., 1997. Association Rules over
Interval Data. In Proceedings of 1997 ACM SIGMOD,
Tucson, Arizona, USA, pp. 452-461.
Li, J., Shen, H., Topor, R., 1999. An Adaptive Method of
Numerical Attribute Merging for Quantitative Associ-
ation Rule Mining, In Proceedings of the 5th interna-
tional computer science conference (ICSC), Springer,
pp. 41 - 50.
Liu, B., Hsu, W., and Ma, Y., 1998. Integrating Classifica-
tion and Association Rule Mining. In ACM Confer-
ence on Knowledge Discovery and Data Mining, New
York, August 1998, pp. 80–86.
Bartik, V., 2009. Association Based Classification for
Relational Data and Its Use in Web Mining. In: IEEE
Symposium on Computational Intelligence and Data
Mining, Nashville, USA, pp. 252-258.
Xiong, H., Tan, P., Kumar, V. 2003. Mining strong affini-
ty association patterns in data sets with skewed sup-
port distribution. In Proceedings of the IEEE Interna-
tional Conference on Data Mining, Melbourne, Flori-
da, pp. 387-394.
Omiecinski, R. E. 2003. Alternative interest measures for
mining associations in databases. In IEEE Transac-
tions on Knowledge and Data Engineering, 15(1):57-
69, Jan/Feb 2003.
Kenett, R. S., Salini, S. 2010. Measures of Association
Applied to Operational Risks, in Operational Risk
Management, John Wiley & Sons, Ltd, Chichester,
UK.
KDIR 2015 - 7th International Conference on Knowledge Discovery and Information Retrieval
280
