Multi-Objective Optimization using Microgenetic Algorithm Applied
to the Placement of Remote and Manual Switches in Distribution
Networks
Helton do Nascimento Alves and Railson Severiano de Sousa
Department of Electrical Engineering, Federal Institute of Maranhão, São Luís, Brazil
Keywords: Costs, Power Distribution Networks, Load Importance, Multi-Objective Microgenetic Algorithm,
Reliability, Switch Placement.
Abstract: This paper presents a new formulation for placement of switches in distribution of electric power. An
approach for determination of the location of tie switches and section switches using a multi-objective
microgenetic algorithm is proposed. In the procedure, load importance, reliability index, remote or manual
controlled switch and investments costs are considered. The results are based on simulations in a 69-bus test
system presented and the results are compared to the solution given by others search techniques. This
comparison confirms the efficiency of the proposed method which makes it promising to solve complex
problems of tie switches and section switches placement in distribution feeders.
1 INTRODUCTION
In order to increase the reliability in overhead radial
electrical energy distribution systems, tie switches
and section switches are normally installed. Section
switches (SS) enable the isolation of failed
components and tie switches (TS) are used for
interconnection between feeders. In the planning
process of distribution of electric power, the
decision of the strategy to be adopted in the
allocation of switching devices is an important
aspect to be considered. Another important
characteristic of these devices should be considered
is their way of operation: manual controlled switch
(MCS) or remote controlled switch (RCS). When
MCS is used, a maintenance crew has to be
dispatched to the switch site to perform the fault
isolation and load restoration. RCS are usually
initiated at a control room, where the operation crew
performs the action of the switches. In this case, the
switching time considerably decreases, performing
the restoration of system capacity and reliability
with minimum outage and least expenditure of
manpower. Of course, RCS are more expensive and
they need a communication system to be activated.
However, the appearance of an increasing number of
new automation equipment and communication
technologies has provided economic viability to the
application of RCS in distribution networks
(Sperandio et. al., 2007). In last decades, the electric
utilities have introduced remote control schemes in
distribution networks to increase the reliability and
to have faster responses in contingencies (Allan and
Billinton, 1976), however, the cost involved in this
process is very high and the amount of investment
generally have budget constraints. So an alternative
that has been considered by electric utilities is the
gradual replacement at strategic points of MCS by
RCS.
The selection of the number and location of the
switches depends on factors such as reliability
indices, cost of switches, maintenance and operation
costs. Besides the cost and reliability, other factors
connected to the system can be taken into account to
define the allocation of switches, such as load
importance. The solution of this problem is
considered a very difficult task because it is a
combinatorial constrained problem described by a
nonlinear and nondifferential objective function.
Several intelligent algorithms have been used to
solve such a problem applying different heuristics.
Simulated Annealing (Billinton and Jonnavithula,
1996), Genetic algorithms (Levitin, Mazal-Tov and
Elmakis, 1995; Golestani and Tadayon, 2011;
Dezaki et. al., 2012), Fuzzy Logic (Teng and Lu,
2002), Ant Colony (Falaghi, Haghifam and Singh,
Alves, H. and Sousa, R..
Multi-Objective Optimization using Microgenetic Algorithm Applied to the Placement of Remote and Manual Switches in Distribution Networks.
In Proceedings of the 7th International Joint Conference on Computational Intelligence (IJCCI 2015) - Volume 1: ECTA, pages 269-278
ISBN: 978-989-758-157-1
Copyright
c
2015 by SCITEPRESS – Science and Technology Publications, Lda. All rights reserved
269
2009; Tippachon and Rerkpreedapong, 2009),
Particle Swarm Optimization (Golestani and
Tadayon, 2011; Moradi and Fotuhi-Firuzabad,
2008; Ziari et. al., 2009), Immune Algorithm (Chen
et. al., 2006) and Tabu Search (Toune, 1998)
In this paper, a Multi-Objective Microgenetic
Algorithm (MGA) is proposed and employed for the
allocation of SS and TS, in order to assist the
decision-taking during the planning of the
distribution system. Investments costs, reliability,
load importance and the use of MCS and/or RCS are
considered in the solution.
2 PROBLEM FORMULATION
2.1 Expert Knowledge
In distribution networks planning, the decision of the
strategy to be adopted in switch allocation is an
important aspect to be considered. This decision is
based on expert knowledge and influenced by
several parameters that determine the importance of
certain consumers and circuits. Technical and
economic aspects must be considered, seeking a
balance among: safe operation of the system, desired
level of reliability and investments.
In general, from the point of view of reliability, the
following criteria may be taken into account in the
switches allocation:
Minimizing the number of consumers affected by
an outage in the distribution system;
Restoration of service to critical loads;
Preference must be given to the installation in:
o circuits with high incidence of permanent
faults;
o points of interconnection between different
feeders;
o along the main section of the feeder, by
dividing the load into blocks. It should be
considered the voltage drop and maximum
demand allowed in the restoration of each
load block by a tie switch;
o points near to the beginning of circuits with
high loading;
o before and after points where there are loads
priority, with high continuity demanded;
o places easily accessible.
2.2 Distribution Feeder Model
In general, the distribution feeder model is
represented by sections with its respectively length,
cable type, origin node, end node and active and
reactive load. In order to evaluate the switches
placement problem is needed that the feeder model
also contains line’s failure rate, mean time for
restoring by switching and mean outage time of a
fault in the feeder. Every possible solution defined
by proposed algorithm, identify a group of sections
where the SS are allocated at their beginning.
Besides that, it was considered that a TS is
somewhere allocated downstream of the line section
containing a SS. It can happen that the same TS is
downstream of more than one SS. This occurs when
the sections that contain SS belong to the same set of
line sections that start at the substation and end on a
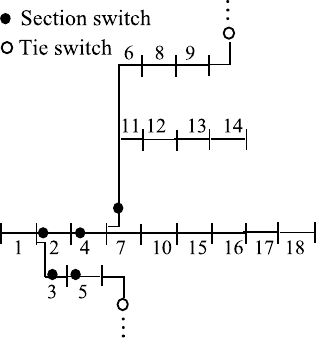
terminal node. In the Fig. 1 is showed an example
with 5 SS allocated but only 2 TS are necessary to
be allocated downstream of SS.
Figure 1: Example of tie switches allocated downstream of
section switches.
2.3 Expected Unsupplied Energy Due
to Power Outages and Costs
Considering MCS and RCS
Simultaneous Placement
Switches Placement in distribution networks can
reduce down time by isolating the faulted part of the
circuit after protection operation. Hence, the
upstream and downstream sections of the faulted
section can be restored. In this case, the outage time
and the expected unsupplied energy due to power
outages are reduced.
Manual and remote switches perform the same
function, changing only the operation form. Outage
time could be reduced by replacing manual by
remote switches. This reduction is caused to increase
reliability and reduce outage cost in network.
Moreover, most devices in automation system
resulting in more cost to the system..Simultaneously
ECTA 2015 - 7th International Conference on Evolutionary Computation Theory and Applications
270
placement of manual and remote controlled switches
decreases the total cost in life time. Due to these
facts, it is essential to develop appropriate strategies
to consider the gains and costs produced with the use
of remote switches.
Expected unsupplied energy due to power
outages can be calculated using Eq. (1). The first
part of Eq. (1) is the unsupplied energy up to
detection of the fault and switching and the last part
is the unsupplied energy after switching.
(
)
=
(
)
+
+(
−
)(
()
)
(1)
where, EUE(S) is the expected unsupplied energy
due to power outages considering switches installed
according S [kWh]; S is the set of section switches
and tie switches installed; Ns is the number of
sections in the feeder; Ltot is the total load in the
feeder [kW]; Li(S) is the load interrupted in the
feeder by a fault in section i after service restoration
performed with the operation of switches installed
according S [kW]; λi is the annual failure rate of
section i; Tswitch is the mean time for restoring by
switching (hours); and Toutage is the mean outage
time of a fault in the feeder.
When all switches installed in the feeder are
MCS, the time Tswitch(MCS) is considered in the
calculation of EUE. Likewise, when all switches
installed in the feeder are RCS, the time
Tswitch(RCS) is considered in the calculation of
EUE. When MCS and RCS are simultaneous
placement, the calculation of EUE will depend on
the procedures used for operation and maintenance
teams. In this case, in order to define EUE, the
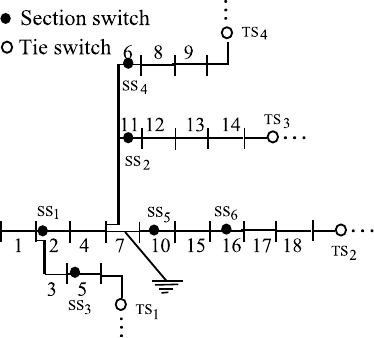
following switches are identified considering a fault
in line section i:
CLU(i): the closest upstream SS of the line
section i that isolate the fault from main source
(Fig. 2 - SS
1
);
CLD(i): the closest downstream SS of the line
section i that isolate the fault from an alternative
source. There may be more than one CLD
triggered to isolate distinct alternative sources
(Fig. 2 - SS
4
, SS
2
and SS
5
);
TST(i): TS triggered to restore part of the feeder
load through alternative source considering a
fault in line section i. There may be more than
one TST triggered for interconnection with
distinct alternative sources (Fig. 2 - TS
4
, TS
3
and
TS
2
);
CLD&TST(i): CLD(i) and TST(i) triggered to
restore part of the feeder load through alternative
source (Fig. 2 -SS
4
&TS
4
, SS
2
&TS
3
and
SS
5
&TS
2
). If both CLD(i) and TST(i) are RCS,
CLD&TST(i) is considered RCS, otherwise
CLD&TST(i) is considered MCS.
Figure 2: Feeder with switches installed considering a
fault in line section 7.
Considering the possible situations that can occur
for the simultaneous operation of manual and remote
controlled switches, the expected unsupplied power
can assume the following values during switches
operation:
Case 1: CLU(i) and/or some CLD&TST(i) are
RCS
o During time T
switch(RCS)
, L
tot
will be
disconnected by main breaker. In T
switch(RCS)
the RCS switches are triggered to restore L
x
through main source and/or alternative
source.
o Between T
switch(RCS)
and T
switch(MCS)
(when
MCS switches are triggered) the load L
1,i
=
L
tot
-L
x
will be disconnected for time
T
switch(MCS)
-T
switch(RCS)
. In T
switch(MCS)
the MCS
switches are triggered to restore L
y
.
o Between T
switch(MCS)
and T
outage
the load L
2,i
=
L
1,i
- L
y
will be disconnected for time T
outage
-
T
switch(MCS)
.
Case 2: CLU(i) and all CLD&TST(i) are MCS
o During time T
switch(MCS)
, L
tot
will be
disconnected by main breaker. In T
switch(MCS)
theMCS switches are triggered to restore L
y
through main source and/or alternative
source.
o Between T
switch(MCS)
and T
outage
the load L
2,i
=
L
tot
-L
y
will be disconnected for time T
outage
-
T
switch(MCS)
.
Multi-Objective Optimization using Microgenetic Algorithm Applied to the Placement of Remote and Manual Switches in Distribution
Networks
271

Case 3: CLU(i) and all CLD&TST(i) are RCS
o During time T
switch(RCS)
, L
tot
will be
disconnected by main breaker. In T
switch(RCS)
the RCS switches are triggered to restore L
x
through main source and/or alternative
source.
o Between T
switch(RCS)
and T
outage
the load L
1,i
=
L
tot
- L
x
will be disconnected for time T
outage
-
T
switch(RCS)
.
Based on these considerations, the expected
unsupplied energy due to power outages is
calculated in this work using Eq. (2):
(
)
=
(
∗
)
+
,
(
)
∗
(
−
)
∗
+(
,
(
)
∗(
−
)∗
)
(2)
Case 1: t1=Tswitch(RCS); LA,i= L1,i; LB,i=
L2,i; t2=Tswitch(MCS);
Case 2: t1=Tswitch(MCS); LA,i= 0; LB,i=L2,i;
t2=Tswitch(MCS);
Case 3: t1=Tswitch(RCS); LA,i=0; LB,i=L1,i;
t2=Tswitch(RCS);
where, Li(S) is the load interrupted in the feeder by a
fault in section i after service restoration performed
with the operation of switches installed according S
[kW]; Lx is the part of Ltot restored after RCS
switches are triggered; L1,i(S) is the load interrupted
in the feeder by a fault in section i after service
restoration performed with the operation of RCS
installed according S [kW]; Ly is the part of Ltot
restored after MCS switches are triggered; L2,i(S) is
the load interrupted in the feeder by a fault in section
i after service restoration performed with the
operation of MCS installed according S [kW];
Tswitch(MCS) is the mean time for restoring by
manual controlled switching (hours). It is considered
the same time for all line sections; and
Tswitch(RCS) is the mean time for restoring by
remote controlled switching (hours). It is considered
the same time for all line sections;
Costs associated with system expected outage to
customers due to supply outages and switches
placement can be calculated using Eq. (3).
()
)()(
1)()(
1
1
SCOSTSCOST
iSEUEkSCOST
MCSRCS
A
i
i
crese
+
++=
=
−
(3)
where, k
e
is the energy cost ($/kWh); A is the
planning horizon (years); i
cres
is the annual load
growth; COST
RCS
(S) and COST
MCS
(S) are the costs
of RCS and MCS installed according S, respectively,
all installed in the first year of planning. It includes
capital cost, installation cost and maintenance cost.
Many works only consider switches’ absolute
value in the cost evaluation (Assis et. al.,2012; Ziari
et. al., 2009; Villasanti et. al., 2008), although
utilities are already having costs with unsupplied
energy, so it should be included in cost equation.
Another difference on this formulation is related to
switch placement as a planning process, including
the planning horizon. This index is used as object
function in MGA in order to evaluate the costs.
2.4 Reliability Assessment
According to Billinton and Jonnavithula (1995),
reliability evaluation includes all the segments of an
electric power system in an overall assessment of
actual consumer load point reliability. The primary
reliability indices are the expected failure rate, the
average duration of failure and the annual
unavailability, at the customer load points.
Individual customer indices can also be aggregated
with the number of customers at each load point to
obtain system reliability indices. These indices are
the system average interruption frequency index
(SAIFI), the system average interruption duration
index (SAIDI), the customer average interruption
duration index (CAIDI) and the average service
availability index (ASAI). The most common
reliability indices used by electric utilities are SAIFI
and SAIDI. They are used to measure the impact of
power outages in terms of the number of
interruptions and interruption durations respectively
(Allan and Billinton, 1993). These indices can be
calculated for the overall system or for subsets of the
system depending on requirements for the
performance measures. These indices depend on the
circuit topology and location of switches. In order to
compare different switches allocation, is used
SAIDI, as follows:
tot
L
SEUE
SSAIDI
)(
)( =
(4)
where, SAIDI(S) is the system average
interruption duration index according S.
It’s common that researchers use SAIDI as a portion
of the EUE, however most of them, like Ziari et. al.,
(2009), Billinton and Jonnavithula (1996) and Chen
et. al. (2006) don’t evaluate the unsupplied energy
ECTA 2015 - 7th International Conference on Evolutionary Computation Theory and Applications
272

before switch’s triggered to simplify the analysis. So
this work performed a more realistic reliability
analysis, using this index as objective function of the
MGA.
2.5 Load Importance
Generally, the electric utilities need to prioritize the
service to some consumers due to its special
characteristics, such as: critical loads, big power
consumers, loads with high continuity demanded,
etc. The proposed algorithm has defined a new
variable called load importance (LI), which defines
the importance for the electric utility of each
consumer connected to the feeder. It establishes a
ranking between 0 and 1 (inclusive) for consumers
defined by the electric utility
In order to give preference to the switches
installation in sections situated before and after
priority loads is defined the priority index as
follows:
tot
Ns
i
i
LI
SLI
SPRIORI
=
=
1
)(
)(
(5)
where, LI
tot
is the sum of all LI defined to the feeder;
LI
i
(S) is the sum of LI of all consumers not
interrupted by a fault in section i after service
restoration performed with the operation of switches
installed according S; and PRIORI(S) is the priority
index considering the set S of section switches and
tie switches installed.
This index is used as object function in MGA in
order to evaluate the load importance. Most of the
paper in this field, e. g. Assis et. al. (2012) Falaghi,
Haghifam and Singh (2009) Tippachon and
Rerkpreedapong (2009), Golestani and Tadayon,
(2011) and Ziari et. al., (2009), don’t include this
evaluation on it solution.
3 SOLUTION
In order to find an optimal allocation of switching
devices in distribution networks based on load
priority, reliability, costs, and considering the
simultaneous allocation of MCS and RCS, a multi-
objective algorithm is proposed. MGA is used in the
solution. The simultaneous allocation of MCS and
RCS is considered to calculate reliability index and
costs. Load importance is defined by electric utility.
A weight function based on reliability index, costs
and load importance is used as object function.
3.1 Microgenetic Algorithms
Genetic algorithms are simple, robust, flexible, and
able to find the global optimal solution. They are
especially useful in finding solution to problems for
which other optimization techniques encounter
difficulties (Goldberg, 1989). A basic genetic
algorithm is constituted by a random creation of an
initial population and a cycle of three stages,
namely:
1. evaluation of each chromosome;
2. chromosomes selection for reproduction;
3. genetic manipulation to create a new population,
which includes crossover and mutation.
Each time, this cycle is completed, it is said that a
generation has occurred.
The disadvantage of genetic algorithms is the
high processing time associated. That is due to their
evolutionary concept, based on random processes
that make the algorithm quite slow. However,
different methods for reducing processing time have
already been proposed, such as more appropriate
choice of solution coding and reduction of search
space using the specialist knowledge. One
alternative method known as microgenetic
algorithms, whose processing time is considerably
smaller, is shown in (Delfanti et. al., 2000;
Chakravarty, Mittra and William, 2001).
According to Souza, Alves and Ferreira (2004), most
of the genetic algorithms produce poor results when
populations are small, because insufficient
information is processed about the problem and, as a
consequence, premature convergence to a local
optimum occurs. Population size generally varies
from 30 to 300 individuals. In contrast, microgenetic
algorithms explore the possibility to work with small
populations (from five to 20 individuals usually) in
order to reduce the processing time. From a genetic
point of view, it is known that frequent
reproductions inside a small population may
disseminate hereditary diseases rarely found in large
populations. Therefore, small populations can act as
natural laboratories where desirable genetic
characteristics quickly can emerge. In microgenetic
algorithms, mutations are unnecessary because after
a certain number of generations, the best
chromosome is maintained and the rest are
substituted by randomly generated ones. On the
other hand, it requires adoption of some preventive
strategy against loss of diversity in population.
Basically, two mechanisms are used to prevent
loss of diversity in population (Ongsakul and
Tippayachai, 2002). First, the individuals are
Multi-Objective Optimization using Microgenetic Algorithm Applied to the Placement of Remote and Manual Switches in Distribution
Networks
273

selected (only once) for a binary tournament. In this
way, not only do the most developed individuals
have an opportunity to participate in the
reproduction but all of them do. The second
mechanism is to insert new individuals each time the
population becomes homogeneous. The best
individual is kept and inserted into a new population
randomly created. When it occurs, a migration has
occurred. If the same individual is the best one along
a certain number of migrations, the algorithm stops
and this individual represents the solution.
3.2 Multi-Objective Algorithm
Multi-objective formulations are realistic models for
many complex engineering optimization problems.
In many real-life problems, there are typically
multiple conflicting objectives that need to be
evaluated in making decisions. Optimizing a
particular solution with respect to a single objective
can result in unacceptable results with respect to the
other objectives. A reasonable solution to a multi-
objective problem is to investigate a set of solutions,
each of which satisfies the objectives at an
acceptable level without being dominated by any
other solution. Typically, there is not a unique
optimal solution for such problems and it is
necessary to use decision maker’s preferences to
differentiate between solutions.
There are two general approaches to multiple-
objective optimization (Deb, 2001). One is to
combine the individual objective functions into a
single composite function. Determination of a single
objective is possible with methods such as utility
theory and weighted sum method. The second
general approach is to determine an entire Pareto
optimal solution set or a representative subset. A
Pareto optimal set is a set of solutions that are
nondominated with respect to each other. In this
paper is used the weighted sum method due to its
simplicity and its characteristic of being a priori
approach since the user is expected to provide the
weighting factors. Assign weighting factors for each
criterion used will reflect its relative importance to
the decision. The weighted sum method combines
the weighting factors and scores for each criterion to
derive an overall value.
In this paper, the solution method will find an
alternative for locating switches devices based on a
set of criteria, in which load importance, reliability,
costs and simultaneous manual and remote
controlled switches are considered. Regarding the
criteria adopted in this paper can be affirmed:
High values of PRIORI(S) increase the chances
of S to be chosen for allocation.
High values of SAIDI(S) decrease the chances of
S to be chosen for allocation.
High values of COST(S) decrease the chances of
S to be chosen for allocation.
For all criteria have the same behavior and the
objective function to be minimized, the portion of
the objective function relative to PRIORI(S) is
calculated as shown in (6).This formulation ensures
that the lowest value of PRIORI(S) corresponds to
the value 1 and other values of PRIORI(S)
correspond to values less than 1.The values for the
weighting factors employed are defined according to
(7) and they reflect the relative importance for each
criterion. The proposed algorithm normalizes each
criterion by its maximum value at a given
population. This procedure is performed for each
new generation.
(
)
=
1−
(
)
−()
()
+
()
()
+
()
()
(6)
+
+
=1
(7)
where, w
1
is weighting factor for PRIORI; w
2
is
weighting factor for SAIDI; w
3
is weighting factor
for COST; and OF is the objective function.
3.3 Proposed Algorithm
From studies and experiments with several methods
reported in the literature, a MGA is proposed for
solving the tie switches and section switches
placement problem. The MGA uses load
importance, costs and a reliability index as criteria to
find the optimal solution. In order to calculate costs
and reliability index is considered the simultaneous
allocation of MCS and RCS. The proposed
algorithm consists of the following steps:
1) Define the number of section switches (ns) and
maximum number of tie switches (nt) that can
be used to allocation;
2) Define the number of RCS (nr) used to
allocation;
3) Define the weighting factorfor each criterion;
4) Load importance (LI) variable is defined by the
system manager for each consumer connected
to the feeder;
5) Adopt OF expressed in Eq. (6) as objective
function. The MGA is applied to minimize OF;
ECTA 2015 - 7th International Conference on Evolutionary Computation Theory and Applications
274
6) Randomly create a initial population p with
ns sectionalizers allocated in each
cromosome and go to step 8;
7) Randomly create an population p-1 and add
to it the best chromosome from the last
migration;
8) Determine the objective function of each
chromosome;
9) Choose chromosomes from the present
population using the tournament method
based on crossover rate c. Make crossover
operation using pairs of chromosomes from
this subgroup, determining new
chromosomes;
10) Calculate the objective function value of the
new chromosomes;
11) Replace the present population for a p size
new population compost of the best
chromosomes from the present population
and the new chromosomes;
12) Repeat steps 9 to 11 until the population
reaches an homogeneous degree h previously
chosen or for g generations;
13) Find the best chromosome, keep it, and
discard the others.
14) Repeat steps 7 to 13 until the best individual
does not change for m migrations.
The homogeneous degree may be adjusted
between 90% and 99%. For instance, if this highest
degree is chosen, it means that the population is
considered homogeneous when all individuals have
at least 99% of their genes identical to the genes of
the most adapted individual.
Numbers c, g, h, m and p are previously
specified. The tournament method is a process in
which a population subgroup is randomly formed
and from which the most well-adapted individual is
elected for crossover.
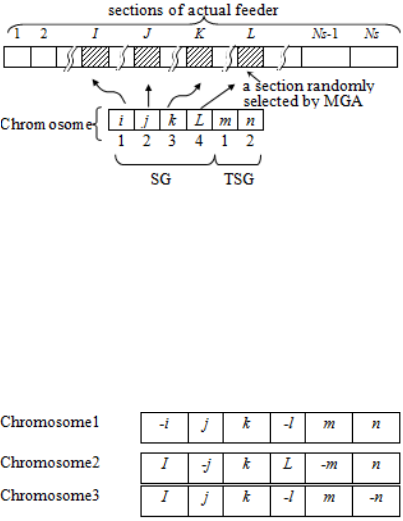
In this work, the chromosome is a vector divided
in two parts:
1. Section Switches Group (SSG): the first ns
positions are the sections in the feeder where SS
are installed. Each position is associated to one
of the sections in the feeder.
2. Tie Switch Group (TSG): The last nt positions
are the sections where tie switches are installed.
These sections are somewhere downstream of the
sections appointed by first nt positions. They are
defined based on SSG.
For instance, considering a feeder with Ns
sections, ns=4 and nt=2, a possible chromosome is
shown in Fig. 3. The sections i, j, k and l are
randomly chosen to receive SS, and the section m
and n are defined based on sections i, j, k and l to
receive TS. Only the genes from SSG are randomly
chosen and copied from parents to their offspring.
TSG is always defined based on SSG.
Figure 3: Genetics information stored in chromosome is
pointed to section array.
The sections represented in a chromosome that
contain remote controlled switch are identified by
negative sign. For instance, considering the example
shown in Fig. 3 and nr=2 (number of RCS), any of
the chromosomes below represent one possible
solution.
Figure 4: Example of 3 different chromosomes with the
same sections.
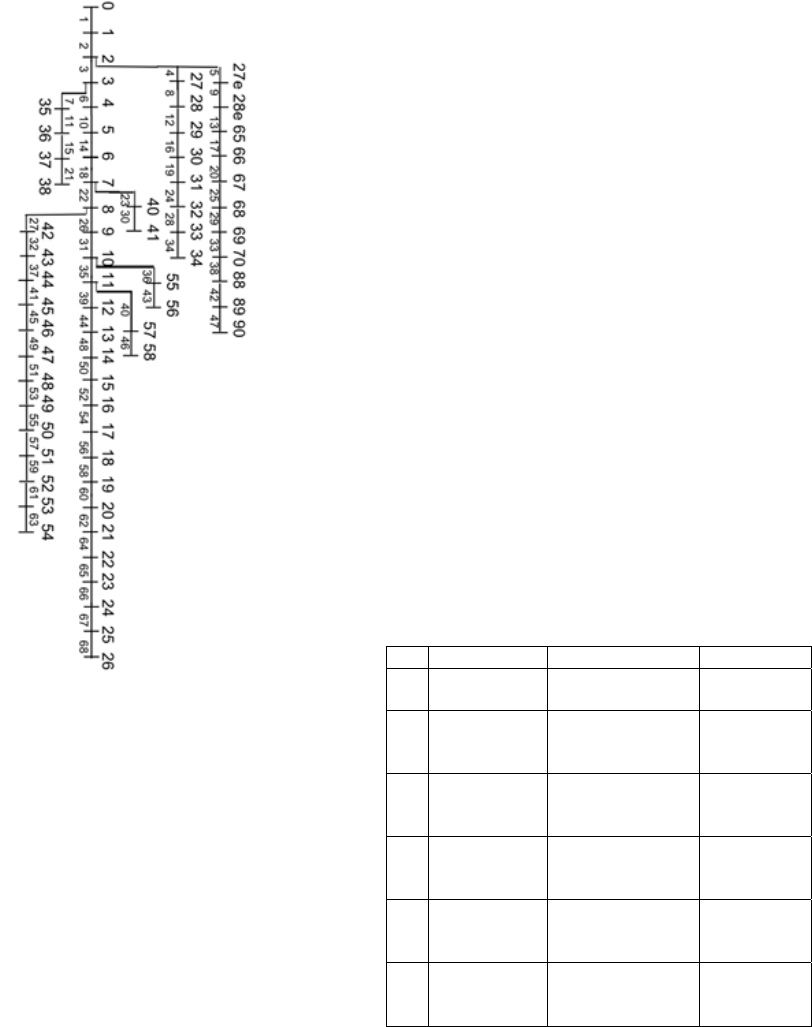
4 APPLICATION
The proposed algorithm is implemented using
MATLAB® on a 1GHz AMD Dual core personal
computer. In this paper, the test system selected to
illustrate the performance of the algorithm is a 69-
node radial distribution system which includes one
main feeder and seven laterals as shown in Fig. 4.
The system and load data can be referred to Baran
and Wu (1989). The line voltage in substation is
12.66 kV. The mean time for restoring by RCS used
is 3 minutes and by MCS is 48.8 minutes. The mean
outage time of a fault in the feeder is 153 minutes. It
is considered the cost of $ 5,000.00 for MCS and $
10,000.00 for RCS. The annual load growth used is
5% for a ten-year planning horizon. The cost of
energy considered is $ 0.14 / kWh. In the proposed
algorithm, PRIORI is calculated based on LI
established by the system manager. In order to
evaluate the effect of this variable in the solution, it
is considered that all consumers have LI = 0.1,
except a consumer randomly chosen with LI = 1.0
(section 20 is chosen). Table 1 shows the annual
Multi-Objective Optimization using Microgenetic Algorithm Applied to the Placement of Remote and Manual Switches in Distribution
Networks
275
failure rate per section adopted in this application.
The weighting factor of each criteria used in this
application is defined to four different groups: equal
weighting factor for each criteria (group 1 - w1=w2=
w3=1/3), a greater weighting factor for PRIORI
(group 2 - w1=0.8,w2=0.1 and w3=0.1), a greater
weighting factor for SAIDI (group 3 - w1=0.1,
w2=0.8 and w3=0.1) and a greater weighting factor
for COSTS (group 4 - w1=0.1, w2=0.1 and w3=0.8).
Figure 5: The diagram of a 69-bus test system array.
The MGA uses p=20, c=80%, g=200, m=5 and
h=95%. It is considered the allocation of 10-
sectionalizers (ns) and a maximum of 10 tie switches
(nt). Regarding the amount of remote controlled
switching allocated are considered three
configurations: all switches allocated are MCS (C1),
at least 50% of the switches allocated are RCS (C2)
and all switches allocated are RCS (C3).
The 30 executions’ means of the proposed
algorithm are presented in Table 2. The execution
time of MGA is about five minutes. In solutions 1, 2
and 3 the weighting factors used are identical (group
1) but the number of RCS installed is modified
(configurations C1, C2 and C3) in order to analyze
the effect on some parameters related to the feeder
when these changes occur. In solutions 3, 4, 5 and 6
all switches installed are RCS (C3) but the
weighting factors used are different in order to
analyze the effect on some parameters related to the
feeder when these changes occur.
Comparing the results of solutions 1, 2 and 3
verify that the set of sections selected by MGA
differs in all them. This shows that the type of
switch used (RCS or MCS) influences the choice of
the section for allocation. As expected, the larger the
number of RCS installed, the better are the values
obtained for SAIDI. Comparing solutions 1 and 3
(all MCS and all RCS respectively) the costs are
close for a ten-year planning horizon although the
investment cost for RCS is double of investment
cost adopted in this work for MCS. This occurs
because the larger the number of RCS installed, the
lower is the value of EUE. Solution 2 has the lowest
cost because it has 7-RCS installed which reduces
the value of EUE compared to solution 1 and 8-MCS
installed which reduces the investment cost
compared to solution 3.
Comparing solutions 3, 4, 5 and 6 verify that the
set of sections selected by MGA differs in all them.
This is due to the different weighting factors
adopted. Only solution 3(in sections 9 and 47) and
solution 4 (in sections 13, 25 and 47) allocate
switches in the lateral that is section 20 (the highest
LI in the feeder). This is due to the considerable
value of w1used in these solutions in relation to the
others weighting factors. Solution 4 (the highest
value of w1) allocates SS before and after section 20
(sections 13 and 25) where there are loads priority,
Table 1: Switches allocated by the proposed algorithm.
No. Configuration Section Switches Tie Switches
1 Group 1 – C
1
3;4;15;18;27;
31;39;53;59;60
21;34;63;68
2 Group 1 – C
2
-3;-6;-26;-27;
50;51;53;-54;
55;-57
-63;68
3 Group 1 – C
3
-6;-9;-11;-26;
-35;-37;-39;-55;
-56;-57
21;-47;-63;-68
4 Group 2 – C
3
-3;-6;-13;-25;
-27;-31;-39;-54;
-55;-57
-47;-63;-68
5 Group 3 – C
3
-9;-11;-14;-21;
-31;-32;-39;-55;
-56;-57
21;-45;-63;-68
6 Group 4 – C
3
-3;-10;-26;-32;
-35;-44;-54;
-55;-57;-62
-63;-68
ECTA 2015 - 7th International Conference on Evolutionary Computation Theory and Applications
276

demanding high continuity. As expected, solution 5
(the highest value of w2) shows the best value for
SAIDI and solution 6 (the highest value of w3) the
best value for the costs.
These results confirm that the multi-objective
algorithm proposed achieves efficient solutions
considering simultaneously a different number of
RCS for allocation and different weighting factors
for criteria adopted.
Table 2: Reliability and Costs’ results.
No. Configuration
SAIDI
(h)
EUE
(MWh)
COSTS
(10
6
$)
1 Group 1 – C
1
12.78 48.59 0.15
2 Group 1 – C
2
4.51 17.14 0.13
3 Group 1 – C
3
2.79 10.61 0.16
4 Group 2 – C
3
3.27 12.44 0.15
5 Group 3 – C
3
2.69 10.24 0.16
6 Group 4 – C
3
3.36 12.77 0.14
5 CONCLUSIONS
This study presented a method for allocating of
section switches and tie switches in radial
distribution networks based on a multi-objective
microgenetic algorithm. This algorithm is applied to
determine the advantage of having a switch installed
in a particular section or not considering load
importance, reliability index, remote or manual
controlled switch and investments costs. The main
stages and characteristics of MGA and its
application in the proposed problem were described.
In order to illustrate the performance of the
algorithm, several experiments using a real
distribution system were conducted. This work did
not consider the possible additional costs for the
electric utility associated with the interruption of an
important load. Solutions 1, 2 and 3 indicated a
considerable effect of number of RCS installed on
reliability index and investments costs. Solutions 3,
4, 5 and 6 indicated a considerable effect of
weighting factors on the problem objectives. These
results showed complete adaptation of algorithm to
different requirements that are determined by the
planner who can adapt the value of weighting factors
according to the technical and economic conditions.
The proposed algorithm has shown excellent results
making this tool a great potential to assist in
planning of distribution networks and also to make
improvements in existing networks.
ACKNOWLEDGEMENTS
The authors thank the IFMA (Federal Institute of
Marannhão) and FAPEMA (Foundation for
Research and Scientific and Technological
Development of Maranhão) for the support to the
development of this article.
REFERENCES
Allan R, Billinton RN (1993) Power system reliability and
its assessment: part III, distribution systems and
economic considerations, Power Eng J 7: 185–192.
Allan RN, Billinton RN, Oliveira MF (1976) An efficient
algorithm for deducing the minimal cuts & reliability
indices of a generalized network configuration. IEEE
Trans Reliab 25: 226-233.
Assis, L, González, JF, Usberti, F, Lyra, Cavellucci, C,
Von Zuben, F (2012) Algoritmo Memetico para
Alocação ótima de chaves manuais e telecomandadas
em um sistema de distribuição de energia elétrica.
Congreso Latino-Iberoamericano de investigación
Operativa. CLAIO.
Baran ME, Wu FF (1989) Optimal capacitor placement on
radial distribution system. IEEE Trans Power Deliv 4:
725-734.
Billinton RN, Jonnavithula S (1995) A test system for
teaching overall power system reliability assessment.
IEEE Trans Power Syst 11: 1670-1676.
Billinton RN, Jonnavithula S (1996) Optimal sectionalizer
allocation in electric distribution systems, IEEE Trans
Power Deliv 11: 1646-1651.
Chakravarty S, Mittra R, Williams NR (2001) On the
application of the microgenetic algorithm to the design
of broad-band microwave absorbers comprising
frequency-selective surfaces embedded in multilayered
dielectric media. IEEE Trans Microwave Theory Tech
49: 1050–1059.
Chen CS, Lin CH, Chuang HJ, Li CS, Huang MY, Huang
CW (2006) Optimal placement of line switches for
distribution automation systems using immune
algorithm. IEEE Trans Power Syst 21: 1209–1217.
Deb K. Multi-objective Optimization Using Evolutionary
Algorithms, Wiley, 2001.
Delfanti M, Granelli PG, Marannino P, Montagna M
(2000) Optimal capacitor placement using
deterministic and genetic algorithms. IEEE Trans
Power Syst, 15: 1041–1046.
Dezaki HH, Abyaneh HA, Agheli A, Mazlumi K (2012)
Optimized switch allocation to improve the restoration
energy in distribution systems. J Electrical Eng 63: 47-
52.
Falaghi H, Haghifam MR, Singh C (2009) Ant colony
optimization-based method for placement of
sectionalizing switches in distribution networks using
a fuzzy multiobjective approach. IEEE Trans Power
Deliv 24: 268–276.
Multi-Objective Optimization using Microgenetic Algorithm Applied to the Placement of Remote and Manual Switches in Distribution
Networks
277
Goldberg DE (1989) Genetic algorithms in search,
optimization and machine learning. Reading, MA:
Addison-Wesley.
Golestani S, Tadayon M (2011) Optimal switch placement
in distribution power system using linear fragmented
particle swarm optimization algorithm preprocessed
by GA. In: Energy Market (EEM), 8th International
Conference on the European, Zagreb, Republic of
Croatia, pp 537 – 542.
Levitin G, Mazal-Tov S, Elmakis D (1995) Genetic
algorithm for optimal sectionalizing in radial
distribution systems with alternative supply. Elsevier
Electr Power Syst Res 35: 149-155.
Moradi A, Fotuhi-Firuzabad M (2008) Optimal switch
placement in distribution systems using trinary particle
swarm optimization algorithm. IEEE Trans Power
Deliv 23: 271–279.
Ongsakul W, Tippayachai J (2002) Micro genetic
algorithm based on migration and merit order loading
solutions to the constrained economic dispatch
problems. Int J Electr Power & Energy Syst, 24: 223–
231.
Rural Utilities Service (2012) Design guide for
sectionalizing distribution lines. BULLETIN 1724E-
102 2012. http://www.rurdev.usda.gov/Support
Documents/UEP_Bulletin_1724E-102.pdf.. Accessed
26 september 2013.
Silva LGW, Pereira RAF, Mantovani JRS (2004)
Optimized allocation of sectionalizing switches and
control and protection devices for reliability indices
improvement in distribution systems. In Proc.
IEEE/PES &D Latin America, São Paulo, Brazil, pp
51-56.
Souza BA, Alves HN, Ferreira HA (2004) Microgenetic
algorithms and fuzzy logic applied to the optimal
placement of capacitor banks in distribution networks.
IEEE Trans Power Deliv 19:942-947.
Sperandio M, Aranha Neto EAC, Sica ET, Trevisan F,
Camargo CCB, Coelho J, Ramos R (2007)
Automation planning of loop controlled distribution
feeders. In: 2nd International Conference on Electrical
Engineering CEE’07, Coimbra, Portugal.
Teng J, Lu C (2002) Feeder switch relocation for customer
interruption costs minimization. IEEE Trans Power
Deliv 17: 254-259.
Tippachon W, Rerkpreedapong D (2009) Multiobjective
optimal placement of switches and protective devices
in electric power distribution systems using ant colony
optimization. Elsevier Electr Power Syst Res 79:
1171-1178.
Toune S, Fudo H, Gengi T, Fukuyama Y, Nakanishi Y
(1998) A reactive Tabu Search for service restoration
in electric power distribution systems. In: IEEE
International Conference on Evolutionary Computa-
tion, Anchorage-Alaska, pp 1-7.
Villasanti, A.; Baran, B.; Gardel, P. (2008) Multiobjective
allocation of remotely controlled switches in an
electric distribution power system. In: IEEE
Transmission and Distribution Conference and
Exposition: Latin America, 2008, IEEE/PES, pp.1-7.
Ziari I, Ledwich G, Wishart M, Ghosh A, Dewadasa M
(2009) Optimal allocation of a cross-connection and
sectionalizers in distribution systems. TENCON IEEE
Region 10 Conference, pp:1-5.
ECTA 2015 - 7th International Conference on Evolutionary Computation Theory and Applications
278
