Measuring Respiration and Heart Rate using Two Acceleration Sensors
on a Fully Embedded Platform
Johan Vertens
1
, Fabian Fischer
1
, Christian Heyde
2
, Fabian Hoeflinger
1
, Rui Zhang
1
,
Leonhard Reindl
1
and Albert Gollhofer
2
1
EMP, Albert-Ludwigs-University, Georges-Koehler-Allee 106, 79110 Freiburg, Germany
2
Institut fuer Sport und Sportwissenschaft, Albert-Ludwigs-University, Schwarzwaldstraße 175, 79117 Freiburg, Germany
Keywords:
Respiration Rate, Heart Rate, Acceleration Sensor, Optimization, Bluetooth, Wearable Device.
Abstract:
We present a novel system which measures the respiration rate using two three-axis accelerometers strapped
to the chest and the back of a person. Respiration and heart rate are used as a measurement to determine
an athlete’s fitness level during the exercise phase. Common respiration rate measurement methods require
devices which are mostly stationary or at least clunky and uncomfortable to wear for an extended period of
time.
By using techniques such as differential measurement, pre-measurement optimization, adaptive filtering and
peak detection we are able to obtain respiration rate even when the athlete is running fast. Our system is
low-cost, small, and, by using a digital signal processor, fully capable of processing the data in an online way.
Results are compared with a reference spirometer and have shown a very low normalized root mean square
error (NRMSE) down to 1.42 %. Additionally, the heart rate of an athlete can be measured with the same
sensor setup and similar methods.
1 INTRODUCTION
Ambulant and user friendly methods to derive an indi-
vidual’s physiological demand during rest and phys-
ical exercise are currently based on measurements of
heart rate. However, heart rate mainly provides in-
formation about the cardiac loading rather than infor-
mation about the metabolic strain - as for instance by
certain stress thresholds derived from changes in the
blood lactate concentration or the respiratory gas ex-
change (Wasserman, 2012). Thus, the accurate as-
sessment of an individual’s aerobic fitness level as
well as the precise determination of an individual’s
intensity level for aerobic exercise are feasible only
using a laboratory setting. The examination of the res-
piratory gas exchange usually requires clunky face-
masks or mouthpieces which are uncomfortable to
wear for an extended period of time to derive the
needed measurements at the orifice.
Interestingly, there are some promising attempts
demonstrating that simply the observation of changes
in the respiration rate may facilitate stress threshold
detection (Onorati et al., 2012; Carey et al., 2005).
Deriving respiration rate during rest and exercise does
not necessarily need the measurement at the orifice
but can alternatively be derived from thoracic surface
displacements (Heyde et al., 2014). Furthermore, the
measurement of respiration rate solely needs the pre-
cise detection of the onsets of inspiration and expi-
ration within a sinusoidal like data pattern. There-
fore, it is hypothesized that common sensors that
are surrounding the whole thorax (i.e. inductance
plethysmographs) might be replaceable by smaller ac-
celerometers which are able to register breathing in-
duced thorax extension. In this pilot study, respiration
rate values derived by means of an dual accelerome-
ter system mounted at the chest and a gold standard
flowmeter placed at the orifice were compared. Addi-
tionally, the system was used to simultaneously derive
heart rate values in a similar way.
2 STATE OF THE ART
Currently, the respiration information can be mea-
sured by using many different sensor techniques. Our
focus is to use inertial sensors for detecting the respi-
ration rate. Inertial sensors are already used for dif-
ferent applications (Simon et al., 2015; Hoeflinger
Vertens, J., Fischer, F., Heyde, C., Hoeflinger, F., Zhang, R., Reindl, L. and Gollhofer, A..
Measuring Respiration and Heart Rate using Two Acceleration Sensors on a Fully Embedded Platform.
In Proceedings of the 3rd International Congress on Sport Sciences Research and Technology Support (icSPORTS 2015), pages 15-23
ISBN: 978-989-758-159-5
Copyright
c
2015 by SCITEPRESS – Science and Technology Publications, Lda. All rights reserved
15

et al., 2012a; Hoeflinger et al., 2011). In applica-
tions for human tracking they are already integrated
into shoes or clothes (Hoeflinger et al., 2012b; Zhang
et al., 2013) for detecting the body movement and
measuring the path. Inertial sensors have been in-
creasingly used in recent years to derive respiration
rate. Accelerometers worn on the torso are capable
of measuring inclination and angular changes during
respiration. Afterwards, the respiration rate can be
estimated using digital signal processing. Liu et al.
present a method using adaptive band-pass filter and
principal component analysis (PCA) to derive the res-
piratory rate from acceleration data (Liu et al., 2011).
The method was capable of offering dynamic respi-
ration rate estimation during various body activities
such as sitting, walking, running, and sleeping. Tewel
presents a new device for detection of apnoea, con-
sisting of a three-axis MEMS accelerometer with dig-
ital output, microprocessor and some alarm instru-
ments (Tewel, 2010). A wireless portable monitoring
system to measure a user’s respiratory airflow, blood
oxygen saturation, and body posture is proposed in
(Cao et al., 2012). The monitoring system consists of
two sensor nodes including a hot-film flow sensor, tri-
axis accelerometer and oximeter. Phan et al. used an
accelerometer to measure cardio-respiratory activity
(Phan et al., 2008). The acquisition is realized in dif-
ferent modes: normal, apnoea, deep breathing or af-
ter exhaustion and also in different postures: vertical
(sitting, standing) or horizontal (lying down). Yoon et
al. suggest a method to improve the fusion of an ac-
celerometer and a gyroscope by using a Kalman filter
to produce a higher quality respiration signal (Yoon
et al., 2014). The authors acclaim that the acceleration
signal due to the movement can be easily removed
because the frequency of movement acceleration is
much higher than the frequency of respiration. How-
ever, it was found not true during our first attempt. Jin
et al. proposed and analyzed three different methods
to extract a single respiratory signal from the tri-axial
data (Jin et al., 2009). The system is evaluated us-
ing simulated data from the most common postures,
such as lying and sitting, as well as real data collected
from five subjects. Bates et al. use a movement de-
tection method to classify periods in which the patient
is static and breathing signals can be observed accu-
rately (Bates et al., 2010).
3 METHODS AND MATERIALS
3.1 Measurement Principle
With every breath a human takes his chest expands.
We use two three-axis accelerometers centered at the
front and the back of the torso of a person to measure
the acceleration and inclination caused by the expan-
sion of the chest. Both sensors are strapped to the
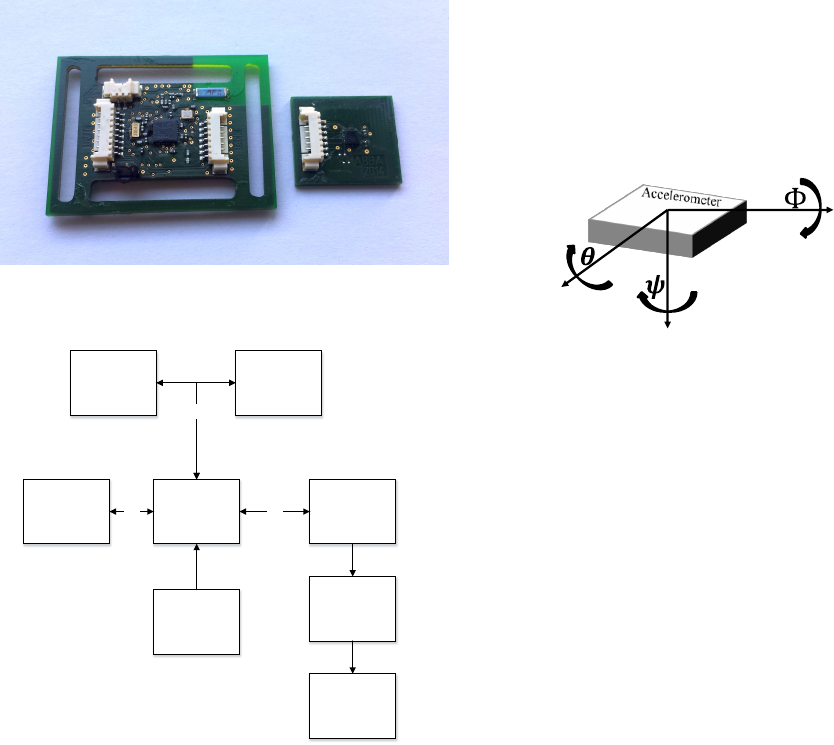
torso with a flexible belt. Figure 1 shows the setup.
Figure 1: Setup of the two sensors (red). Translational and
rotational directions are shown as arrows.
By using two sensors we can apply the method of
differential measurement of the acceleration a, i.e.
a = a
front
−a
back
. If a perfect alignment of the coordi-
nate systems of both sensors is achieved, this method
eliminates acceleration measurements introduced by
translational movement which do not belong to the
respiration.
After transformation and filtering of the data we
detect the peaks of every amplitude and calculate the
respiration and heart rate from the time difference be-
tween two adjacent peaks.
3.2 Hardware
For measuring and processing the acceleration data
we designed two printed circuit boards which contain
all the relevant digital blocks. The front pcb, which
is mounted on the chest, contains the primary com-
ponents as a STM32F4 microprocessor with an on-
board DSP, a low energy bluetooth chip, a voltage reg-
ulator, flash memory and a LIS3DSH accelerometer.
The back pcb holds the second LIS3DSH accelerom-
eter and a port for connecting the two modules with
each other. We have selected the sensors due to their
very high sensitivities of 0.06 mg per bit in the mea-
surement range ±2.0 g with 16-bit data output. All
communication between the digital parts is realized
through SPI interface. Energy is delivered to the sys-
tem via a small lithium battery. Communication to a
PC or to a mobile device can be established via a se-
rial or the bluetooth 4.0 connection. Since we have
a very powerful setup we are able to perform all the
signal processing onboard.
icSPORTS 2015 - International Congress on Sport Sciences Research and Technology Support
16
The size of the front pcb is 4.5 x 3.5 cm and con-
tains also the mounting tabs for the chest strap while
the back pcb is 2.3 x 2.0 cm. The hardware modules
are shown in figure 2 and as a block diagram in figure
3.
Figure 2: Hardware module for chest-mounting (left) and
for back-mounting (right).
Cortex F4 with
DSP
Flash memory
16MB
3 Axis
Accelerometer
LIS3DSH
(Front)
Bluetooth Low
Energy Chip
Bluenrg
Matching
Network
3 Axis
Accelerometer
LIS3DSH
(Back)
Antenna
3.3V Voltage
Regulator
SPI
SPI SPI
Figure 3: Block diagram of the hardware setup with the
STM32F4 microprocessor, the two LIS3DSH accelerome-
ters, the flash memory, the voltage regulator and the blue-
tooth chip with matching network and antenna. All commu-
nication between the digital parts is realized through SPI.
3.3 Calibration and Optimization
Slippage or unprecise mounting of the chest strap
causes misalignment of the coordinate systems be-
tween the front sensor and the back sensor. Since we
need perfect or at least very good alignment to gen-
erate the differential signal, we have developed a cal-
ibration routine for this purpose. In the case of mis-
alignment, the differential measurement is not reliable
any more. This is caused by accelerations which ap-
pear on different axes in the measurements of the two
accelerometers.
At first the sensitivities and offsets of the sensors
were calibrated following the least squares approach,
whis is described in (STMicroelectronics, 2014). To
align the two sensors we rotate the back sensor virtu-
ally until the coordinate systems are overlapping. For
this procedure the rotation is described as rotation ma-
trices for the x-, y- and z-axis with the corresponding
angles Φ,Θ and Ψ. The coordinate system is visual-
ized in figure 4.
X
Z
Y
Figure 4: Coordinate system of an accelerometer.
R
x
(Φ) =
1 0 0
0 cos(Φ) −sin(Φ)
0 sin(Φ) cos(Φ)
(1)
R
y
(Θ) =
cos(Θ) 0 sin(Θ)
0 1 0
−sin(Θ) 0 cos(Θ)
(2)
R
z
(Ψ) =
cos(Ψ) −sin(Ψ) 0
sin(Ψ) cos(Ψ) 0
0 0 1
(3)
The total rotation matrix for all three axis can then be
formed by multiplying all matrices together:
A = R
x
(Φ
∗
) · R
y
(Θ
∗
) · R
z
(Ψ
∗
) (4)
Virtual rotation of the back sensor can be done by
rotating the measurements x, y and z of the back ac-
celerometer S2 with the rotation matrix A to the trans-
formed measurements ´x, ´y and ´z:
´
x
y
z
S2
= A ·
x
y
z
S2
(5)
If the rotation matrix is applied, the measurements of
the front sensor S1 and the transformed measurements
of the back sensor S2 are equal and the coordinate
systems are overlapping:
´
x
y
z
S2
=
x
y
z
S1
(6)
Measuring Respiration and Heart Rate using Two Acceleration Sensors on a Fully Embedded Platform
17

For a rough guess of the rotation matrix A we use the
angular information which we directly get from the
accelerometer measurements, namely the earth grav-
ity vector. While standing still and holding the breath,
there is no other acceleration affecting the measure-
ment than the acceleration from gravity. In this situa-
tion the rotation angles Φ and Θ of the x- and y-axis
for each sensor S1 and S2 can be determined with the
following equations and the corresponding accelera-
tion values a
x
,a
y
and a
z
.
Φ
S1,S2
= tan
−1
a
y
p
a
2
x
+ a
2
z
!
(7)
Θ
S1,S2
= tan
−1
a
x
q
a
2
y
+ a
2
z
(8)
After calculating these angular guesses one can con-
struct the angular differences Φ
d
and Θ
d
between the
front and the back sensor by simple subtracting:
Φ
d
Θ
d
=
Φ
S1
− Φ
S2
Θ
S1
− Θ
S2
(9)
By using Φ
d
and Θ
d
in the corresponding equations
1 and 2 one can calculate the estimated rotation ma-
trices, which transform the back sensor’s coordinate
system in order to fulfill equation 6. Since the wearer
of the belt will probably do some motion in the cal-
ibrating phase which might distort the angle calcula-
tion and since the previously described method can
only estimate the angles of the x- and y-axis, we fur-
ther implemented a more advanced calibration, which
takes the estimated angles, calculated from the earth
gravity vector, as an initial guess.
3.3.1 Optimized Calculation of Rotation
In the more advanced approach for calculating the
misalignment of the coordinate systems we introduce
the cost function C(Φ, Θ, Ψ) (equation 10) which cal-
culates how good the fit between the measurements of
the front sensor S1 and the back sensor S2 is.
C(Φ, Θ, Ψ) =
1
N
N
∑
i
|x
(S1)
i
− R
x
(Φ)x
(S2)
i
|
+|y
(S1)
i
− R
y
(Θ)y
(S2)
i
| (10)
+|z
(S1)
i
− R
z
(Ψ)z
(S2)
i
|
After collecting data for some seconds the cost func-
tion can be optimized over the rotation angles Φ,Θ
and Ψ (equation 11), in order to get the optimized an-
gles Φ
∗
,Θ
∗
and Ψ
∗
. For getting useful data one must
still hold the breath in the collecting phase since we
just want information which is about static position-
ing on the body. Dynamic movement along an axis
of the body while collecting measurement data helps
the optimizer to calculate a good result in contrast to
the previous estimation approach, presented in chap-
ter 3.3, where no movement should occur.
Φ
∗
Θ
∗
Ψ
∗
= arg min
Φ,Θ,Ψ
C(Φ, Θ, Ψ) (11)
Since the processing speed of a microcontroller is
limited we used the stable and easy to implement lo-
cal search optimizer for solving equation 11. The cal-
culated angles from the previous method from chap-
ter 3.3 can be fed into the optimizer as an initial guess,
which leads to faster convergence. Figure 5 shows the
result of the optimization of a sample data set. The
data set was generated by random acceleration of a
slightly misaligned sensor setup.
The whole alignment procedure is done only once
during startup of the system. Afterwards the rotation
matrix is stored internally and applied to every new
measurement.
3.4 Adaptive Filter
To eliminate noise outside of the respiration rate spec-
trum, we use an IIR Butterworth bandpass filter on
the acceleration data. The cutoff frequencies for res-
piration rate filtering were set to F
low
= 0.1 Hz and
F
high
= 0.8 Hz. With only this bandpass the noise
in our signal is still too large. Therefore we imple-
mented an adaptive filter which works in the follow-
ing way:
• At first the data is filtered through a wide 4 stage
IIR Butterworth bandpass with 0.1 Hz to 0.8 Hz.
• Then a spectrum over the last 1 minute of filtered
data is calculated using a FFT. When the intention
is to analyze respiration with higher variance this
time frame can be made shorter.
• The maximum power frequency f
max
, which is
extracted from the FFT, is used to build a new
narrow 4 stage IIR bandpass with bandwidth
f
bw
. The high border is then calculated as
f
h
= f
max
+ f
bw
while the lower border is calcu-
lated with f
l
= f
max
− f
bw
. For still activities
we chose f
bw
= 0.25 Hz and for sport activities
f
bw
= 0.50 Hz. The widths of the bandpasses are
chosen in a way that the high variance of the res-
piration frequency while doing sport is taken into
consideration. In situations with less activity like
sitting or sleeping it can be expected that the vari-
ance of the respiration rate is reasonable lower.
The corresponding IIR coefficients are stored in a
icSPORTS 2015 - International Congress on Sport Sciences Research and Technology Support
18
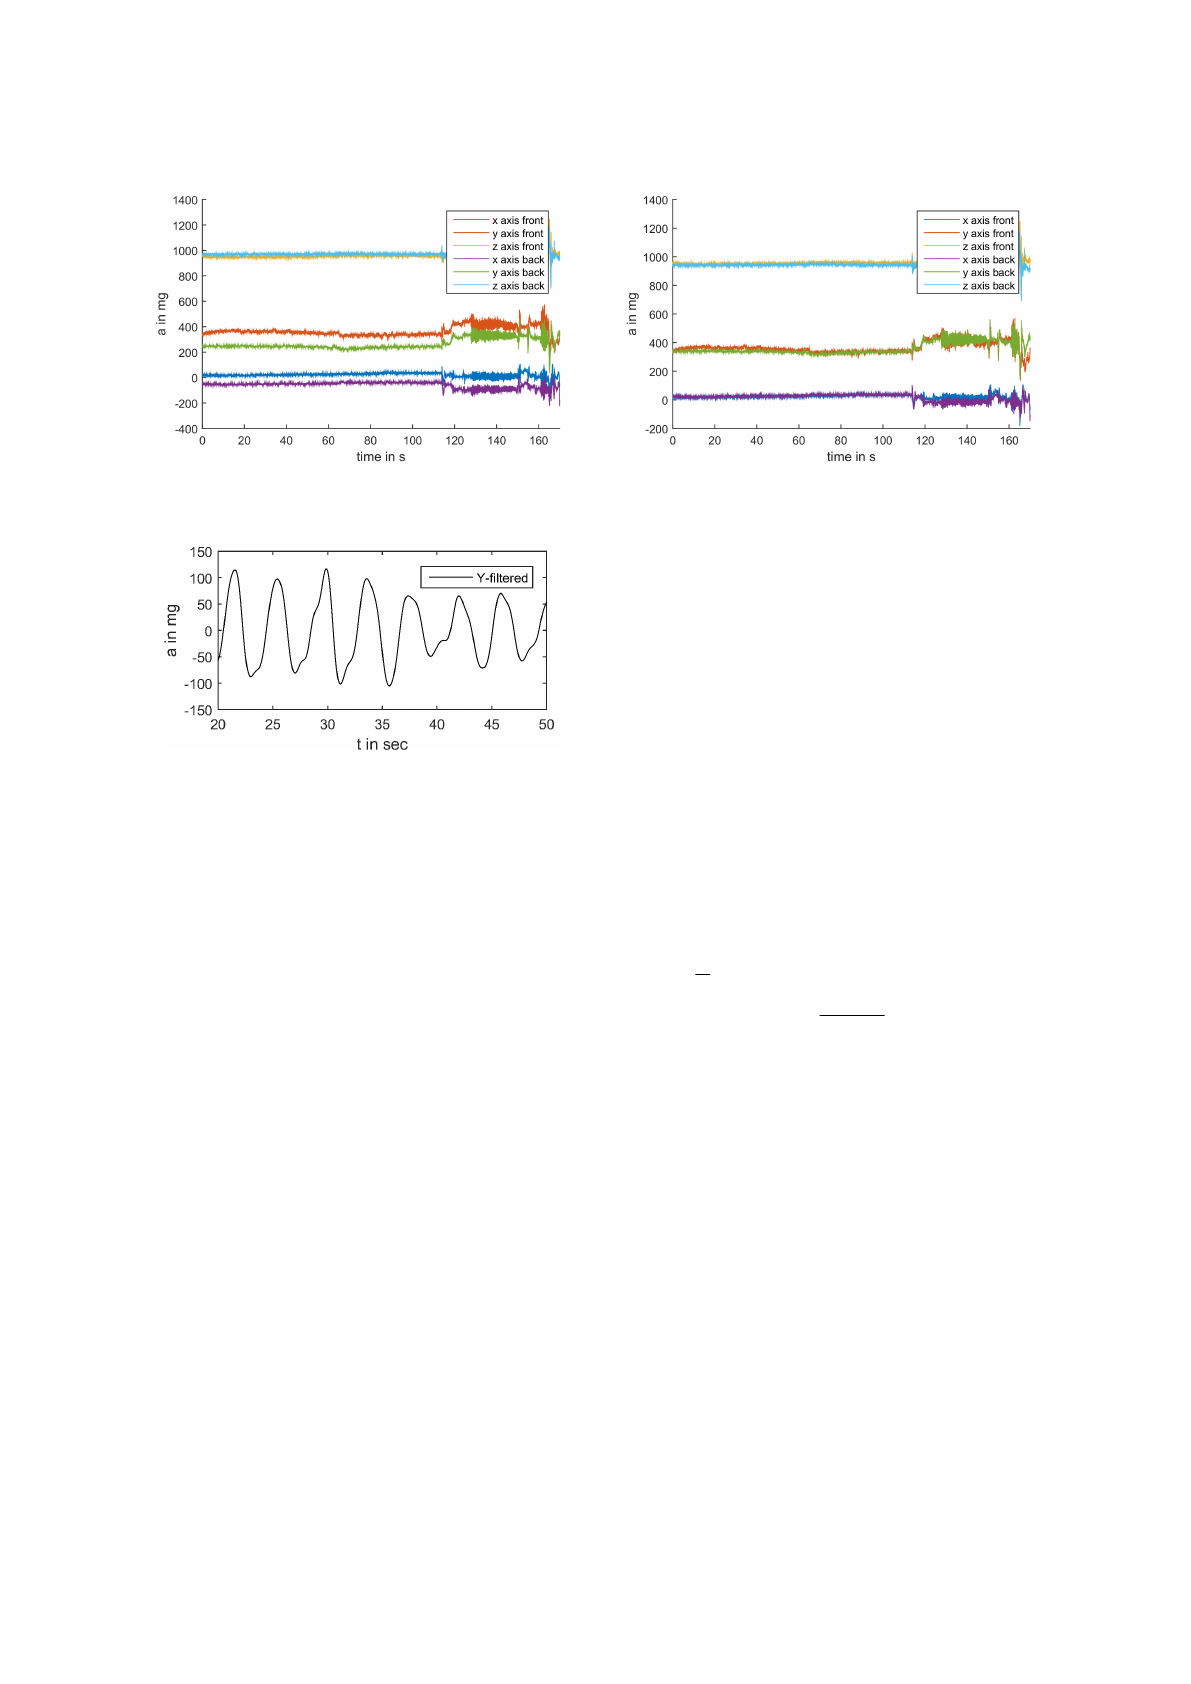
Figure 5: Left side: Not optimized acceleration data. Here the coordinate systems are misaligned. Right side: Optimized
acceleration data. The coordinate systems are overlapping.
Figure 6: Filtered difference acceleration signal a
diff
.
database on the chip and the coefficients which fit
best to the calculated frequency band f
h
to f
l
are
then applied.
3.5 Peak Detection
After optimization, rotation and filtering we solely
use the y-axis acceleration data a
y
, which is in the di-
rection normal to the chest and the back surface. This
is the part of the data with the highest information
value to detect the lifting and inclination of the chest
at respiration.
The final difference acceleration data a
diff
is then
calculated by subtracting the back sensor data a
y
back
from the front sensor data a
y
front
. This reduces the er-
rors introduced by motion of the subject. The result-
ing data is represented in figure 6.
We then use an embedded peak detection algo-
rithm to detect maxima in the data. The algorithm
stores the last 18 seconds of the data in a buffer and
checks for peaks by looking at every data point A
i
.
If the leftmost neighbor A
i−1
and rightmost neighbor
A
i+1
are smaller than A
i
, i.e. A
i−1
≤ A
i
≤ A
i+1
, A
i
is
a peak candidate. The algorithm then calculates the
peak prominence p
i
of A
i
. The peak prominence is
defined as vertical height between the peak and the
nearest minimum belonging to a higher peak. If there
is no higher peak it is defined as vertical height be-
tween the peak and the lowest data point.
If the peak candidate A
i
has an equal or higher peak
prominence p
i
than 0.5 times the standard deviation σ
of the data in the buffer, i.e. p
i
≥ 0.5 · σ, it is stored as
a true peak P
i
.
After one second the buffer is shifted by 100 points,
the new 100 data points are stored and the search for a
new peak is repeated. This means the possible update
frequency for respiration rate output of our system is
1 Hz.
3.6 Respiration Rate Calculation
From the position of two peaks in the buffer of the
peak detection method introduced in section 3.5 and
sampling rate F
s
= 100 Hz, we can calculate the time
T
d
between two peaks as can be seen in equation 12.
The resulting respiration rate F
R
is the inverse of T
d
,
i.e. F
R
=
1
T
d
.
T
d
=
|P
i
− P
j
|
F
s
(12)
3.7 Heart Rate Detection
For parallel heartbeat detection we use the aligned dif-
ferential acceleration signal with a higher sampling
rate of 400 Hz. In the unfiltered signal of the y-axis
the pulses are already clearly visible (see figure 7).
Unfortunately this signal is not very suitable for direct
extraction of the heartbeat.
It turns out that for our measurement system the heart-
beat pulses appear as blocks of several swings with
the frequency between 12 and 28 Hz. For filtering out
the undesired noise we then filter the signal with a 12-
28 Hz IIR Butterworth bandpass filter. Afterwards we
take the absolute value of the IIR filtered signal (see
figure 8).
Finally we smooth the signal with a second order FIR
savitzky golay filter and window of 49 samples, which
Measuring Respiration and Heart Rate using Two Acceleration Sensors on a Fully Embedded Platform
19
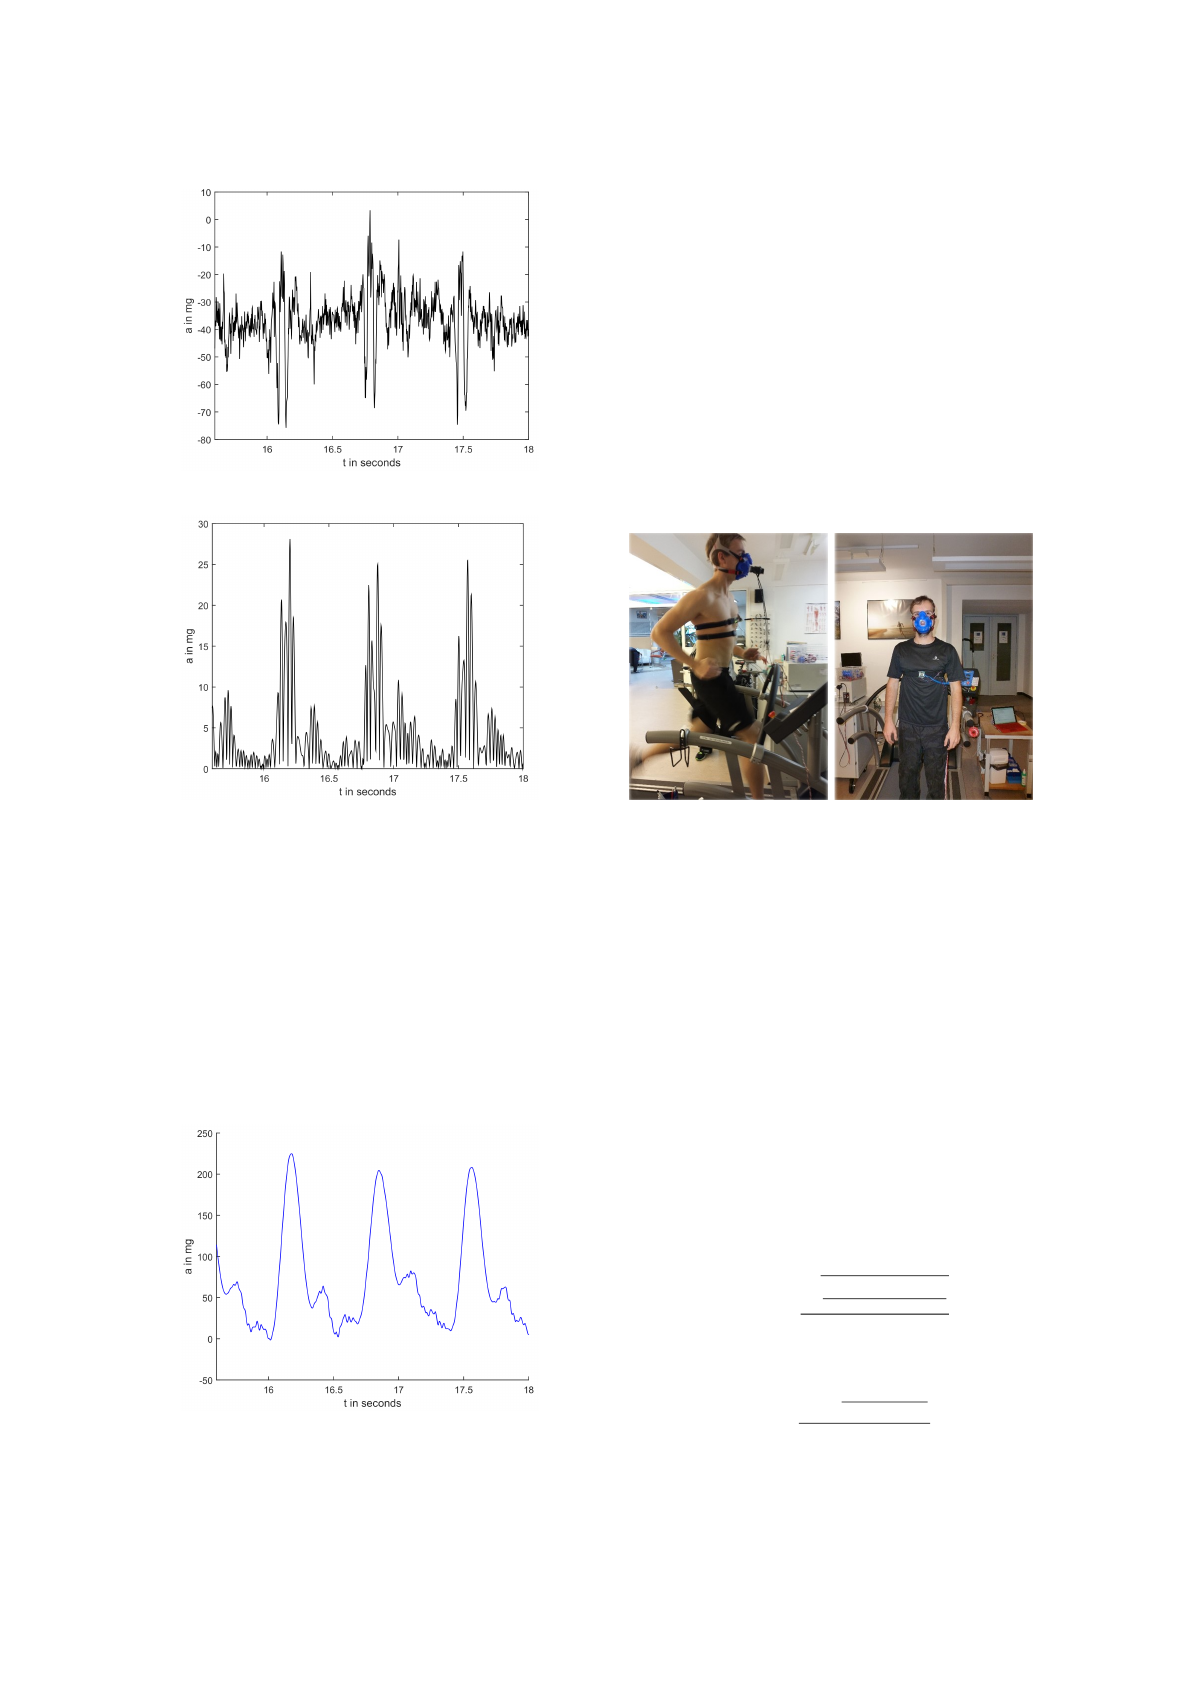
Figure 7: Raw heartbeat signal from differential signal.
Figure 8: IIR filtered absolute heartbeat signal.
keeps the relative maxima, minima and diversification
(see figure 9). Over the resulting signal we use again
our embedded peak detector to obtain the heart rate.
For filtering out outliers, we compare the mean of the
last 5 valid frequencies with the new calculated fre-
quency. If the new one is more than 50% away from
the previous mean it is discarded. At initialization of
the device, when there are no previous frequencies,
we just take the mean of the first 10 frequencies as
the value for comparison. Only after the initialization
the heartbeat frequency will be outputted.
Figure 9: Savitzky golay filtered heartbeat signal.
4 RESULTS
To verify our system we performed several test mea-
surements. Two subjects A and B, outfitted with
our system, were standing, walking and running on a
treadmill. The reference respiration rate was derived
from a stationary CPX system (Oxycon Pro Care Fu-
sion, San Diego CA, USA). Optoelectronic flow de-
tection occurred by a flow-volume sensing turbine in-
side a transducer holder fixed on the subjects face-
mask. Prior to testing, the flow-volume sensing tur-
bine was calibrated by a 3 liter syringe. Figure 10
shows the experimental setup.
Figure 10: Experimental setup for evaluation of the system
with subject A (left) and B (right).
To smooth the resulting frequencies we applied a 10
second moving average filter to the measurement and
reference data. The first minute of data was skipped
due to calibration and optimization issues.
The error between the measurement and the refer-
ence is stated both as normalized root mean square
error (NRMSE) and mean percentage error (MPE).
The calculation of the NRMSE is done as shown
in equation 13, where the measurement range is
from F
min
= 0.1 Hz to F
max
= 0.8 Hz for respira-
tion rate measurements and from F
min
= 0.8 Hz to
F
max
= 3.5 Hz for heart rate measurements. The MPE
is calculated according to the equation 14. All data
presented here are recorded from subject A, since the
T-shirt worn by subject B influenced the measure-
ments and made them unreliable.
E
NRMSE
=
q
∑
N
i=1
(F
meas
i
−F
ref
i
)
2
N
F
max
− F
min
(13)
E
MPE
=
∑
N
i=1
|
F
meas
i
−F
ref
i
|
F
ref
i
N
(14)
icSPORTS 2015 - International Congress on Sport Sciences Research and Technology Support
20
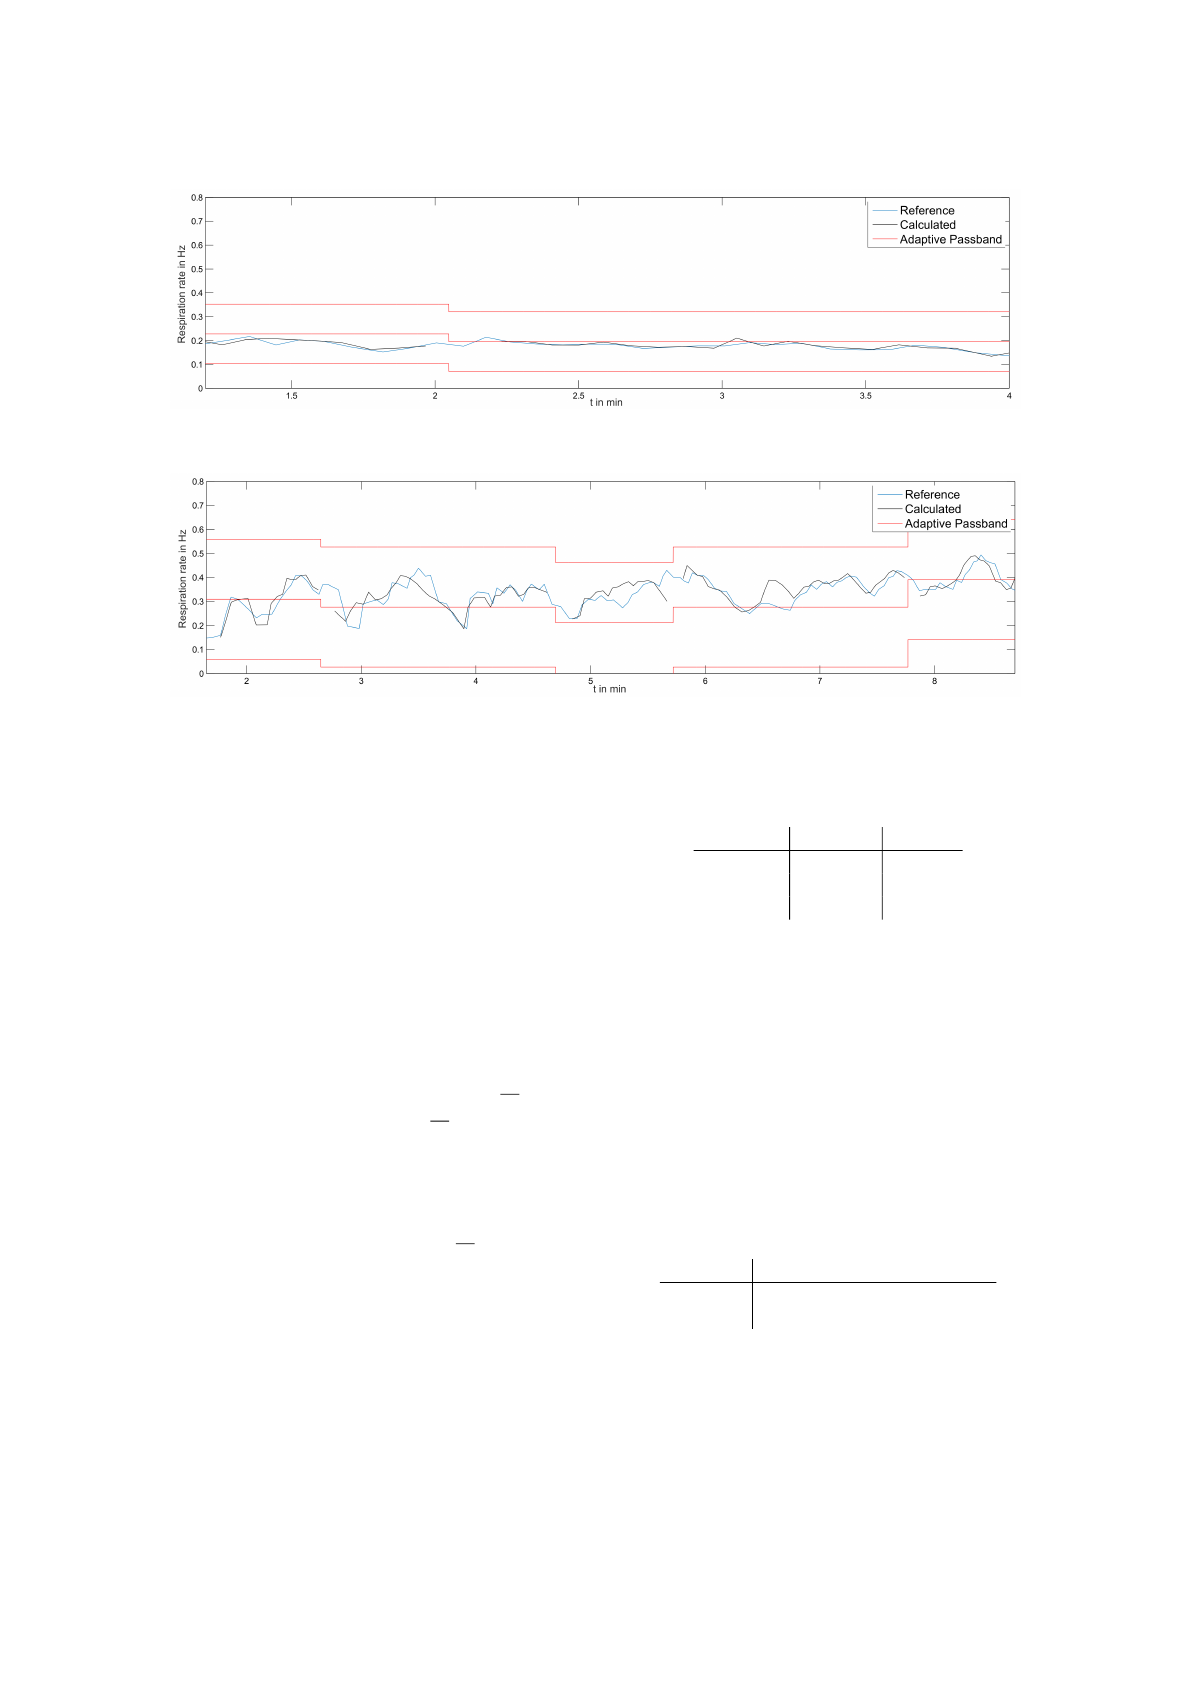
Figure 11: Respiration rate measurement of our system (black) and the reference (blue) in situation S1. The borders of the
adaptive bandpass are marked in red.
Figure 12: Respiration rate measurement of our system (black) and the reference (blue) in situation S2. The borders of the
adaptive bandpass are marked in red.
4.1 Respiration Rate
To quantify the performance of our system in distinct
use cases we reconstructed three different situations.
Situation One (S1): Office work.
The subject was sitting on an office chair, per-
forming slight motion which involved moving the
upper body and the arms. The measurement time
was 4 minutes. Figure 11 shows the respiration
rate of our system and the reference.
Situation Two (S2): Walking and jogging.
The subject was first walking with 5
km
h
for 5
minutes, then jogging with 7
km
h
for 4 minutes
on a treadmill. The measurements can be seen in
figure 12.
Situation Three (S3): Running and stopping.
The subject was running with 15
km
h
on a tread-
mill followed by 2 minutes of standing still. This
was then repeated, as can be seen in figure 13.
Table 1 shows the NRMSE and MPE of our system
measurements compared to the reference in the three
situations.
Table 1: NRMSE and MPE of respiration rate measure-
ment.
Situation NRMSE MPE
S1 1.42 % 4.40 %
S2 5.46 % 8.59 %
S3 3.95 % 4.13 %
4.2 Heart Rate
To quantify the performance of or system at measur-
ing the heart rate we used a Polar H7 heart rate belt
strapped to the chest of the subject as the reference.
For this test the situation was slight movement of the
subject, which included body rotation and walking
across a room for 4 minutes. The heart rate measure-
ment of our system and the reference measurements
can be seen in figure 14. The NRMSE and PME are
stated in table 2.
Table 2: NRMSE and MPE of heart rate measurement.
Situation: Slight movement
NRMSE 1,74 %
MPE 2,65 %
Measuring Respiration and Heart Rate using Two Acceleration Sensors on a Fully Embedded Platform
21
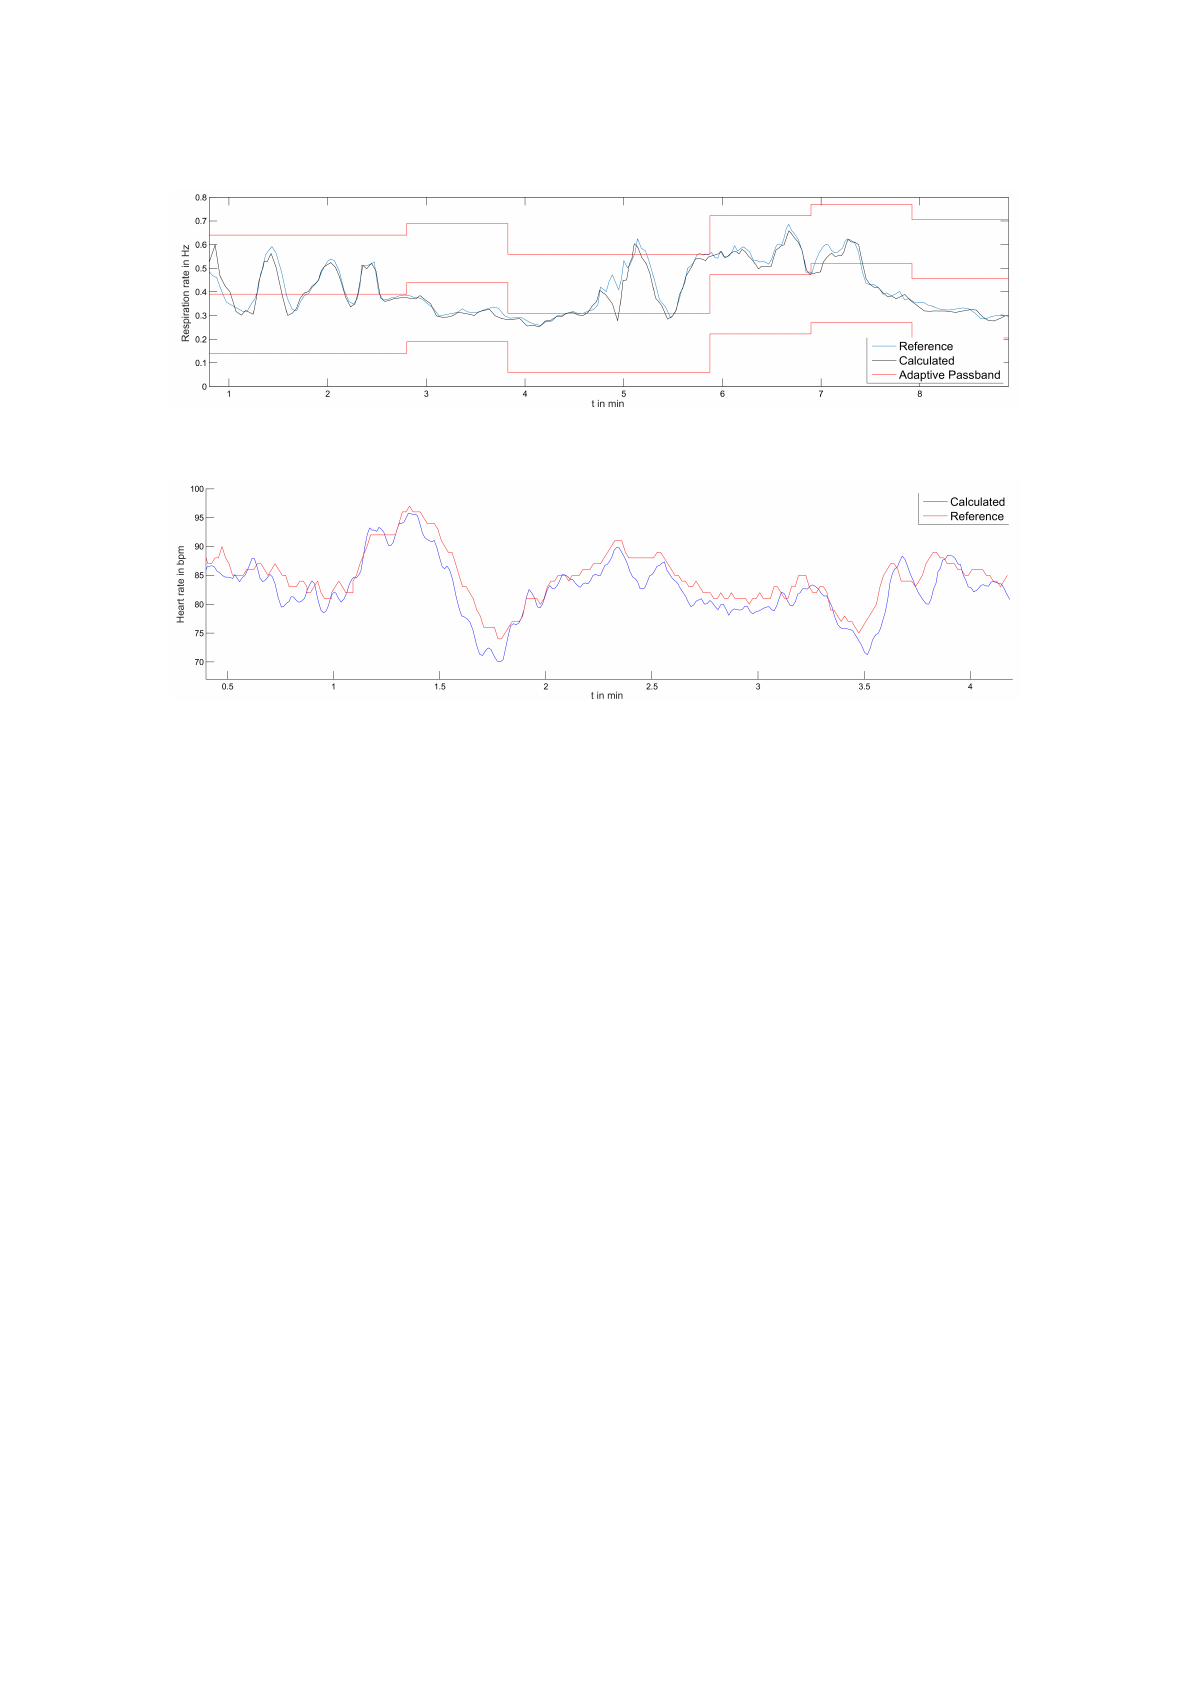
Figure 13: Respiration rate measurement of our system (black) and the reference (blue) in situation S3. The borders of the
adaptive bandpass are marked in red.
Figure 14: Heart rate measurement of our system (blue) and the reference (red).
5 CONCLUSIONS
In this paper, a method to measure respiration and
heart rate with acceleration sensors has been pre-
sented. The results show that we are able to detect
the respiration rate with low errors in different situa-
tions. By using the differential measurement with two
sensors, advanced calibration, optimization methods,
and an adaptive, rather small bandpass, we are able
to reduce the noise drastically and receive reliable re-
sults, even in very noisy settings such as fast running.
Important to recognize is, that the highest error
occurs if the person has a medium activity like in sit-
uation S2. In this situation the signal-to-noise ratio
is very weak due to the relatively small demand of
oxygen and the corresponding small amplitude of the
chest. Surprisingly the ratio increases again with a
more demanding activity and higher amplitude of the
chest, although this activity results in a higher motion
noise, like in situation S3. This observation explains
the fact that smaller errors can be achieved in very still
activities as well as in intensive sport activities. In
these situations our dual sensor setup produces highly
accurate measurements, while the results in situation
S2 are still very reasonable.
Since it occurred to us that most of the informa-
tion came from the inclination of the sensor during
respiration, further investigations could be done with
gyroscopes in comparison to acceleration sensors.
Furthermore, by using the same sensor setup and sim-
ilar methods we were able to measure the heart rate
with a very small error. Further development of the
heart rate detection component and an application of
our methods to more different situations could be a
promising topic for future investigations.
REFERENCES
Bates, A., Ling, M., Mann, J., and Arvind, D. (2010). Res-
piratory rate and flow waveform estimation from tri-
axial accelerometer data. In Body Sensor Networks
(BSN), 2010 International Conference on, pages 144–
150.
Cao, Z., Zhu, R., and Que, R.-Y. (2012). A wireless portable
system with microsensors for monitoring respiratory
diseases. In Biomedical Engineering, IEEE Transac-
tions on, volume 59, pages 3110–3116.
Carey, D. G., Schwarz, L. A., Pliego, G. J., and Raymond,
R. L. (2005). Respiratory Rate is a Valid and Reliable
Marker for the Anaerobic Threshold: Implications for
Measuring Change in Fitness. volume 4, pages 482–
488.
Heyde, C., Leutheuser, H., Eskofier, B., Roecker, K.,
and Gollhofer, A. (2014). Respiratory inductance
plethysmography-a rationale for validity during exer-
cise. volume 46, pages 488–495.
Hoeflinger, F., Mueller, J., Toerk, M., Reindl, L., and Bur-
gard, W. (2012a). A wireless micro inertial measure-
icSPORTS 2015 - International Congress on Sport Sciences Research and Technology Support
22
ment unit (IMU). In Instrumentation and Measure-
ment Technology Conference (I2MTC), 2012 IEEE In-
ternational, pages 2578–2583.
Hoeflinger, F., Toerk, M., Ojha, A., and Reindl, L. (2011).
Drivability enhancement of transport buses using an
auxiliary system with an IMU. International Journal
of Electrical & Computer Sciences (IJECS).
Hoeflinger, F., Zhang, R., and Reindl, L. (2012b). Indoor-
localization system using a micro-inertial measure-
ment unit (IMU). In European Frequency and Time
Forum (EFTF), 2012, pages 443–447.
Jin, A., Yin, B., Morren, G., Duric, H., and Aarts, R. (2009).
Performance evaluation of a tri-axial accelerometry-
based respiration monitoring for ambient assisted liv-
ing. In Engineering in Medicine and Biology Society,
2009. EMBC 2009. Annual International Conference
of the IEEE, pages 5677–5680.
Liu, G. Z., Guo, Y. W., Zhu, Q. S., Huang, B. Y., and Wang,
L. (2011). Estimation of respiration rate from three-
dimensional acceleration data based on body sensor
network. In Telemed J E Health, volume 17, pages
705–711.
Onorati, P., Martolini, D., Valli, G., Laveneziana, P.,
Marinelli, P., Angelici, E., and Palange, P. (2012). A
simplified approach for the estimation of the ventila-
tory compensation point. volume 44, pages 716–724.
Phan, D., Bonnet, S., Guillemaud, R., Castelli, E., and
Pham Thi, N. (2008). Estimation of respiratory wave-
form and heart rate using an accelerometer. In Engi-
neering in Medicine and Biology Society, 2008. EMBS
2008. 30th Annual International Conference of the
IEEE, pages 4916–4919.
Simon, N., Bordoy, J., Hoeflinger, F., Wendeberg, J.,
Schink, M., Tannhaeuser, R., Reindl, L., and Schin-
delhauer, C. (2015). Indoor localization system
for emergency responders with ultra low-power ra-
dio landmarks. In International Instrumentation and
Measurement Technology Conference (I2MTC).
STMicroelectronics (2014). AN4508 Application note - Pa-
rameters and calibration of a low-g 3-axis accelerom-
eter.
Tewel, N. (2010). Application of mems accelerometer
for baby apnea monitoring under home conditions.
In Acta Bio-Optica et Informatica Medica. Inynieria
Biomedyczna, volume Vol. 16, nr 4, pages 389–393.
Wasserman, K. (2012). Principles of exercise testing and
interpretation: Including pathophysiology and clini-
cal applications. Wolters Kluwer/Lippincott Williams
& Wilkins, Philadelphia, 5th edition.
Yoon, J., Noh, Y., Kwon, Y., Kim, W., and Yoon, H.
(2014). Improvement of dynamic respiration monitor-
ing through sensor fusion of accelerometer and gyro-
sensor. Journal of Electrical Engineering and Tech-
nology, 1(1).
Zhang, R., Bannoura, A., Hoeflinger, F., Reindl, L., and
Schindelhauer, C. (2013). Indoor localization using
a smart phone. In Sensors Applications Symposium
(SAS), 2013 IEEE, pages 38–42.
Measuring Respiration and Heart Rate using Two Acceleration Sensors on a Fully Embedded Platform
23
