Multichannel QRS Morphology Clustering
Data Preprocessing for Ultra-High-Frequency ECG Analysis
Filip Plesinger
1
, Juraj Jurco
1
, Josef Halamek
1
, Pavel Leinveber
2
,
Tereza Reichlova
2
and Pavel Jurak
1
1
Institute of Scientific Instruments of the Czech Academy of Sciences, Brno, Czech Republic
2
International Clinical Research Center at St. Anne’s University Hospital, Brno, Czech Republic
Keywords: ECG, SAECG, QRS, Ultra-High-Frequency, Clustering, Multi-thread, Ventricle Dyssynchrony.
Abstract: Ultra-high-frequency ECG (UHF-ECG) in a range of 500–1,000 Hz has been tested as a new information
source for analysis of left-ventricle dyssynchrony and other myocardial abnormalities. The power of UHF
signals is extremely low, for which reason an averaging technique is used to improve signal-to-noise ratio.
Since ventricle dyssynchrony is different for various QRS complex types, the detected QRS complexes must
be clustered into morphology groups prior to averaging. Here, we present a fully-automated method for
clustering. The first goal of the method is to separate previously detected QRS complexes into different
morphology groups. The second goal is to precisely fit the QRS annotation marks to the exact same position
against the QRS shape. The method is based on the Pearson correlation and is optimized for parallel
processing. In our application with UHF-ECG data the number of detected groups was 3.24 ± 3.41 (mean
and standard deviation over 1,030 records). The method can be used in other areas also where the clustering
of repetitive signal formations is needed. For validation purposes, the method was tested on the MIT-BIH
Arrhythmia and INCART databases from Physionet with results of purity of 98.24 % and 99.50 %.
1 INTRODUCTION
The electrocardiogram (Fig. 1A) is one of the most
important sources of knowledge about heart
function. The analyzed frequency band is mostly
limited to 150 Hz. At higher frequencies the most
limiting factor is the signal-to-noise ratio, which can
be surpassed using the signal-averaged ECG
(SAECG), suppressing noise thanks to averaging
large number (over tens or more) of QRS
complexes. Using SAECG, fetal QRSs were
extracted from maternal ECG (Hon and Lee, 1963)
and weak signals in frequency range 40-300 Hz
revealed high-frequency QRS potentials (Goldberger
et al., 1981). Moreover, SAECG technique allowed
further research in the fields of ventricular late
potentials (Simson 1983; Haberl et al. 1988; Jarrett
and Flowers, 1991) and atrial fibrillation (Fukunami
et al., 1991). Several devices for SAECG were
developed in the past as ART 1200 EPX, Corazonix
Predictor or VCM-3000.
But every step on this high-frequency road was
laid into the range below 250-300 Hz, assuming that
there is nothing useful above. It was correct for early
times when bit-depth of common analog/digital
converters allowed 12 bits, dislodging weak
potentials of higher frequencies into quantization
darkness. Detection of Reduced Area Zones (RAZ)
also uses the frequency range of 150-250 Hz
(Abboud et al., 1987). Accessibility of this technique
(later implemented in Hyper-Q devices) gained new
research in myocardial ischemia (Schlegel et al.,
2004), ECG during anesthesia (Spackman et al.,
2005) or in myocardial infarction (Amit et al., 2013).
Even the spread of SAECG and continuously
increased technical level of analog to digital
converters both in sampling frequency and bit depth
(note common 192 kHz and 24 bits in the field of
digital audio recording), the clinical community still
relies on well-proven frequency range of 0-150 Hz
in classic ECG while only fearless specialists use
RAZ analysis in high-frequency range 150-250 Hz
(HF-ECG).
Against those habits, our team has developed and
tested an innovative method for ultra-high-frequency
ECG (UHF-ECG; up to 2 kHz) analysis (Jurak et al.,
2013) that provides information about spatial and
temporal distribution of depolarization phase of
action potentials. Furthermore, it is able to reveal
ventricle dyssynchrony with the common 12-lead
Plesinger, F., Jurco, J., Halamek, J., Leinveber, P., Reichlova, T. and Jurak, P..
Multichannel QRS Morphology Clustering - Data Preprocessing for Ultra-High-Frequency ECG Analysis.
In Proceedings of the 3rd International Congress on Cardiovascular Technologies (CARDIOTECHNIX 2015), pages 11-19
ISBN: 978-989-758-160-1
Copyright
c
2015 by SCITEPRESS – Science and Technology Publications, Lda. All rights reserved
11
ECG that cardiology specialists are used to. As the
preliminary results show, dyssynchrony can be
derived from UHF signal envelopes in the QRS
complex region in leads V1 and V6. A high-dynamic
acquisition system must be used simultaneously with
new processing methods to acquire UHF-ECG.
We have used input data with a sampling rate of
5 kHz and 24-bit dynamic range which allows us to
analyze UHF envelopes in a frequency range of
500–1,000 Hz (Fig. 1B), being high above currently
accepted frequency range. The power in this range is
very weak; the QRS amplitude in the UHF envelope
is approximately 80 dB lower than the low-
frequency (up to 150 Hz) QRS complex amplitude
(compare Figures 1A and B).
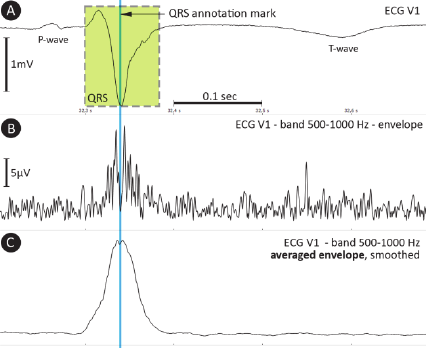
Figure 1: A – ECG signal with P-wave, QRS complex and
T-wave; B – signal envelope in the 500–1,000 Hz band;
C – averaged envelope, smoothed (40 samples, rectangular
window).
Signal averaging (mentioned as SAECG before)
is applied to increase the signal-to-noise ratio using
QRS annotation marks as reference points. QRS
complexes must be clustered into groups specified
by QRS morphology due to the possible presence of
more beat types within a single ECG record.
Furthermore, QRS annotation marks must point
to exactly the same sample (Rompelman and Ros,
1986a; Rompelman and Ros, 1986b) inside the QRS
shape (Fig. 1A). Envelopes in the range 500–
1,000 Hz (Fig. 1C) can then be averaged using tens
to hundreds of beats depending on the signal quality.
The electrical activity of the myocardium, expressed
by UHF-ECG envelopes, carries specific temporal
and spatial information that can be further analyzed
(Jurak et al., 2013).
The clustering process is, therefore, an essential
step in UHF-ECG analysis as it is needed to assure
that UHF envelopes belonging to different QRS
types will not be mixed together during averaging. A
similar need has been described in a study (Amit et
al., 2013) before averaging the signal to obtain RAZ.
Current clustering methods (Castro and Paulo,
2014; Lagerholm and Peterson, 2000; Cuesta-Frau et
al., 2003; Chang et al., 2005) aim to assign
previously detected QRS to known beat types. This
goal is not sufficient for our objective due to the fact
that a specific beat type may have different
morphologies (leading to different UHF-ECG
envelopes) which have to be distinguished. Also,
existing approaches do not correct the positions of
QRS annotation marks which is an important step to
maintain detail in averaged envelopes.
We are, therefore, proposing a new clustering
method that can be used in UHF-ECG analysis and
works with multiple leads without human
intervention, allowing full automation.
2 METHOD
2.1 Method Inputs and Preprocessing
The mounted signals from ECG V–leads (V1 to V6)
and a list of QRS annotations are inputs for the
method. QRS annotations are acquired by a robust
multi-lead detection method (Plesinger et al., 2014)
and cleared of pacemaker activity. Thus, only signal
preprocessing steps are mounting and pacemaker
activity removal, where areas influenced by
pacemaker activity are replaced by the linear
interpolation.
2.2 Processing
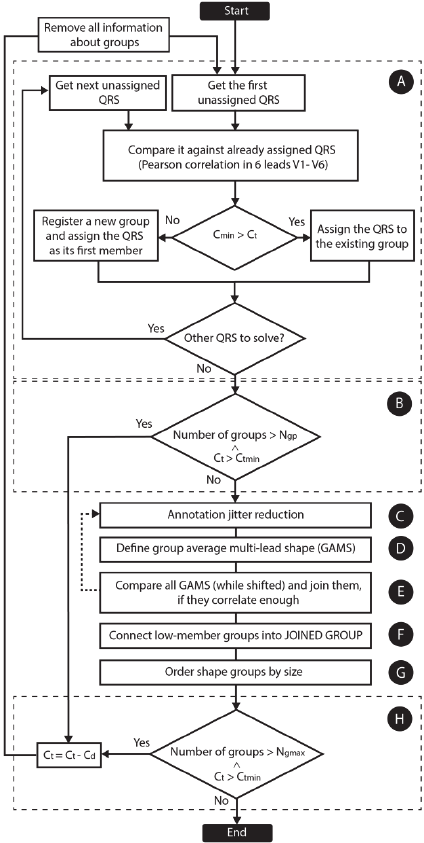
Processing is presented in a flowchart (Fig. 2).
2.2.1 Primary Clustering
At the beginning (Fig. 2A), the first QRS annotation
is declared the first member of the first morphology
group. Next, the segment around the first unassigned
QRS annotation is compared by Pearson correlation
to each of the QRS annotations already assigned.
This is performed simultaneously (as a multi-thread
process) in leads V1 to V6 within an area of ±120
ms around the QRS annotation and six correlation
coefficients are obtained. If the lowest correlation
coefficient C
min
is higher than correlation threshold
C
t
, the unassigned QRS is linked to the group of
correlating QRS annotation. If the tested QRS
annotation cannot be assigned to any of the existing
CARDIOTECHNIX 2015 - International Congress on Cardiovascular Technologies
12
morphology groups, a new group is created and the
unassigned QRS is linked to it as its first member.
This loop is repeated until none of the QRS
annotations remains unassigned.
Figure 2: Method flowchart. A – primary clustering, B –
correlation threshold reduction, C – annotation jitter
reduction, D – computation of averaged shapes, E – shift-
test, F – connecting small groups into a joined group, G –
group reordering, H – group count check. C
min
is the
lowest correlation from leads V1 to V6, C
t
is the current
corr. threshold (0.98 at the beginning of the process), C
tmin
the minimal permitted correlation threshold (0.75), C
d
the
decrement of the correlation threshold, N
gp
the maximum
number of groups permitted after primary clustering, N
gmax
the maximum number of groups.
2.2.2 Annotation Jitter Reduction
QRS annotations inside each morphology group
must be exactly aligned with one another. The
highest correlation between each QRS segment
(leads V1 to V6) and the first member of each group
is found by shifting the QRS annotation to the left
and right (Fig. 1C).
2.2.3 Group Average Multi-lead Shapes
A group average multi-lead shape (GAMS) is
created (Fig. 2D and Fig. 3C) for each morphology
group by averaging corresponding samples from all
QRS complexes from the specific group. Each
GAMS contains six averaged shapes (leads V1-V6).
2.2.4 Group Shift-test
It is possible that two or more groups contain a
similar type of QRS morphology, merely shifted to
the left or right. To merge such groups together, the
central part (a width of 120 ms) of each GAMS is
correlated with the GAMS of other groups when
shifted to the left and right (Fig. 2E). If the
correlation maximum is higher than threshold C
ts
,
the groups are joined together and the program
jumps back to the jitter reduction (Fig. 2C).
2.2.5 Joined Group
Groups containing less than three QRS annotations
are assigned to the “Joined Group” (Fig. 2F and Fig.
3 – the last column). This usually contains
misidentified QRS annotations and artefacts. A large
Joined Group can be produced if the source is too
noisy.
2.2.6 Order Groups by Size
Next, the shape groups are arranged by the number
of related QRS annotations except the Joined Group
(Fig. 2G). The shape group with the largest number
of QRS is named Group 1, the second Group 2 etc.
2.2.7 Check Groups Count
If the number of groups is still too high (>50) and C
t
is higher than C
tmin
, correlation threshold C
t
is
decreased and the computation is restarted (Fig. 2H).
2.3 Method Outputs
The method produces a modified QRS annotations
list, where each of the QRS annotations retains the
Multichannel QRS Morphology Clustering - Data Preprocessing for Ultra-High-Frequency ECG Analysis
13
information identifying the morphology group to
which a specific QRS belongs. Information about
the location of each QRS is updated when the offset
correction and group shift-test tasks (Fig. 2C and
2E) are completed. Statistical properties providing
information about the correlation between GAMS
and each member of a specific group are also saved
for statistical processing.
3 RESULTS
3.1 Application
The source data for our method are records 8–15
minutes long in a resting supine position; sampling
rate 5 kHz and bit resolution 26 bits (25 kHz and 24
bits before down-sampling). This dataset (UHF-
ECG) has been recorded at the International Clinical
Research Center at St. Anne’s University Hospital,
Brno, Czech Republic using a recording device from
the company M&I, Prague. A total number of 1,030
recordings have been made (262 ischemic heart
disease, 36 hypertrophic cardiomyopathy, 302
dilated cardiomyopathy, 261 heart transplant and
169 healthy subjects).
Using the presented method, all the available
records were clustered into morphology groups with
an average number of groups per record of 3.24 ±
3.41. The average percentage of QRS assigned to the
“Joined Group” (the group of QRS which did not
correlate well enough with any of the other groups)
was 0.99 % ± 2.09 and the average percentage of
QRS in Group 1 was 95.42 % ± 9.85. The median
correlation between each member of the majority
group (Group 1) and the corresponding averaged
shape was 0.997 ± 0.005 (over 1030 records).
Overall results for UHF-ECG dataset are shown in
Table 1.
Table 1: UHF-ECG dataset results. G1 - amount of QRS
in largest group, JG - amount of QRS in Joined Group, Ng
– number of detected groups.
Med. Mean ± SD Min Max
G1 [%] 99.51 95.37 ± 9.94 24.54 100.0
JG [%] 0.25 0.99 ± 2.11 0.00 27.65
Ng 2.00 3.27 ± 3.45 1.00 39.00
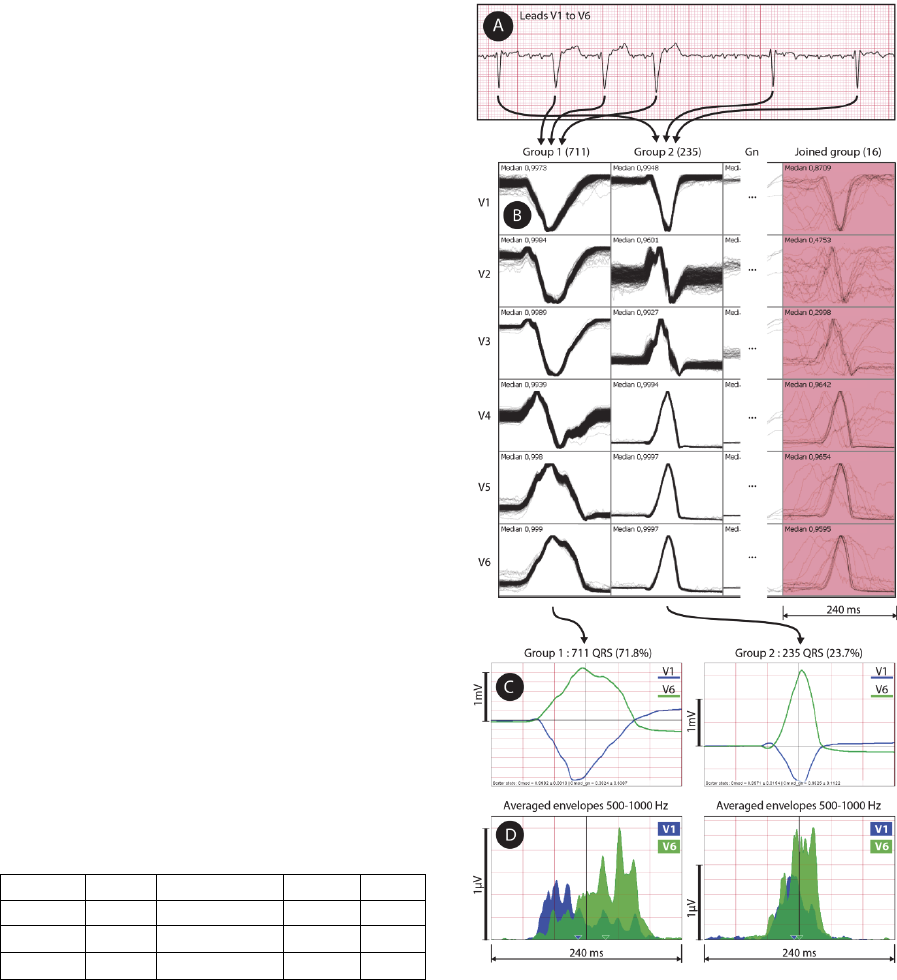
The application is presented in Fig. 3 on a
subject with dilated cardiomyopathy. QRS
complexes were detected from a 12-lead UHF-ECG
record (Fig. 3A) and clustered using leads V1 to V6
into five morphology groups (Fig. 3B). The majority
group – Group 1 – (Fig. 3B, the first column and
Fig. 4A) contains 711 QRS. The second group (Fig.
4B) contains 235 QRS. Group 3 and Group 4 (not
displayed) contains only 27 and 4 QRS, for which
reason it is not usable for averaging.
Figure 3: Method application: A – raw ECG data, B –
clustering method result (clusters in columns, leads in
rows) with median correlation inside each cell,
C – averaged QRS shapes for two largest groups, D –
averaged envelopes in range 500–1,000 Hz for two largest
QRS groups. UHF-ECG subject 0766.
CARDIOTECHNIX 2015 - International Congress on Cardiovascular Technologies
14
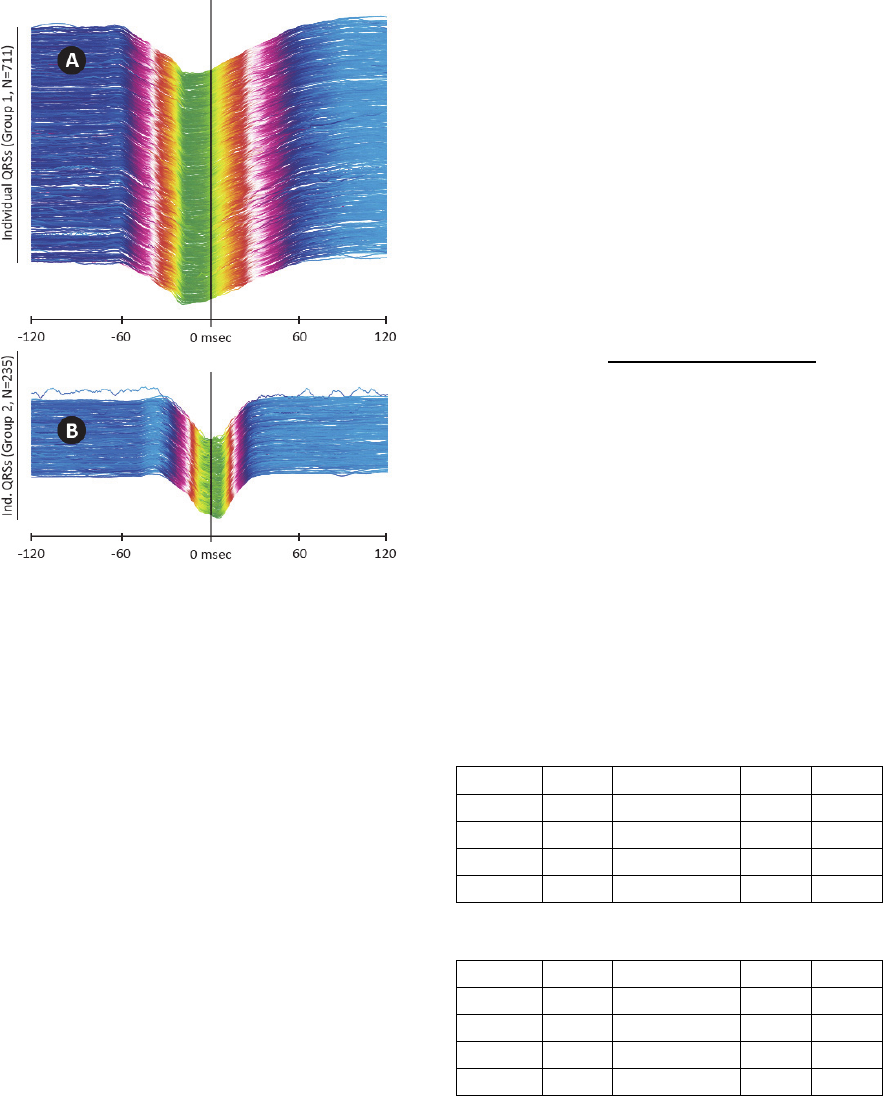
Figure 4: Categorized QRS complexes, ECG V1 lead in
240 ms window. A – Group 1 QRS complexes, B – Group
2 QRS complexes. Vertical line in the middle shows QRS
annotation mark (i.e. trigger). UHF-ECG subject 0766.
The “Joined Group” (Fig. 3B, the last red
column) contains 16 QRS which were not attached
to any of the existing groups due to noise or
artefacts. Each cell in the grid (Fig. 3B) contains a
240-millisecond-long window and each drawn QRS
is normalized to fill the predefined height of the cell
(i.e. auto-scaled). Once QRS complexes are
clustered into groups, it is possible to compute and
average amplitude envelopes in a range of 500–
1,000 Hz using FFT and Hilbert transform. The
averaged envelopes for Group 1 and Group 2 are
shown in Fig. 3D. In comparison with the greatly
magnified averaged QRS shape of Group 1 (Fig.
3C), we can see large electrical dyssynchrony
revealed between leads V1 and V6 (Fig. 3D).
3.2 Method Validation using Physionet
Annotated Databases
The MIT-BIH Arrhythmia (Moody and Mark, 2001)
and INCART databases from Physionet (Goldberger
et al., 2000) were used with 47 and 75 records,
respectively, for validation and comparison
purposes. The data quality does not allow the use of
these databases for UHF-ECG analysis (the
sampling rate and bit resolution are insufficient), but
they are carefully annotated by specialists and
existing QRS annotations can be used to evaluate the
purity of the clustered groups.
Specificity and sensitivity values or confusion
matrixes (usual ways to validate clustering method)
could not be computed because the presented
method does not aim to cluster QRS by any known
pathological morphology. Instead, purity (P) values
for both databases were computed to show the level
of contamination of clustered groups by different
QRS types (defined in Physionet beat annotations).
P was computed over all subjects and groups (except
for Joined Groups) as:
100 100
∑
(1)
where N
qrs
is the number of all QRS complexes
within the specific group, N
major
is the maximal
occurrence of any beat type (specified by Physionet
annotations) in the specific group, and N
total
is the
sum of all QRS over all subjects and groups (except
for Joined Groups). The overall purity of MIT-BIH
was 96.69 % and 98.38 % for the INCART database.
Purity can also be evaluated separately for each
subject/record and Tables 2 and 3 show purity,
group sizes and group count statistics for the MIT-
BIH and INCART databases.
Table 2: Results for MIT-BIH arrhythmia database
records. P – purity, G1 - amount of QRS in the largest
group, JG - amount of QRS in Joined Group, Ng – number
of detected groups.
Med. Mean ± SD Min. Max.
P [%] 99.84 96.87 ± 8.26 51.15 100
G1 [%] 79.41 79.23 ± 16.39 28.68 99.41
JG [%] 4.13 9.09 ± 9.63 0.20 31.03
Ng 18.00 23.77 ± 17.89 2.00 70.00
Table 3: Results for INCART database records.
Med. Mean ± SD Min. Max.
P [%] 99.95 98.47 ± 4.98 69.21 100
G1 [%] 73.92 75.09 ± 17.01 35.24 99.59
JG [%] 3.82 7.87 ± 8.68 0.00 33.48
Ng 13.50 19.29 ± 15.38 2.00 71.00
The overall purity of MIT-BIH was 96.69 % and
98.38 % for the INCART database, meaning that the
resultant groups are slightly contaminated by
different beat types. Further insight into the
contamination issue showed it is possibly caused by
two reasons:
Multichannel QRS Morphology Clustering - Data Preprocessing for Ultra-High-Frequency ECG Analysis
15
First, our method is not able to distinguish
between premature and escape beats having the
same shape as another QRS type (i.e. atrial
premature beats – A – and normal sinus beats – N –
in record 202 in MIT-BIH). Joining these beats
together (which is acceptable for our goals) will
increase average purity to 98.24 % (MIT-BIH) and
99.50 % (INCART).
Second, due to noise, individual shapes are not
able to correlate enough with existing morphology
groups and a large number of groups can be created.
If the number of groups is too high, the correlation
threshold can be decreased which may lead to the
unwanted linking of different beat types into one
group (as in the case of records 208 and 213 from
MIT-BIH).
Another issue can occur when the bottom limit to
correlation threshold (0.75) is met, but it is not
possible to create larger groups (N
QRS
>3). In this
way, the majority of QRS are moved to the Joined
Group (as in records 2, 3 and 58 from INCART).
3.2.1 Results Comparison
Specific results for validation records are presented
by Table 4 (MIT-BIH), showing comparison values
for groups detected by our method and an existing
method (Castro and Paulo, 2014).
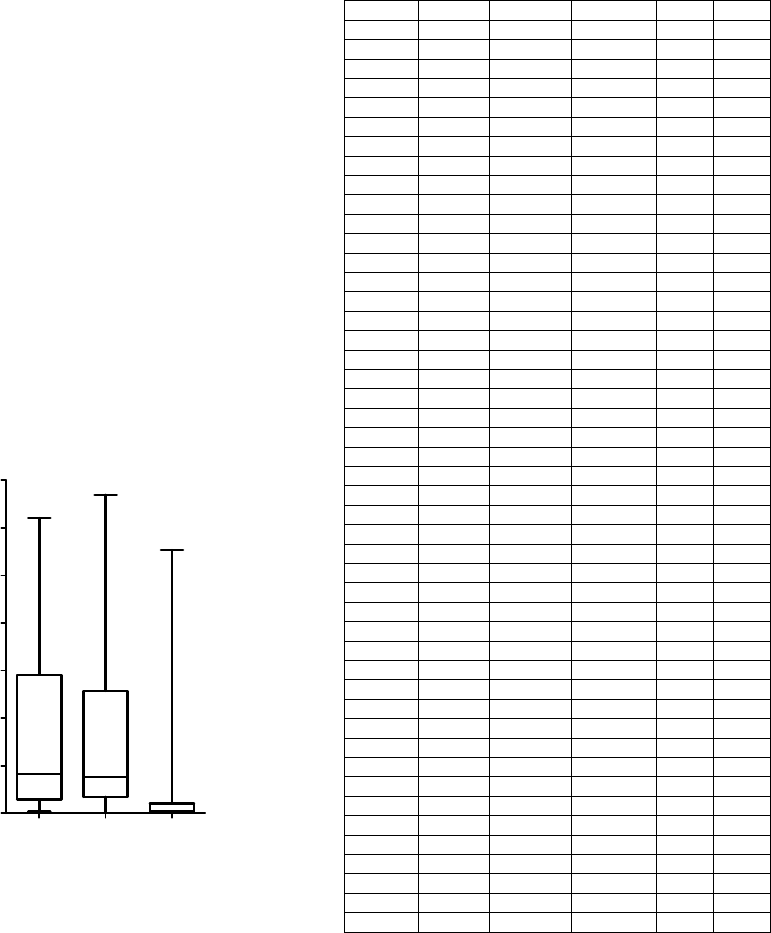
Figure 5: Joined Group sizes for two Physionet databases
and UHF-ECG dataset. Medians 4.13 (MIT-BIH), 3.82
(INCART) and 0.26 (UHF-ECG).
The number of QRS complexes in Joined Groups
(Fig. 5) indicates how many QRS complexes are not
(hypothetically) suitable for the following UHF-
ECG analysis. This value should be as low as
possible. The number of groups generated by
clustering (Fig. 6) is lowest for the UHF-ECG
database, though it strongly depends on subject-
specific pathology as well as signal quality.
Table 4: Results for MIT-BIH database records. P –
purity, G1 – amount of QRS in Group 1, JG – amount of
QRS in Joined Group, N
g
– number of groups generated
by our method, N
gc
– number of groups generated by
compared method (Castro and Paulo, 2014).
Record P [%] G1 [%] JG [%] N
g
N
g
c
100 98.58 99.34 0.66 2 4
101 99.86 68.47 23.43 52 4
102 99.86 92.36 1.28 17 10
103 100.00 85.94 7.20 29 10
104 98.77 56.98 15.84 54 16
105 100.00 68.23 26.87 28 10
106 100.00 44.89 30.93 30 27
107 100.00 96.40 0.94 10 11
108 99.70 60.64 25.47 18 22
109 100.00 97.08 1.70 7 13
111 100.00 90.58 6.54 17 8
112 99.96 82.63 8.00 39 4
113 100.00 96.99 1.06 10 5
114 99.58 66.58 11.66 70 8
115 100.00 97.75 1.54 8 11
116 99.96 92.91 2.99 13 10
117 99.93 99.41 0.59 2 4
118 95.84 93.81 3.86 13 3
119 100.00 77.45 0.20 3 6
121 99.94 95.60 4.13 4 5
122 100.00 82.96 9.37 55 1
123 100.00 99.41 0.26 4 3
124 98.10 53.24 2.66 16 14
200 96.99 28.68 31.03 48 20
201 97.95 84.11 3.16 11 15
202 98.62 96.77 1.45 9 9
203 99.50 62.08 26.31 43 33
205 99.92 79.07 6.81 49 14
207 94.92 79.41 6.94 22 61
208 51.15 67.11 29.48 32 28
209 90.34 71.11 27.29 20 10
210 100.00 79.70 11.32 39 27
212 100.00 66.05 14.56 38 5
213 81.83 98.40 1.32 5 17
214 99.95 87.75 2.61 13 21
215 99.96 76.06 17.45 38 16
217 98.82 70.15 4.08 30 28
219 99.63 96.75 0.56 7 14
220 95.62 98.88 0.83 4 2
221 100.00 61.27 18.34 34 14
222 83.68 73.66 12.12 64 8
223 96.57 79.31 3.72 21 23
228 99.84 65.76 9.40 25 14
230 100.00 58.07 1.68 8 3
231 99.87 79.31 1.08 12 5
232 77.76 92.47 5.79 15 4
233 99.67 72.04 2.60 29 24
A comparison of the results from the UHF-ECG
dataset and MIT-BIH and INCART databases in
Figure 5 shows that data quality greatly influences
the number of unsuccessfully clustered beats.
MIT-BIH INCART UHF-ECG
0
5
10
15
20
25
30
35
Percents
CARDIOTECHNIX 2015 - International Congress on Cardiovascular Technologies
16
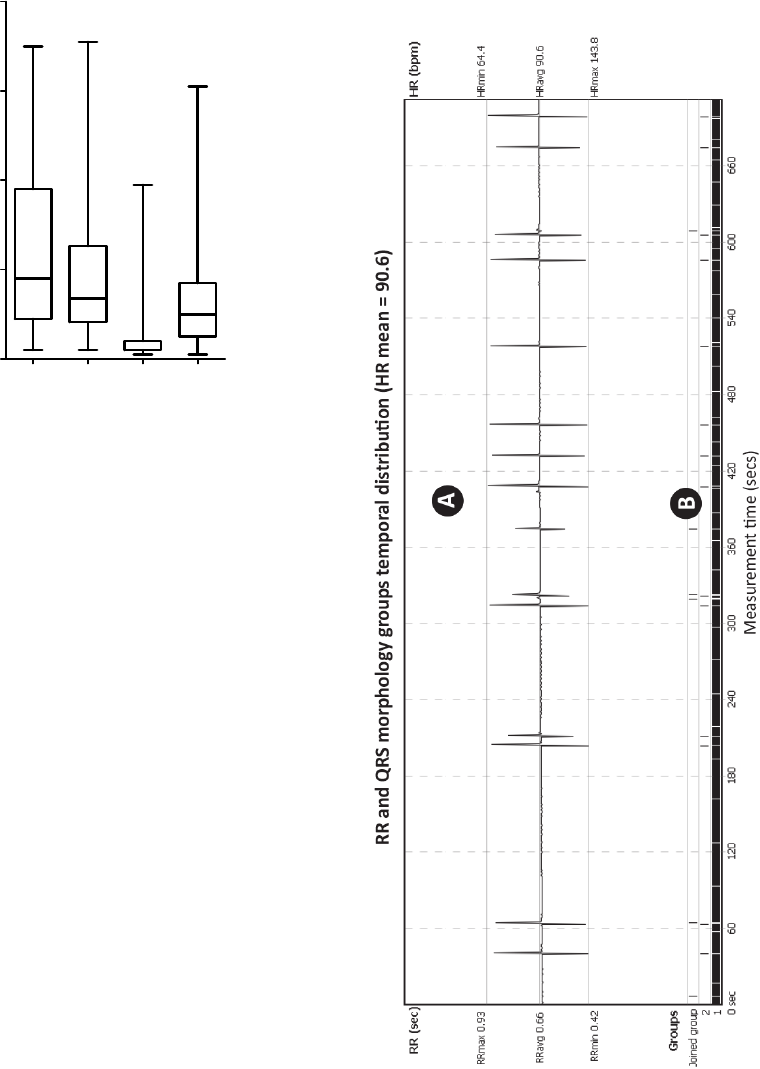
Figure 6: Comparison of number of group count results for
MIT-BIH (median 18), INCART (median 13.5), UHF-
ECG dataset (median 2) using the presented method and
MIT-BIH results (median 10) acquired from (Castro &
Paulo 2014) as the last bar - N
gc
.
4 DISCUSSION
The proposed method is able to categorize QRS
(Fig. 7) in high sampled data (5,000 Hz) and great
bit-depth (26 bits), allowing to see ultra-high
frequency potentials in individual morphology
groups and able to reveal ventricle dyssynchrony as
in Fig. 3. Thanks to the direct comparison among all
of registered QRS this method is able to catch
continuous changes in QRS morphology (which we
encountered while detecting QRS from isolated
hearts).
This is in contrast to building of morphology
template (Breithardt et al., 1991). On the other hand,
due to this behavior the processing time increases to
uncomfortable lengths while processing long (hours)
UHF-ECG recordings.
Figure 7 presents method results, showing
temporal distribution of detected morphology groups
in part of 15-minute record. Such technique may be
used even for standard 6-12 leads ECG.
The legitimacy of using frequencies above usual
300 Hz is shown in Figure 8. Even the currently
used HF frequency range of 150-250 Hz (Fig. 8B)
shows dyssynchrony of specific QRS, it is obvious
that frequency range of 500-1,000 Hz (Fig. 8C)
provides more precise image of ventricles electrical
activation with higher temporal resolution. On the
other hand, range of 1,000-2,000 Hz (Fig. 8D)
brings less evident activity due to significantly lower
signal-to-noise ratio.
Figure 7: Temporal distribution of QRS morphology
groups during the measurement of heart-transplant subject
(UHF-ECG subject 0086). A – RR intervals (beat-to-beat)
excluding beats from Joined Group, B – morphology
groups temporal distribution, where Group 1 (major
occurrence) is a normal QRS, rarely interrupted with
ventricle beats from Group 2. Unrecognized or false
positive QRS complexes are in Joined Group.
MIT-BIH INCART UHF-ECG Ngc
0
20
40
60
80
Number of groups
Multichannel QRS Morphology Clustering - Data Preprocessing for Ultra-High-Frequency ECG Analysis
17
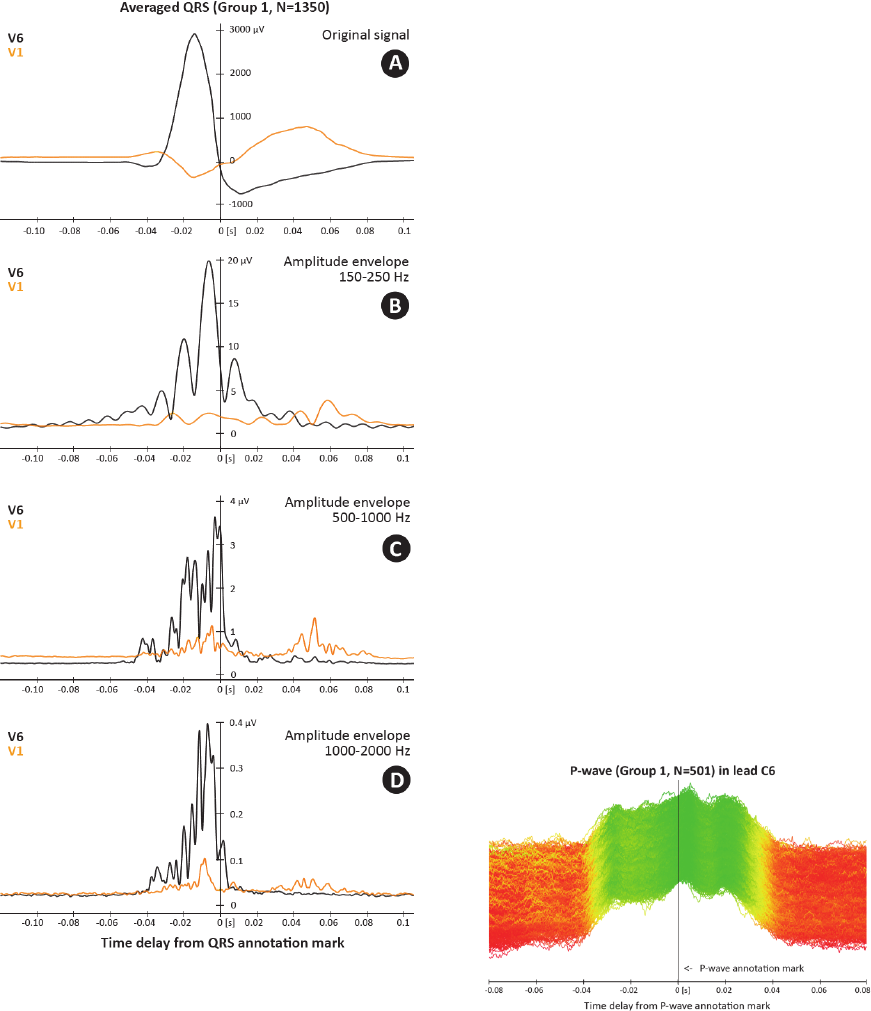
Figure 8: Comparison of averaged QRS shape (N=1350)
in different frequency ranges for leads V1 (orange) and V6
(black). Only QRSs from Group 1 were taken into
account. A – averaged QRS complex, B – amplitude
envelopes in 150-250 Hz, C – amplitude envelopes in 500-
1,000 Hz, D – amplitude envelopes in 1,000-2,000 Hz
(UHF-ECG subject 0086).
Two Physionet databases (MIT-BIH and
INCART) were processed to validate the presented
clustering method and the purity of the clustered
QRS groups was 98.24 % (MIT-BIH) and 99.50 %
(INCART), respectively. This purity shows the level
of correspondence between annotated QRS types
and clustered groups. The median correlation within
Group 1 for the UHF-ECG dataset was 0.997,
showing extremely high overall morphology
stability inside the majority group. In comparison
with an existing clustering method (Castro and
Paulo, 2014) in Fig. 6 and Table 4, our approach
produces a larger number of groups (the median
from the N
g
column is 18, while the median from
N
gc
is 10).
Although the method is designed to work with
specific UHF-ECG data, it can be used in any other
area where the clustering of repetitive signal
formations according to shape is needed (as shown
in figure 9 with P-wave example).
5 CONCLUSIONS
A multichannel clustering method has been
presented as an essential part of UHF-ECG analysis.
The method clusters a list of previously detected
QRS complexes into groups by morphology and
corrects QRS annotation mark positions inside each
group to point to exactly the same location of QRS
shape. This functionality allows averaging of UHF-
ECG envelopes with regard to specific QRS types
and, thanks to annotation jitter reduction, the
averaged UHF envelopes retain the highest possible
amount of detail. Correctly averaged UHF-ECG
envelopes are tested by a related study to reveal
information on heart ventricle dyssynchrony.
Figure 9: Presented clustering method used for clustering
of P-wave. 538 P-waves total, 501 were clustered into
Group 1 and 37 into Joined Group. UHF-ECG subject
0616 with dilated cardiomyopathy.
It is also evident that our method works
significantly better with the UHF-ECG dataset (for
which the method was originally designed) than with
low-resolution data from the MIT-BIH and INCART
databases.
CARDIOTECHNIX 2015 - International Congress on Cardiovascular Technologies
18
The presented method is part of the software
UHF Solver which is used for autonomous
processing of UHF-ECG data to obtain information
about heart ventricle dyssynchrony. Also, the
method has been implemented as a plugin for
SignalPlant, free signal-processing and visualization
software.
ACKNOWLEDGEMENTS
This research was supported by project no.
P102/12/2034 from the Grant Agency of the Czech
Republic and by MEYS CR (LO1212),
its infrastructure by MEYS CR and EC
(CZ.1.05/2.1.00/01.0017) and by ASCR (RVO:
68081731).
REFERENCES
Abboud, S. et al., 1987. Detection of transient myocardial
ischemia by computer analysis of standard and signal-
averaged high-frequency electrocardiograms in
patients undergoing percutaneous transluminal
coronary angioplasty. Circulation, 76(3), pp.585–596.
Amit, G. et al., 2013. High-frequency QRS analysis in
patients with acute myocardial infarction: a
preliminary study. Annals of noninvasive
electrocardiology : the official journal of the
International Society for Holter and Noninvasive
Electrocardiology, Inc, 18(2), pp.149–156.
Breithardt, G. et al., 1991. Standards for analysis of
ventricular late potentials using high-resolution or
signal-averaged electrocardiography. A statement by a
Task Force Committee of the European Society of
Cardiology, the American Heart Association, and the
American College of Ca. Circulation, 83(4), pp.1481–
1488.
Castro, D. & Paulo, F., 2014. A method for context-based
adaptive QRS clustering in real-time. Biomedical and
Health Informatics, IEEE Journal of, PP(99), pp.1–12.
Cuesta-Frau, D., Pérez-Cortés, J. C. & Andreu-García, G.,
2003. Clustering of electrocardiograph signals in
computer-aided Holter analysis. Computer Methods
and Programs in Biomedicine, 72(3), pp.179–196.
Fukunami, M. et al., 1991. Detection of patients at risk for
paroxysmal atrial fibrillation during sinus rhythm by P
wave-triggered signal-averaged electrocardiogram.
Circulation, 83(1), pp.162–169.
Goldberger, A. L. et al., 1981. Effect of myocardial
infarction on high-frequency QRS potentials.
Circulation, 64(1), pp.34–42.
Goldberger, A. L. et al., 2000. PhysioBank, PhysioToolkit,
and PhysioNet: Components of a New Research
Resource for Complex Physiologic Signals.
Circulation, 101(23), pp.215–220.
Haberl, R. et al., 1988. Comparison of frequency and time
domain analysis of the signal-averaged
electrocardiogram in patients with ventricular
tachycardia and coronary artery disease: methodologic
validation and clinical relevance. Journal of the
American College of Cardiology, 12(1), pp.150–158.
Hon, E. H. & Lee, S. T., 1963. Noise reduction in fetal
electrocardiography. American Journal of Obstetrics
& Gynecology, 87(8), pp.1086–1096. Available at:
http://dx.doi.org/10.1016/0002-9378(63)90104-2.
Chang, K.-C. et al., 2005. a Comparison of Similarity
Measures for Clustering of Qrs Complexes.
Biomedical Engineering: Applications, Basis and
Communications, 17(06), pp.324–331.
Jarrett, J. R. & Flowers, N. C., 1991. Electrophysiology ,
Pacing , and Arrhythmia Signal- Averaged
Electrocardiography : History , Techniques , and
Clinical Applications. Clin. Cardiol., 14, pp.984–994.
Jurak, P. et al., 2013. Ultra-high-frequency ECG
Measurement Institute of Scientific Instruments , AS ,
Brno , Czech Republic. Computing in Cardiology
Conference (CinC), 2013, 40, pp.783–786.
Lagerholm, M. & Peterson, G., 2000. Clustering ECG
complexes using hermite functions and self-organizing
maps. IEEE Transactions on Biomedical Engineering,
47(7), pp.838–848.
Moody, G. B. & Mark, R. G., 2001. The impact of the
MIT-BIH arrhythmia database. IEEE Engineering in
Medicine and Biology Magazine, 20(3), pp.45–50.
Plesinger, F. et al., 2014. Robust Multichannel QRS
Detection. Computing in Cardiology Conference
(CinC), 2014, 41, pp.557–560.
Rompelman, O. & Ros, H. H., 1986a. Coherent averaging
technique: a tutorial review. Part 1: Noise reduction
and the equivalent filter. Journal of biomedical
engineering, 8(1), pp.24–29.
Rompelman, O. & Ros, H. H., 1986b. Coherent averaging
technique: a tutorial review. Part 2: Trigger jitter,
overlapping responses and non-periodic stimulation.
Journal of biomedical engineering, 8(1), pp.30–35.
Schlegel, T. T. et al., 2004. Real-time 12-lead high-
frequency QRS electrocardiography for enhanced
detection of myocardial ischemia and coronary artery
disease. Mayo Clinic proceedings. Mayo Clinic, 79(3),
pp.339–350.
Simson, M. B., 1983. Clinical application of signal
averaging. Cardiol Clin, 1(1), pp.109–119. Available
at: http://www.ncbi.nlm.nih.gov/pubmed/6399988.
Spackman, T. N., Abel, M. D. & Schlegel, T. T., 2005.
Twelve-lead high-frequency QRS electrocardiography
during anesthesia in healthy subjects. Anesthesia and
Analgesia, 100(4), pp.1043–1047.
Multichannel QRS Morphology Clustering - Data Preprocessing for Ultra-High-Frequency ECG Analysis
19
