In Vivo Charge Injection Limits Increased after ‘Unsafe’ Stimulation
Suzan Meijs
1
, Søren Sørensen
2
, Kristian Rechendorff
2
and Nico Rijkhoff
1
1
Center for Sensory-Motor Interaction, Aalborg University, Fredrik Bajersvej 7D, Aalborg, Denmark
2
Danish Technological Institute, Kongsvangs Alle 29, Århus, Denmark
Keywords: Electrical Stimulation, Charge Injection, Implantable Neural Prosthesis.
Abstract: The effect of unsafe stimulation on charge injection limits (Q
inj
) and pulsing capacitance (C
pulse
) was inves-
tigated. Four stimulation protocols were applied: 20 mA – 200 and 400 Hz, 50 mA – 200 and 400 Hz. In-
creasing Q
inj
and C
pulse
were observed for all stimulation protocols. Corrosion was not observed with any of
the stimulation protocols and no tissue damage was observed for the 20 mA – 200 Hz stimulation group.
This indicates that the ‘safe potential window’ may not be applicable in vivo, as no damage was done stimu-
lating with 20 mA at 200 Hz, while damage was done using the same current at 400 Hz.
1 INTRODUCTION
The performance of stimulation electrodes can be
characterized by their charge injection limits (Q
inj
).
The amount of charge that can be injected safely
without causing electrode degradation or tissue
damage depends on the electrode material, the elec-
trolyte and the stimulation waveform. Typically, the
potential limits for safe stimulation are determined
under near steady-state conditions using the cyclic
voltammogram (CV). The CV reveals how the elec-
trode material interacts with the electrolyte or the
tissue at stepwise in- and decreasing potentials. The
safe potential window typically is defined by the
potentials at which water reduction and oxidation
occurs. (Cogan, 2008)
The safe potential window and Q
inj
are typically
reported under in vitro conditions, in inorganic
saline solution. Both the safe potential window
(Meijs, submitted), as well as Q
inj
(Kane, 2013; Wei
and Grill, 2009; Meijs, submitted) differ under in
vivo circumstances. Furthermore, Q
inj
and electrode
polarization change during the course of the
implanted period (Kane, 2013; Lempka, 2009;
Meijs, submitted).
In order to investigate the reliability of the in
vivo charge injection limits, electrical stimulation
was performed for 6 hours in anesthetized animals
using charges that exceeeded Q
inj
. Six hours of
stimulation at 200 Hz using a 20 mA current caused
no tissue or electrode damage during a pilot study
and this was therefore used as the least intense
stimulation paradigm. Three other stimulation
paradigms were added by doubling the frequency
and increasing the current to the maximum
stimulator output (50 mA). During stimulation
voltage transients (VT) were recorded and charge
injection limits were measured before, during and
after the stimulation period.
2 METHODS
Four pigs were implanted with 4 porous TiN work-
ing and 4 pseudo-reference electrodes of the same
material each. The work was carried out according
to Danish legislation (ethical approval license nr:
2014-15-0201-00268).
2.1 Electrode Fabrication
TiN coatings were deposited on Ti6Al4V electrode
pins (6 mm
2
) and Ti disks (1000 mm
2
) by reactive
magnetron sputtering on a CC800/9 SiNOx coating
unit (CemeCon AG, Germany). The electrodes were
mounted on a rotating stage, which carried out a
three-fold planetary rotation. Sputtering was done
from four Ti targets (88 x 500 mm
2
) with 99.5%
purity in a Ar/N
2
mixture atmosphere. The purity of
both gases was 99.999%. An ETFE coated 35N LT
wire (Heraeus, Switzerland) was crimped to the
hollow end of the electrode pins. The pins were
insulated using a PEEK body with silicone tines,
which were glued to the pins. The electrodes were
Meijs, S., Sørensen, S., Rechendorff, K. and Rijkhoff, N..
In Vivo Charge Injection Limits Increased after ’Unsafe’ Stimulation.
In Proceedings of the 3rd International Congress on Neurotechnology, Electronics and Informatics (NEUROTECHNIX 2015), pages 101-105
ISBN: 978-989-758-161-8
Copyright
c
2015 by SCITEPRESS – Science and Technology Publications, Lda. All rights reserved
101
cleaned thoroughly before e-beam sterilization.
2.2 Surgical Procedure
The animals were first sedated and then anesthetized
with a bolus injection of propofol. Anesthesia was
maintained using propofol infusion. The electrodes
were implanted in tight pockets in the subcutaneous
adipose tissue on the back. The percutaneous elec-
trode wires were encased in surgical tape, which was
sutured to the skin. The electrodes were not used for
one month until the pigs were anesthetized again
using sevofluran to perform electrical stimulation.
2.3 Electrical Stimulation
Biphasic, charge balanced 200 µs square pulses were
applied, cathodic first with an inter-phase interval of
40 µs during which no current was applied. Stimula-
tion was performed for 6 hours, which was divided
into 3 2-hour sessions. Before, between and after
these sessions, Q
inj
were determined for each elec-
trode. Four stimulation paradigms were applied:
20 mA, 200 Hz
20 mA, 400 Hz
50 mA, 200 Hz
50 mA, 400 Hz
Electrical stimulation was performed using DS5
(Digitimer, UK), which was shorted between the
pulses. VT were recorded using an oscilloscope. Q
inj
were measured using the VersaSTAT 3 potentio-
galvanostat (Princeton Applied Research, USA).
The pulsing capacitance (C
pulse
) was computed
using the slope (
of the VT:
I
stim
= C
pulse
(1)
Where I
stim
is the stimulation current. Q
inj
was calcu-
lated using the current at which the safe potential
limits (-0.6 and 0.9 V) were reached (I
max
):
(2)
Where t is the duration of the stimulation pulse (200
µs) and A is the geometrical surface area of the
electrodes (6 mm
2
). When voltage excursions ex-
ceeded machine limits (±10 V), I
max
was extrapolat-
ed from the highest current using a linear relation.
(3)
Where V
m
and I
m
were the measured potential and
current, respectively, and V
ex
and I
ex
were the ex-
trapolated potential and current. When V
ex
reached
the potential limits, I
ex
was used as I
max
in (2). This
method provided accurate results using data for
which I
max
was measured.
2.4 SEM/EDX
SEM (Nova 600, FEI Company) images were rec-
orded at various magnifications to investigate the
surface structure of the electrodes. EDX (EDAX,
AMETEK) spectra were made to determine if there
the surface chemistry of the electrodes changed.
3 RESULTS
During the measurements the shorting part of the
setup broke down, and the last two stimulation ses-
sions could not be done with one of the electrodes in
the 20 mA – 400 Hz group.
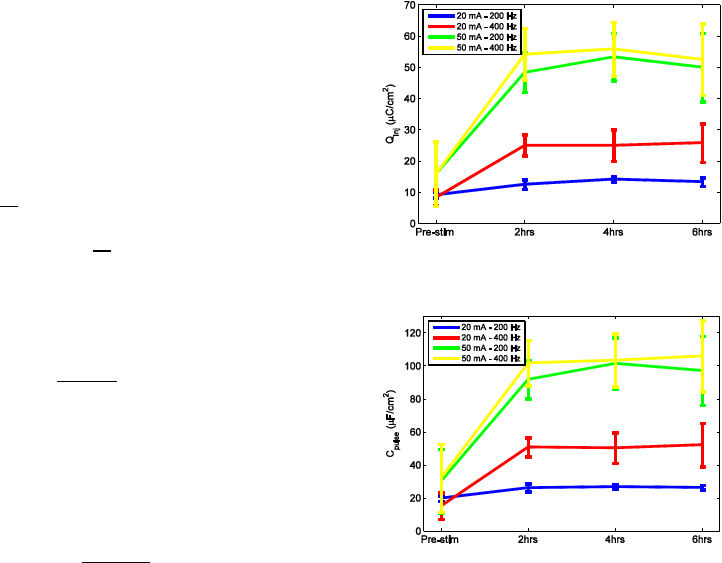
The average Q
inj
of all implanted electrodes be-
fore stimulation was 12.3 ± 1.4 µC/cm
2
. After 2hrs
of stimulation Q
inj
was increased for all of the indi-
vidual electrodes (Fig. 1) and the largest increase
was observed for the group 4.
Figure 1: Q
inj
was increased after the first stimulation
session. It then remained stable for each electrode group.
Figure 2: C
pulse
was increased after the first stimulation
session. It then remained stable for each electrode group.
NEUROTECHNIX 2015 - International Congress on Neurotechnology, Electronics and Informatics
102
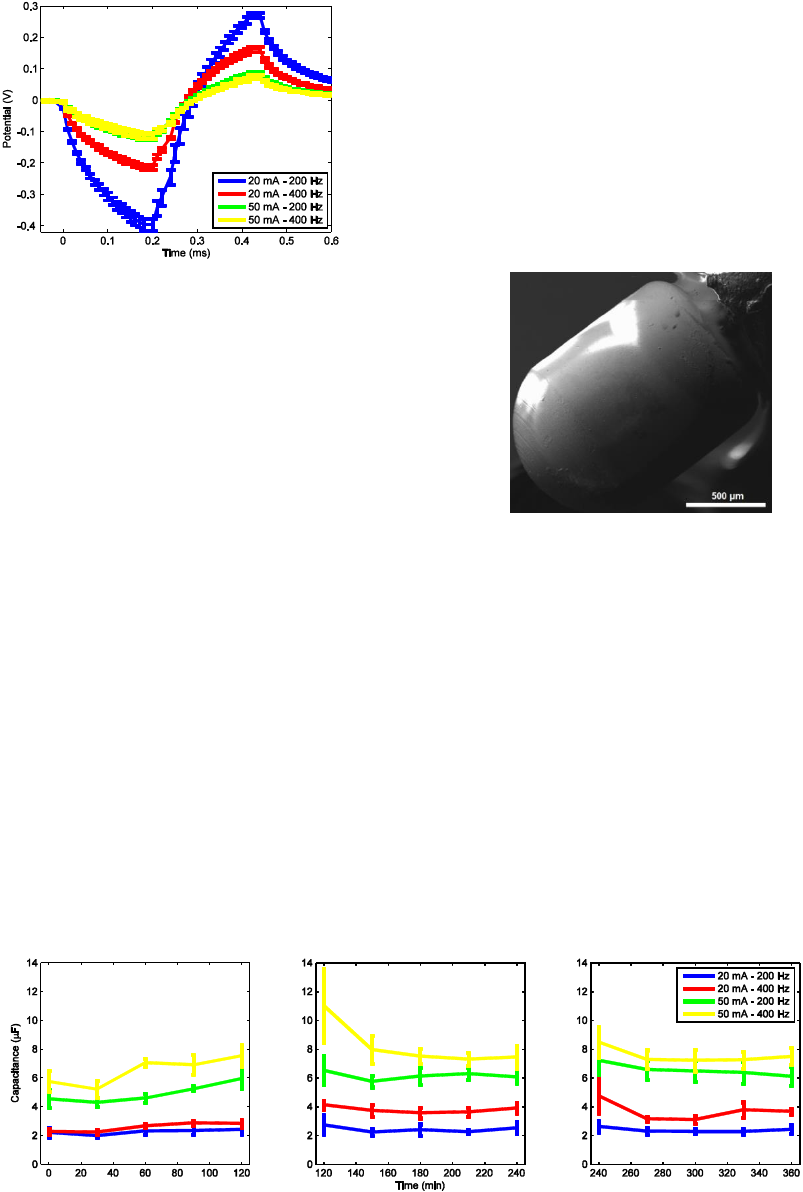
Figure 3: After 2 hrs of stimulation, the slopes of electrode
groups were decreased with increased charge injection,
due to the increased C
pulse
.
The average C
pulse
of all implanted electrodes be-
fore stimulation was 24 ± 2 µF/cm
2
. Fig. 2 shows an
increase of the average C
pulse
of all electrodes by
approximately the same relative amount as Q
inj
. Fig.
3 shows that the slopes of the VTs were decreased
due to the higher C
pulse
after 2 hours of stimulation.
Analysis of the VT during the stimulation ses-
sions showed that C
pulse
increased after the first 30-
60 minutes of the first stimulation session, but it did
not increase during the second or third session (fig.
4). Furthermore, C
pulse
was increased for all stimula-
tion groups as compared to C
pulse
derived using a
safe stimulation current (fig. 2). C
pulse
was also sig-
nificantly higher at 50 mA than at 20 mA.
SEM showed that the electrode surfaces were in-
tact after 6 hours of intense stimulation. Similar
levels of oxide were observed on all electrodes using
EDX.
4 DISCUSSION
Although Q
inj
increased from the initial level de-
pending on the stimulation current and frequency,
the charge injection was always higher than Q
inj
.
Above this theoretical limit, tissue and/or electrode
damage is expected (Cogan, 2008). Neither of these
was observed for the electrodes stimulated at 20 mA
– 200 Hz. Increasing levels of tissue damage were,
however, observed with increasing charge injection
in accordance with findings of Mortimer (1980).
Tissue damage was due to the accumulation of a
reaction product to detrimental concentrations or pH
changes beyond the buffering capacity of the tissue,
as heat damage, the mass action theory and corro-
sion were ruled out (Shannon, 1992; Merrill, 2005).
Figure 5: SEM image of an electrode from group 3.
Most plausible seem changes in the pH, as water
reduction occurs in saline at -0.6 V for TiN, result-
ing in increased levels of OH
-
. Electrode potentials
were below -1 V for all electrodes at the start of the
first stimulation session. Water reduction is likely to
have contributed to charge transfer during all stimu-
lation protocols, as C
pulse
derived from the voltage
transients during the stimulation sessions (0 min in
fig. 4) was doubled for 20 mA electrodes and more
than tripled for the 50 mA – 400 Hz electrodes as
compared to C
pulse
derived at 1 mA (pre-stim in fig.
2). This is likely due to the transfer of charge via
water reduction, which is a faradic process and does
not increase the electrode potential (Merrill, 2005).
No complete levelling off of the potential was ob-
served, however.
Figure 4: C
pulse
increased during the first stimulation session for electrodes for which tissue damage was observed.
In Vivo Charge Injection Limits Increased after ’Unsafe’ Stimulation
103
Furthermore, the slope of the voltage transients
decreased towards the end of the cathodic phase,
indicating that at increasing cathodic potentials,
water reduction contributes more to the total charge
transfer (Merrill, 2005). This trend was observed
primarily during the first 30-60 minutes for the elec-
trode groups for which damage was observed, but
not for the 20 mA – 200 Hz group. After 30-60
minutes, the decrease in slope was less and it re-
mained stable throughout the rest of the study. This
makes it plausible that tissue damage due to stimula-
tion induced pH changes occurred during the first
30-60 minutes of stimulation, which fits well with
the pH changes observed in saline as a function of
time (Mortimer, 1980).
The increase in capacitance that is observed after
30-60 minutes (fig. 4) for the electrode groups with
tissue damage is likely due to destruction of the
fibrous capsule. This removes the diffusion limita-
tion, which typically limits the charge injection
capacity of implanted electrodes (Cogan, 2008). Q
inj
and C
pulse
derived at safe stimulation levels (fig. 1
and 2) were increased more for electrode with than
without tissue damage.
Electrode damage was not observed, though the
average anodic potentials were above 1 V for all
electrode groups and potentials of more than 2 V
have been observed in all groups, except 20 mA –
400 Hz. Oxidation of the TiN surface into a thin
oxide/oxynitride film occurs at 0.5-0.9 V. These
processes lead to passivation and protect the under-
lying TiN from further oxidation. At higher anodic
potentials (1-1.5 V) oxidation of the the TiN into
hydroxide and/or TiO
2
occurs. Lastly, at potentials
higher than 2 V, which have been observed in this
study, oxygen evolution takes place accompanied by
oxidation of TiN to TiO
2
. (Avasarala, 2010) There
are three reasons why we may not have detected
increasing levels of oxide with increasing charge
injection. 1) The oxidation reaction is reversed dur-
ing the cathodic phase (Merrill, 2005). 2) The oxide
has dissolved in the acidic environment (Avasarala,
2010) that was created due to intense electrical stim-
ulation (Merrill, 2005). 3) The oxide levels on all
electrodes are below the detection limit for EDX.
The increase in Q
inj
and C
pulse
when no tissue
damage occurred is in accordance with a decrease in
polarization resistance observed for cochlear im-
plants (Tykocinski, 2005; Newbold, 2014) and a
decrease in complex impedance of deep brain stimu-
lation electrodes before and after stimulation
(Lempka, 2009). Newbold (2014) argues that the
stimulation induced changes are confined to the
electrode tissue interface and that protein ad- and
desorption may be responsible for them, as they saw
no changes in the voltage drop that is due to resistive
properties of the tissue (IR drop). For the 20 mA –
200 Hz group, there were no changes in IR drop and
no tissue damage. For all other electrode groups,
however, tissue damage was observed, as well as a
decrease in IR drop.
All electrodes were capable of the same charge
injection before stimulation was started yet tissue
damage occurred in the 20 mA – 400 Hz group, but
not in the 20 mA – 200 Hz group. This shows that a
safe stimulation protocol for implanted electrodes is
not only established by keeping within a certain
potential window (Merrill, 2005) and that the ‘safe’
window is not necessarily applicable in vivo. Safe
stimulation also depends on the stimulation frequen-
cy, as this limits the time of the tissue to restore the
pH (Ballestrasse, 1985). There may be a safe amount
of charge that can be injected regardless of the fre-
quency. It is, however, difficult to determine this
amount, as a purely linear voltage change was not
observed even within the theoretical ‘safe window’.
It would therefore be interesting to investigate
whether tissue damage occurs using ‘safe’ stimula-
tion currents at very high frequencies.
ACKNOWLEDGEMENTS
The authors would like to thank the staff at the bio-
medical laboratory at Aalborg University Hospital
and Jetske van Breda, Alana Gerhardt and Maria
Alcaida for assistance during the surgeries.
REFERENCES
Avasarala, B. and Haldar, P., 2010 Electrochemical oxida-
tion behavior of titanium nitride based electrocatalysts
under PEM fuel cell conditions Electrochim Acta vol.
55 pp. 9024–9034.
Ballestrasse, C. L., Ruggeri, R. T. and Beck, T. R., 1985.
Calculations of the pH changes produced in body tis-
sue by a spherical stimulation electrode Ann. Biomed.
Eng. vol. 13 pp. 405-424.
Cogan, S. F., 2008. Neural stimulation and recording
electrodes Ann. Rev. Biomed. Eng. vol. 10 pp. 275-
309.
Kane, S. R. et al., 2013. Electrical performance of pene-
trating microelectrodes chronically implanted in cat
cortex IEEE Trans. Biomed. Eng. vol. 60 pp. 2153-
2160.
Lempka, S. F. et al., 2009. In vivo impedance spectrosco-
py of deep brain stimulation electrodes J. Neural Eng.
vol 6.
NEUROTECHNIX 2015 - International Congress on Neurotechnology, Electronics and Informatics
104
Meijs, S. et al., 2015. “Electrochemical properties of
titanium nitride nerve stimulation electrodes: an in
vitro and in vivo study” Front. Neurosci. vol. 9 art.
268.
Merrill, D. R., Bikson, M. and Jefferys, J. G. R., 2005.
Electrical stimulation of excitable tissue: design of ef-
ficacious and safe protocols J. Neurosci. Meth. vol.
141 pp. 171-198.
Mortimer, J. T., Kaufman, D. and Roessmann, U., 1980.
Intramuscular electrical stimulation: Tissue damage
Ann. Biomed. Eng. vol. 8 pp. 235-244.
Newbold, C. et al., 2014. Impedance changes in chronical-
ly implanted and stimulated cochlear implant elec-
trodes Cochlear Implants Int. vol. 15 pp. 191-199.
Shannon, R. V., 1992. A model of safe levels for electrical
stimulation IEEE Trans. Biomed. Eng. vol. 39 pp. 424-
426.
Tykocinski, M, Cohen, L. T. and Cowan, R. S., 2005.
Measurement and analysis of access resistance and po-
larization impedance in cochlear implant recipients
Otol. Neurotol. vol. 26 pp. 948-956.
In Vivo Charge Injection Limits Increased after ’Unsafe’ Stimulation
105
