A Poll Oriented Classifier for Affective Brain Computer Interfaces
Daniela Iacoviello
1
, Naixia Pagnani
2
, Andrea Petracca
2
, Matteo Spezialetti
2
and Giuseppe Placidi
2
1
Department of Computer, Control and Management Engineering Antonio Ruberti, Sapienza University of Rome,
Via Ariosto 25, 00185 Rome, Italy
2
A
2
VI-Lab, c/o Department of Life, Health and Environmental Sciences, University of ĽAquila,
Via Vetoio, 67100 ĽAquila, Italy
Keywords: Brain Computer Interface, Classification, Emotions, Disgust, Pleasantness, Olfactory Memory.
Abstract: Affective Computing and Brain Computer Interface (BCI) are two innovative and rapidly growing fields of
research. Affective Computing aims at equipping machines with the human capabilities of observe,
understand and express affecting features; BCI aims at discovering novel communication channels and
protocols, through the monitoring of the brain activity. Emotion recognition plays a central role in both
these research fields. In this work we present an EEG poll based classification algorithm for self-induced
emotional states used for BCI. We tested the approach using three emotions: the disgust produced by
remembering an unpleasant odor (a stink), the pleasantness induced by the memory of a fragrance and a
relaxing state. Preliminary experimental results are also reported.
1 INTRODUCTION
Recent years have been characterized by an
exponential evolution of the interaction and
communication protocols between humans and
computer. Until a short time ago a keyboard
represented the only input channel to the computer:
nowadays, digital devices can understand body
gestures, speech, facial expressions, etc. An
emerging branch of the Human Computer
Interaction (HCI) is the Affective Computing
(Picard, 2000).
Since emotions play a lead role in the daily life,
machines equipped with empathic capabilities
represent, at the same time, a necessary step and a
fascinating challenge. Emotions can be recognized
from different sources: tone of voice, facial
expressions, gestures and physiological responses
such as the heart rate and/or the cerebral activity.
The latter, especially monitored by means of
electroencephalography (EEG), has been widely
investigated in order to classify emotional states
(Choppin, 2000; Chanel et al., 2006; Bos, 2006;
Zhang and Lee, 2009; Wang et al., 2014). In these
studies, typically emotions were elicited by external
stimuli such as video or images.
The analysis of the brain activity due to the
emotions can be applied also to the design of a BCI.
A BCI offers the user an alternative communication
toward the external environment, based on analyzing
the brain activity (Wolpaw and Wolpaw, 2012), and
can be an essential tool for people who have lost the
standard modalities for communication due to severe
disabilities.
Besides the classical types of stimulation, in
particular sensory-motor (Bin He, 2014), visual
(Xiaorong et al., 2003), or auditory (Furdea et al.,
2009), a BCI can be also implemented by using
emotions as stimulation tasks. Though to use
emotions could appear strange, for some patients
this stimulation is the only usable, due to the fact
that other modalities have proven to be ineffective or
are not recommended (for example, rapidly-varying
visual stimulation could produce seizures).
Understanding the effect on the brain activity
generated by an emotional state can be used both to
adapt the system response to the emotional
variations, e.g. to detecting and/or to removing the
emotional bias, and to allow the user to drive the
BCI through emotion modulation (Molina et al.,
2009).
The latter situation can be obtained in two ways:
1) by eliciting the emotions through an external
input (Bos, 2006);
2) by using a self-inducing strategy.
Obviously, the second strategy is preferable since it
does not require any additional equipment, leaving
the user free to choose how and when activate a
Iacoviello, D., Pagnani, N., Petracca, A., Spezialetti, M. and Placidi, G..
A Poll Oriented Classifier for Affective Brain Computer Interfaces.
In Proceedings of the 3rd International Congress on Neurotechnology, Electronics and Informatics (NEUROTECHNIX 2015), pages 41-48
ISBN: 978-989-758-161-8
Copyright
c
2015 by SCITEPRESS – Science and Technology Publications, Lda. All rights reserved
41
given emotional state. On the other side, this
strategy often produces low-amplitude (noisy)
signals that could lead to blurry interclass
boundaries.
For this reason, efficient classification strategies
have to be explored (Liu et al., 2010; Placidi et al.,
2015a; Placidi et al., 2015b, Iacoviello et al., 2015).
Placidi et al., (2015a) described an algorithm
tailored to detect the disgust produced by
remembering unpleasant odors (self-induced
disgust). In the present work, an extension of that
classification method, by introducing a poll-based,
was proposed.
We tested the proposed approach in two ways:
by trying to detect, separately, two different
emotions (the disgust caused by remembering an
unpleasant odor and the pleasantness due to the
memory of a fragrance, with respect to a relaxing
situation); by classifying EEG signals searching the
three emotional states at the same time (including
relax).
The paper is structured as follows: Section 2
details the acquisition set up and proposes the new
poll system approach; Section 3 describes the data
analysis and reports the classification results;
Section 4 concludes the paper and indicates future
developments.
2 MATERIALS AND METHODS
The acquisition set up along with the experimental
protocol used to acquire the EEG signals is
presented herein. After a brief summary of the
emotion detection algorithm presented by Placidi et
al., (2015a), the proposed poll system approach is
outlined.
2.1 Acquisition Set Up and
Experimental Protocol
In the experimental step, we aimed at classifying
three different emotional states: the disgust
associated to remembering an unpleasant odor, the
pleasant sensation evoked by remembering a good
fragrance and a relaxing state (the absence of
previous states). In terms of Valence-Arousal model
(Russell, 1979), the two olfactory emotions have
different level of arousal (the disgust is stronger) and
opposite valence.
The emotional tasks that we aimed to detect had
to be suitable to drive a BCI and self-inducible.
Preliminary experiments consisted in the
collection of EEG data from two healthy, male and
right-handed subjects (29 and 32 years old,
respectively).
The experiments took place in a quiet, lighted
room and the examined subjects were sat on a
comfortable armchair. The experiments consisted in
showing a sequence of symbols on a pc monitor,
each presented for 3.66 seconds. Three symbols
were used: a cross, indicating that the subject had to
relax; a down arrow, meaning that the subject had to
concentrate himself on the memory of a stink; an up
arrow, meaning that the subject had to remember a
fragrance.
Three acquisition sessions were performed for
each subject. In the first session, S
1
, a sequence of
108 symbols, composed by 54 crosses (relax) and 54
down arrows (disgust), was presented in a random
order. In the second session, S
2
, 54 crosses (relax)
and 54 up arrows (pleasure due to remembering a
fragrance) composed the sequence. The last session,
S
3
, consisted in the display of a sequence made of 25
occurrences for each of the three symbols, for a total
of 75 symbols.
We used the Enobio
NE
system (Neuroelectrics,
2015), an 8-channels wireless EEG equipment, to
record the subjects’ brain activity. This hardware
collects signals at 500 Hz, 24 bit in amplitude
resolution (corresponding to 0.05 uV). The
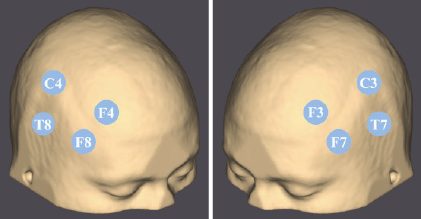
electrodes were placed in the positions T8, C4, F4,
F8 and their symmetrical T7, C3, F4, F8 of the 10-
20 international positioning system (Figure 1).
Figure 1: Electrodes montage locations respect to the 10-
20 international system.
Sequences visualization and data collection were
performed by using the BCI2000 framework
(Schalklab, 2015); data analysis was performed by
using Matlab
®
(Mathworks, 2015) scripts
implementing the proposed classification technique
described below.
2.2 Brief Review of the Adopted Binary
Classification Algorithm
In the original binary classification algorithm, the
NEUROTECHNIX 2015 - International Congress on Neurotechnology, Electronics and Informatics
42
signals were filtered with a band-pass filter to
maintain just the bands of frequencies 8-12 Hz and
30-42 Hz. These two bands mainly contain the
cerebral activity due to concentration, the former,
and that due to emotions, the latter (Li and Lu,
2009). Moreover, being the algorithm designed for a
negative emotion classification, the set of channels
considered for the classification were P4, C4, T8 and
P8 (Niemic and Warren 2002; Henkin and Levy
2001).
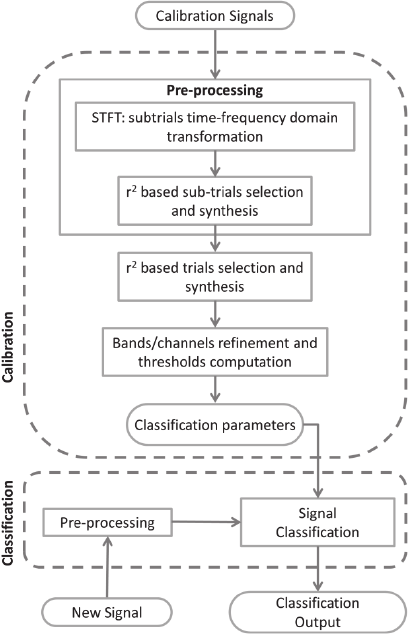
The method consisted of two phases, Calibration
and Classification (Figure 2). The Calibration started
from a set of trials (signals) belonging to two known
classes (i.e. activation, by imagining a disgusting
odor, and non-activation, or relaxing), used to train
the system. The Classification guessed the class of
an incoming unknown signal.
Figure 2: Flow-chart of the binary classification algorithm.
The output of the Calibration Phase characterizes the
Classifier.
In both phases the trials followed a preprocessing
step in which the Short-Time Fourier Transform was
applied to split each signal into a set of partially
overlapping segments (or sub-trials) and to obtain
their frequency coefficients. Then, the mutual
similarity between sub-trials was evaluated by
means of the r
2
computation (Draper and Smith
1998). From a comparison of the power spectrum of
each sub-trial, the more similar were averaged
together, the others were discarded.
After the pre-processing step, an r
2
based
selection and synthesis was performed again
between each trial belonging to the same class. In
this way, the information of a synthetized trial was
obtained for both classes. The r
2
evaluation was used
to identify the frequencies where the differences
between activation and non-activation trials were
larger.
The Classification phase analyzed a signal of an
unknown class. First, the pre-processing phase used
also for the Calibration, was applied. Then, the
resulting spectrum was compared, in terms of r
2
,
with those synthetized in the Calibration phase for
the activation and the non-activation stages. The
values assumed in the chosen frequencies were
compared with the defined thresholds to obtain the
Classification output for the current signal. The
present method had the advantage of giving a very
good accuracy level (more than 90%), despite the
quality of the signals, and made robust the
classification process.
However it had the following drawbacks: the
considered channels were predetermined as well as
the considered frequencies bands and, more
important, the contributions of the channels were
averaged together, thus reducing the spatial
resolution.
2.3 Emotion Detector Generalization
To generalize the binary classification algorithm it
has been observed that since the power spectra of all
analyzed channels were averaged together, only
channels exhibiting synchronous activation were
suitable for this approach. Conversely, if two or
more channels had different behavior
(synchronization at different frequencies or bands),
this approach could weaken their contributions.
For this reason, we designed our approach by
managing both these situations. The main idea was
that, by testing different combinations of frequency
bands and subsets of channels with the original
algorithm, it could be possible to find the more
distinctive with respect to the target emotions and to
perform a classification that could take advantage
from all contributes.
To this aim, we modified the hypothesis of the
original algorithm as follows:
1) the considered bands of frequencies remained
A Poll Oriented Classifier for Affective Brain Computer Interfaces
43
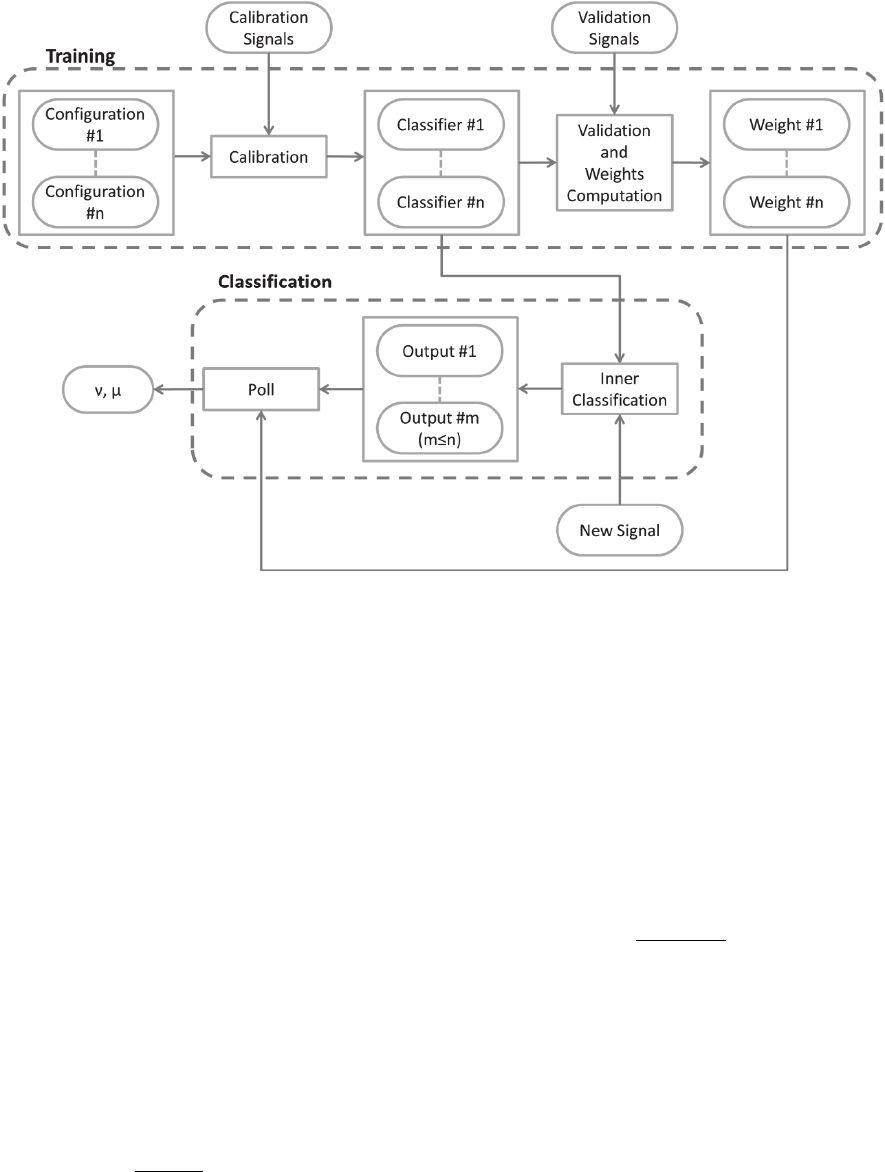
Figure 3: Flow-chart of the poll based algorithm.
two, but the couple of frequencies could be
chosen into a larger intervals (frequency
resolution was 1 Hz);
1) the measured channels were analyzed separately
in order to ensure that only the most significant
were considered.
The proposed poll-based algorithm consisted of two
phases, Training and Classification, (Figure 3).
The Training phase took as input a set of known,
labelled, trials (Calibration Signals) and a group of n
Configurations (c
1
,…,c
n
), each specifying the
frequency bands and the set of channels that had to
be analyzed. The first step consisted in the
application of the Calibration phase of the original
algorithm n times (one for each Configuration),
resulting in n Classifiers (each characterized by the
Classification Parameters reported in Figure 2).
Then, another set of labelled trials was used
(Validation Signals) as input for the Classifiers. In
this way, it was possible to compute the resulting
poll weight of the k-th Classifier, as follows:
0
1
(1)
where α
k
∈ [0,1] was the accuracy of the k-th
Classifier, evaluated on the validation set (Fig.3) and
τ ∈ [0,1] was a minimum accuracy threshold whose
value depended on the cardinality of the dataset used
for the classifier validation.
In the Classification Phase, a new unclassified
trial was processed by the Inner-classification step,
(i.e. the Classification phase of the original
algorithm), for each of the m Classifiers that had
weights (Eq.1) greater than 0. Considering the Inner-
classification binary output µ
k
(0 corresponded to the
absence of the target emotion, 1 to its presence), it
was possible to compute the whole Classification
confidence value ν:
∑
∑
(2)
and the corresponding Classification output:
00.5
10.5
(3)
2.4 Three Classes Poll System
Approach
In order to classify two emotions (with three
possible classes: (E
A
) first emotion, (E
B
) second
emotion or (E
C
) absence of both the previous
emotions), it was possible to build a Classifier that
NEUROTECHNIX 2015 - International Congress on Neurotechnology, Electronics and Informatics
44
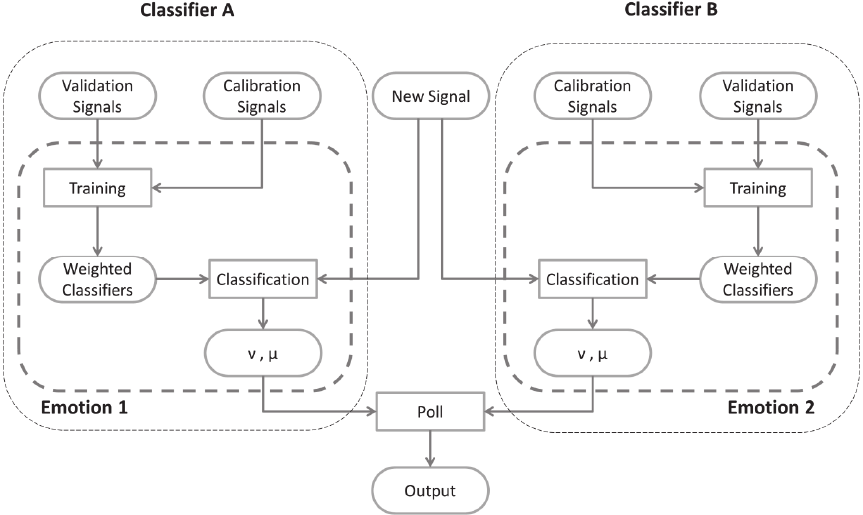
Figure 4: Flow-chart of the poll based algorithm extended to the three classes case.
was the composition of two emotions’ detectors. The
underlying process, based on a higher order polling
system, is reported in Figure 4.
First, two distinct poll based classifiers were
trained and validated as described for the single
emotion case (subsection 2.2), in order to obtain a
set of Weighted Classifiers for both the emotions.
When an unknown trial had to be classified, it was
analyzed by both. Let A and B be the classifiers for
two emotions; four possible cases could occur:
neither A nor B detected their target emotions
(µ
A
=0, µ
B
=0): this case had output E
c
A detected its emotion but B did not (µ
A
=1,
µ
B
=0): this case had output E
A
(first emotion)
B detected its emotion but A did not (µ
A
=0,
µ
B
=1): this case had output E
B
(second emotion)
both A and B detected their emotions (µ
A
=1, µ
B
=1):
in this case the confidence values ν
A
and ν
B
were
compared. The chosen emotion was the one having
greater confidence value. If both classifiers gave the
same confidence value, the classifier was unable to
choose (very improbable).
3 NUMERICAL RESULTS AND
DATA ANALYSIS
By using the acquired data, three studies were
carried out, one for each session. In the first two, the
aim was to train and test the emotion detector for the
memory related to disgust (E1) and to the pleasant
sensation induced by fragrance imagination (E2),
respectively, with respect to the relax (E3).
In the last, the three states were classified at the
same time, using the approach of the composite poll
system.
The configurations used in the training phases
were the following: each trial, whose duration was
3.66 seconds (1830 samples), was divided in four
segments of 0.96 seconds (480 samples), with an
overlap of 0.06 seconds (30 samples). After the r
2
mutual computation, the best two segments were
maintained. Eight configuration sets (c
1
,…c
8
), each
composed by a single channel (respectively T8, C4,
F4, F8, T7, C3, F3, F7), were used. All
configurations considered the 30-42 Hz and the 8-12
Hz bands.
For the current number of trials composing a
sequence, we set τ = 0.67 (a value which was
significantly higher than the chance value of 0.5 for
a binary choice).
3.1 Study 1 – Unpleasant Odor
Recognition
From S
1
, a set made of 8 trials (corresponding to 4
crosses and 4 down arrows) was used for
A Poll Oriented Classifier for Affective Brain Computer Interfaces
45
Calibration. The Validation phase was performed on
a set of 50 trials equally distributed between the
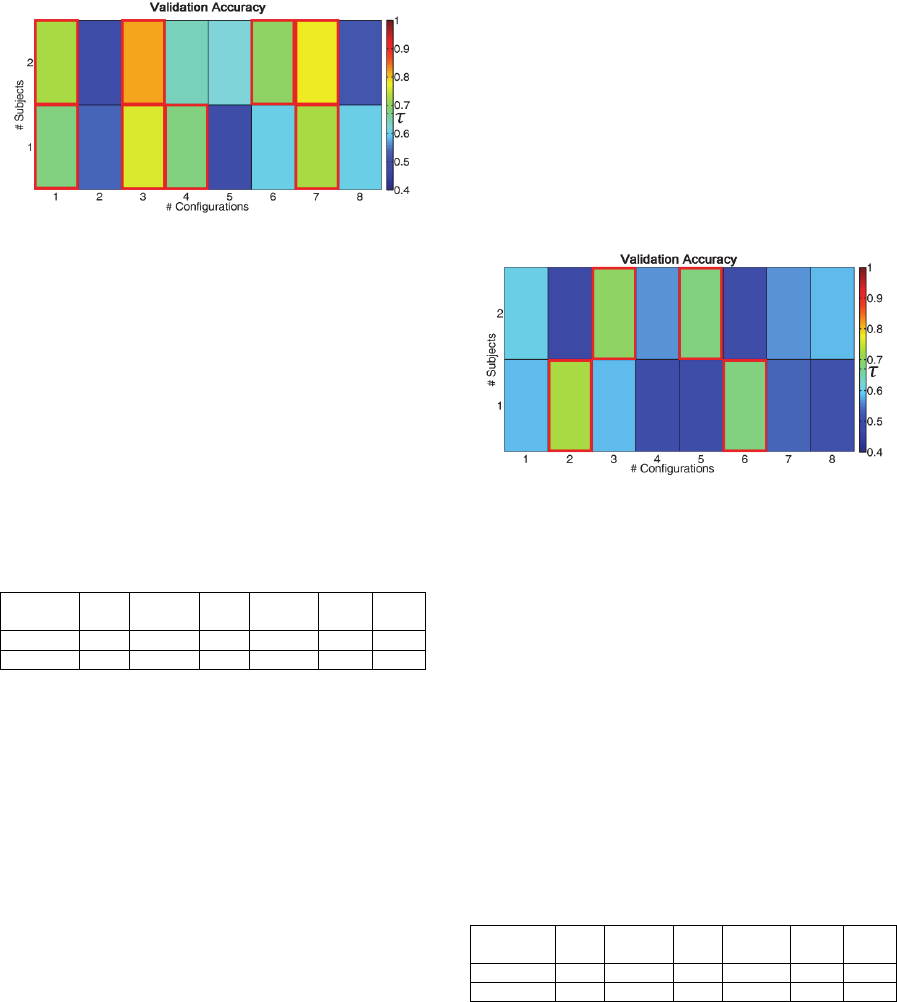
unpleasant odor (E1) and to relax (E2). As shown in
Figure 5, the validation phase, in both subjects,
found 4 channels whose accuracy was higher than τ.
For the first subject, T8 (with accuracy value α =
0.68), F4 (α = 0.76), F8 (α = 0.68) and F3 (α = 0.72)
were the best, while, for the second subject, T8 (α =
0.72), F4 (α = 0.82), C3 (α = 0.7) and F3 (α = 0.78)
overcome τ.
Figure 5: Validation accuracy for disgust/relax detection.
Configurations with red borders had an accuracy value
greater than the threshold and were chosen for the poll
phase.
The Test phase, performed on the set composed
by the remaining 50 trials from the first sequence,
exhibited an accuracy value of 0.82 and 0.84 for the
first and the second subject, respectively. Both
significantly above the chance (0.5). The errors,
reported in Table 1, were equally balanced between
the two classes for the first subject and more
concentrated in E2 for the second subject.
Table 1: Classification results for the disgust/relax
detector.
Subject
E1
hits
E1
errors
E2
hits
E2
errors
E1
acc.
E2
acc.
1 20 5 21 4 0.8 0.84
2 23 2 19 6 0.92 0.76
The classification results confirmed that this
approach had accuracy values similar to that
obtained by Placidi et al., (2015a).
3.2 Study 2 – Pleasant Odor
Recognition
In the second study we repeated the same process on
the S
2
dataset, in order to train a detector for the
pleasant sensation (trials E2) with respect to the
relax (trials E3), The division between classes
performed in Study 1 was assumed.
Data reported in Figure 6 show that E2 was more
difficult to be detected than E1. Only two
configurations for each subject presented accuracy
above the threshold: C4 (α = 0.72) and C3 (α = 0.68)
for the first subject, F4 (α = 0.7) and T7 (α = 0.68)
for the second subject.
Also the total accuracy assessed during the test
phase was lower than that related to the disgust: 0.72
for the first subject 1 and 0.7 for the second subject.
However it was yet well above the chance level. In
this study, misclassifications were equally divided
between the two classes, as shown in Table 2.
This was a particular case of the algorithm
application: for both subjects, only two channels had
accuracy values above the threshold and one channel
was significantly better than the other. This implied
that the best channel acquired the “majority share”
of the detector. On a binary detection problem, this
channel drove the whole process. However, the
output of the channel with smaller weight was not
completely ignored: during the polling process of a
composite classifier, it could affect the classification
result.
Figure 6: Validation accuracy for pleasantness/relax
detection. Configurations with red borders had an
accuracy value greater than the threshold and were chosen
for the poll phase.
These results suggest a correspondence between
the arousal of an emotion and its effect over the
signals: the disgust, a strong emotion (also in terms
of side effects, such as vomit or increasing
sweating), seems to be associated with stronger
signals compared to the pleasantness. Moreover, the
disgust is a sensation farther than the pleasantness,
with respect to the environment in which the
experiments took place. In some sense, the room’s
“odor” had more in common with a fragrance than
with a stink.
Table 2: Classification results for the pleasantness/relax
detector.
Subjects
E2
hits
E2
errors
E3
hits
E3
errors
E2
acc.
E3
acc.
1 18 7 18 7 0.72 0.72
2 17 8 18 7 0.68 0.72
NEUROTECHNIX 2015 - International Congress on Neurotechnology, Electronics and Informatics
46

3.3 Study 3 – Three Class
Classification
The last study regarded the classification of the data
allowing to S3 through the composite classifier
described in Figure 3. The Calibration parameters
were the same of the previous studies. Results
showed accuracy values of 0.64 for the first subject
and 0.63 for the second.
Also in this case, the first subject exhibited more
balanced accuracy between the three classes than the
second subject (Table 3).
It is important to note that, in case of a three
classes classification problem, like this, the chance
level was 0.33. Also in this case, therefore, the
classifier accuracy was significantly greater than this
value.
Table 3: Classification results for the composed classifier.
Sub.
E1
hit
E1
err
E2
hit
E2
err
E3
hit
E3
err
E1
acc.
E2
acc.
E3
acc.
1 16 9 15 10 17 8 0.64 0.6 0.68
2 15 10 14 11 18 7 0.6 0.56 0.72
4 CONCLUSIONS
A poll based emotion classification strategy was
presented. This approach was based on a frequency
similarity research through selectable frequency
bands and channels sets. The strategy was suitable
for two emotional states detection or, extending the
underlying poll process, for multiple emotional
states classification and channels selection. The
more informative channels were selected through the
proposed poll method.
The proposed approach was tested in different
scenarios: detection of the disgust produced by the
memory of a stink with respect to relax; detection of
the pleasantness elicited by remembering a fragrance
with respect to relax; classification of all the
previously tested emotional states at the same time.
For the last classification problem, the obtained
classification accuracy (about 63%) was acceptable
by considering that all the emotional states were
self-induced and not externally elicited and that the
considered emotional states shared a significant
brain region of activation (Rolls et al., 2003).
The stepping from two recognized emotional
states to three emotional states could allow to obtain
a faster BCI system (larger is the alphabet, smaller is
the number of symbols necessary to compose the
same message).
Future developments will be dedicated to:
1) test the proposed classification strategy in real
time;
2) extend the proposed algorithm in a multi-states
classification (more than three between those
that can be self-induced);
3) implement an emotional BCI based on the
proposed protocol.
REFERENCES
Bin He, H., 2014. Brain-Computer Interfaces Using
Sensorimotor Rhythms: Current State and Future
Perspectives. IEEE Transactions on Biomedical
Engineering, 61(5), 1425-1435.
Bos, D. O., 2006. Eeg-based emotion recognition: The
influence of visual and auditory stimuli. Online.
Chanel, G., Kronegg, J., Grandjean, D. and Pun, T., 2006.
Emotion Assessment: Arousal Evaluation Using
EEG’s and Peripheral Physiological Signals.
Multimedia Content Representation, Classification
and Security, pp. 530-537.
Choppin, A., 2000. Eeg-based human interface for
disabled individuals: Emotion expression with neural
networks. Unpublished master’s thesis.
Draper, N. and Smith, H., 1998. Applied regression
analysis. New York: Wiley.
Furdea, A., Halder, S., Krusienski, D., Bross, D., Nijboer,
F., Birbaumer, N. and Kübler, A., 2009 An auditory
oddball (P300) spelling system for brain-computer
interfaces. Psychophysiology 46(3): 617-625.
Henkin, R. and Levy, L., 2001. Lateralization of Brain
Activation to Imagination and Smell of Odors Using
Functional Magnetic Resonance Imaging (fMRI): Left
Hemispheric Localization of Pleasant and Right
Hemispheric Localization of Unpleasant Odors.
Journal of Computer Assisted Tomography, 25(4):
493-514.
Iacoviello, D., Petracca, A., Spezialetti, M. and Placidi,
G., 2015. A Real-time classification algorithm for
EEG-based BCI driven by self-induced emotions.
Computer Methods and Programs in Biomedicine,
doi:10.1016/j.cmpb.2015.08.011.
Li, M. and Lu, B. L., 2009. Emotion classification based
on gamma-band EEG. 2009 Annual International
Conference of the IEEE Engineering in Medicine and
Biology Society.
Liu, Y., Sourina, O., and Nguyen, M. K., 2010. Real-time
EEG-based human emotion recognition and
visualization. 2010 International Conference on
Cyberworlds: 262-269.
Mathworks, 2015. MathWorks - MATLAB and Simulink
for Technical Computing. [online] Available at:
http://www.mathworks.com [Accessed 6 Jul. 2015].
Molina, G., Tsoneva, T. and Nijholt, A., 2009. Emotional
brain-computer interfaces. 2009 3rd International
Conference on Affective Computing and Intelligent
Interaction and Workshops.
A Poll Oriented Classifier for Affective Brain Computer Interfaces
47
Neuroelectrics, 2015. Products / ENOBIO. [online]
Available at: http://www.neuroelectrics.com/enobio
[Accessed 6 Jul. 2015].
Niemic, C. P. and Warren, K., 2002. Studies of Emotion:
A Theoretical and Empirical Review of
Psychophysiological Studies of Emotion. Journal of
Undergraduate Research, 1(1): 15-18.
Picard, R., 2000. Affective computing. MIT Press.
Placidi, G., Avola, D., Petracca, A., Sgallari, F. and
Spezialetti, M., 2015a. Basis for the implementation of
an EEG-based single-trial binary brain computer
interface through the disgust produced by
remembering unpleasant odors. Neurocomputing, 160:
308-318.
Placidi, G, Petracca, A., Spezialetti, M. and Iacoviello D.,
2015b. Classification Strategies for a Single-Trial
Binary Brain Computer Interface based on
Remembering Unpleasant Odors. 37th Annual
International Conference of the IEEE Engineering in
Medicine and Biology Society.
Rolls, E. T., Kringelbach, M. L. and De Araujo, I. E. T.,
2003. Different representations of pleasant and
unpleasant odours in the human brain. European
Journal of Neuroscience, 18: 695–703.
Russell, J., 1979. Affective space is bipolar. Journal of
Personality and Social Psychology, 37(3): 345-356.
Schalklab, 2015. BCI2000 | Schalk Lab. [online] Available
at: http://www.schalklab.org/research/bci2000
[Accessed 6 Jul. 2015].
Wang, X., Nie, D. and Lu, B., 2014. Emotional state
classification from EEG data using machine learning
approach. Neurocomputing, 129: 94-106.
Wolpaw, J. and Wolpaw, E., 2012. Brain-computer
interfaces. Oxford: Oxford University Press.
Xiaorong G., Dingfeng X., Ming C. and Shangkai G.,
2003. A bci-based environmental controller for the
motion-disabled. IEEE Transactions on Neural
Systems and Rehabilitation Engineering, 11(2): 137-
140.
Zhang, Q. and Lee, M., 2009. Analysis of positive and
negative emotions in natural scene using brain activity
and GIST. Neurocomputing, 72(4): 1302-1306.
NEUROTECHNIX 2015 - International Congress on Neurotechnology, Electronics and Informatics
48
