Investigation of the Minimum Conditions for Reliable Estimation of
Clinically Relevant HRV Measures
Introducing a Novel Approach to the Validation of HRV Measurement Systems
Esben Ahrens
1
, Helge B. D. Sorensen
1
, Henning Langberg
2
, Karsten Hoppe
3
and Dorthe Bodholt Saadi
3
1
Department of Electrical Engineering, Technical University of Denmark,
Ørsteds Plads Building 348, 2800 Kgs. Lyngby, Denmark
2
Department of Public Health, Copenhagen University, Henrik Pontoppidansvej 4, 1014 Copenhagen K, Denmark
3
DELTA Danish Electronics, Lights & Acoustics, Venlighedsvej 4, 2970 Hørshom, Denmark
Keywords:
Heart Rate Variability, Jitter, Ectopic Beat.
Abstract:
The R-peak localization error (jitter) of a heart rate variability (HRV) system has a great impact on the values
of the HRV measures. Only a few studies have analyzed this subject and purely done so from the aspect of
choice of sampling frequency. In this study we provide an overview of the various factors that comprise the
jitter of a system. We propose a method inspired by the field of signal averaged electrocardiography (SAECG)
that allows for a quantification of the jitter of any HRV system that records and stores the raw ECG signal.
Furthermore, with this method the differences between the HRV measures of the system and HRV measures
corresponding to the physiological truth can be quantified. The method is used to obtain the physiologically
true R-peak locations of subjects from Physionet’s ‘Normal Sinus Rhythm Database’. The effects of jitter are
then analyzed via mathematical modelling for short-term and long-term HRV for various HRV measures. The
effects of abnormal beats and missed and false detections are analyzed as well.
1 INTRODUCTION
Evaluation of heart rate variability (HRV) has been
acknowledged to provide a reliable reflection of the
autonomic modulation of the normal heart rhythm.
Different HRV measures have thus been suggested to
contain clinically relevant information about diseases
related to autonomic dysfunction, e.g. assessment of
diabetic neuropathy (AHA and ESC, 1996). One of
the major HRV research areas is related to risk strat-
ification in populations with myocardial infarction,
congestive heart failure, or left ventricular dysfunction.
A brief review of the most relevant studies related to
this risk stratification is provided in (Huikuri and Stein,
2013). They generally find that based on the available
data, abnormal HRV measures are a general risk factor
for cardiac death in patients after myocardial infarction
(Huikuri and Stein, 2013). However, they also note
that most observational studies achieve low sensitivity
and low negative predictivity for adverse outcomes
using HRV measures (Huikuri and Stein, 2013). This
suggests that more research and methodological deve-
lopment is needed in this area. As a part of a continued
research effort, we therefore consider it highly relevant
to take a closer look at the prerequisites for obtaining
reliable HRV measures. This reliability is primarily
limited by the ability to obtain uninterrupted and ac-
curate series of normal RR intervals (Citi et al., 2012).
Furthermore, the emergence of HRV analysis in vari-
ous health management applications makes it highly
relevant to obtain greater knowledge about the mini-
mum conditions needed to obtain reliable estimates of
HRV measures.
Causal Analysis of NN Series Errors.
The quality
of the obtained NN (normal-to-normal) series might
be reduced by several different sources of error. Fig-
ure 1 gives an overview of these sources. One of the
main contributors to errors in the NN series is the inter-
ruptions caused by QRS detection errors or abnormal
beats.
The other main contributor to errors in the NN
series is jitter (localization error) in the automatic de-
tection of the exact R-peak location. This jitter might
be caused by imprecise digitization of the true phy-
30
Ahrens, E., Sorensen, H., Langberg, H., Hoppe, K. and Saadi, D..
Investigation of the Minimum Conditions for Reliable Estimation of Clinically Relevant HRV Measures - Introducing a Novel Approach to the Validation of HRV Measurement Systems.
In Proceedings of the 3rd International Congress on Cardiovascular Technologies (CARDIOTECHNIX 2015), pages 30-38
ISBN: 978-989-758-160-1
Copyright
c
2015 by SCITEPRESS – Science and Technology Publications, Lda. All rights reserved
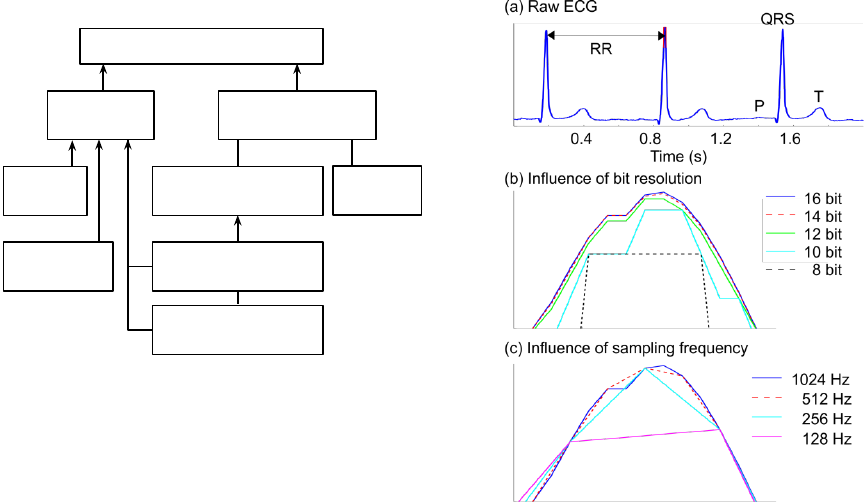
Causal Analysis of NN Series Errors
Figure 1: Overview of the most important potential causes
of errors in the NN series. The presence of each of these
errors might influence the reliability of the estimated HRV
measures. Low QRS detection performance refers to the
effect of false and/or missing R-peak detections.
siological R-peak and/or by imprecise fiducial point
localization provided by the automatic QRS detector.
The accuracy of the digitization depends on both the
sampling frequency and the resolution of the applied
electrocardiography (ECG) recorder. These effects are
illustrated in Figure 2. It is observed that the exact
location of the digitized R-peak is highly dependent
on a combination of the sampling frequency and the
resolution. This poses a clear risk of inducing jitter.
But jitter also depends on the fiducial points set by the
QRS detector. Jitter might also arise from artifacts in
the ECGs. Only a few studies have attempted to esti-
mate the influence of the introduced jitter (Tapanainen
et al., 1999) and most of them are primarily focused
on the influence of the sampling frequency (García-
González et al., 2004; Ziemssen et al., 2008). Only
very limited knowledge is available about the influence
of the overall amount of jitter. There are thus several
unanswered questions related to the necessary prere-
quisites for reliable estimation of clinically relevant
HRV measures. The focus of this study is therefore to
provide new knowledge about the required minimum
conditions that permit reliable estimation of clinically
relevant HRV measures and a method capable of as-
sessing whether or not these conditions are met.
2 METHODS
In (AHA and ESC, 1996) it is suggested that HRV
measurement systems should be tested using simu-
lated RR series with known HRV properties. One of
the downsides to this approach is the lack of physio-
Figure 2: Illustration of the potential issues with imprecise
digitization of the true physiological R-peak position. (a)
Raw ECG snippet with indication of the most important
ECG fiducial points. The red mark on top of the second
QRS complex indicates the area that is zoomed in on in (a)
and (b). (a) and (b) illustrate the influence of different bit
resolutions and different sampling frequencies, respectively.
The recorded reference curve is the blue line (16 bit, 1024
Hz), and the other curves are simulations based on the blue
line.
logical relevance in the simulated signals. This fact is
demonstrated by (Smith et al., 2002). Their method
automatically classifies an RR series as synthetic or
physiological. It yielded a 100% accuracy when eval-
uated on a Physionet/Computing in Cardiology 2002
challenge dataset. Hence, validation of HRV system
using synthetic RR series as a basis may not be relevant
for physiological ECG signals. Therefore, we suggest
an alternative approach avoiding synthetic data.
A method that is very popular in the literature re-
garding signal averaged ECG (Fonseca et al., 2014;
Shaw and Savard, 1995) is used to obtain the physi-
ologically true R-peak locations. In contrast to simu-
lated RR series, this data will contain relevant physio-
logical content. The method obtains the true R-peak
locations from raw ECG and QRS fiducial points. The
true R-peak locations can then be used to calculate the
jitter of an HRV measurement system. The jitter is
defined as the standard deviation of the differences be-
tween the true R-peak locations and the fiducial points
given by the system. Furthermore, physiologically true
HRV measures based on the true RR series can be used
to calculate the error of the HRV measurement system.
Investigation of the Minimum Conditions for Reliable Estimation of Clinically Relevant HRV Measures - Introducing a Novel Approach to
the Validation of HRV Measurement Systems
31
The method is then applied to Physionet’s ’Normal
Sinus Rhythm Database’ in order to obtain physiolog-
ically true RR series with the locations of abnormal
beats annotated as well. From the true RR series analy-
ses of the effects of jitter and appropriate handling of
abnormal beats, as well as missed and false detections
are performed.
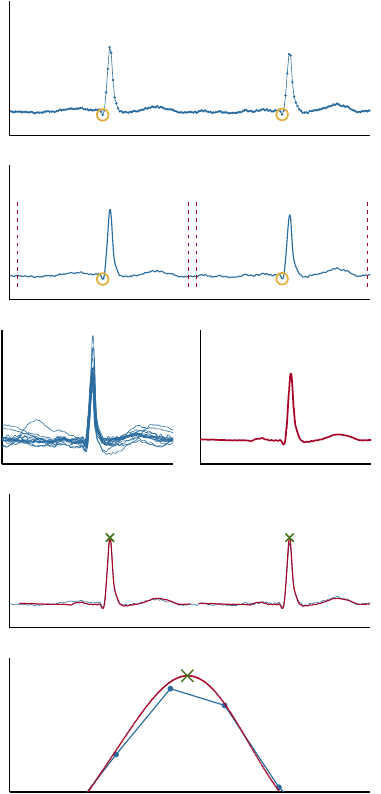
2.1 Obtaining the True RR Series
This section describes the cross correlation-based tem-
plate matching algorithm. Baseline drift of the raw
ECG is removed by filtration with a Kaiser window
finite impulse response high-pass filter with a cut off
frequency at 0.67 Hz. An example of input to the tem-
plate matching algorithm is shown in Figure 3(a). The
initial fiducial points could be manual annotations or
output from an automatic QRS detector. Selected illus-
trative stages of the algorithm are shown in Figure 3
and the algorithm is defined by the following steps.
1.
Interpolate the ECG signal such that the sampling
frequency is increased to
f
s
up
= 8192
Hz. See
Figure 3(b).
2.
Extract a window of length equal to the median
heartbeat interval around each of the current fidu-
cial points. See Figures 3(b) and 3(c).
3.
Calculate the template defined as the mean of the
extracted windows. See Figure 3(d).
4.
Calculate the cross correlation between the ECG
signal around the estimated R-peak locations and
the template. The sample index of the maxi-
mum cross correlation values is applied to improve
the estimation of the R-peak location. These R-
peak location estimations serve as the new fiducial
points. See Figure 3(e).
5. Repeat steps 2.–4. once more.
Repeating steps 2.–4. a third time did not change the
outcome. The output is compared with the input in
Figure 3(f). The location of the physiologically true
R-peak is defined by the template maximum (green
cross). Note that it is located between the original
samples of the raw ECG.
Interpolation.
The database is sampled at 128 Hz.
Since the frequency content of the QRS complex falls
below half of this sampling frequency, the Shannon-
Nyquist sampling theorem tells us that the signal can
be reconstructed for all time by bandlimited interpo-
lation (Dodson, 1992; Proakis and Monolakis, 1996;
Bashir et al., 2010). Therefore, the interpolation in
step 1 is performed by bandlimited interpolation.
(a)
(b)
(c) (d)
(e)
(f)
Figure 3: Illustration of the template matching algorithm
described in section 2.1. (a) shows the ECG after removal of
baseline drift, and manually annotated QRS complex fidu-
cial points. (b) shows the interpolated ECG with fiducial
points. The windows extracted in step 2 are marked by red,
dotted lines. (c) shows examples of windows of interpolated
ECG extracted in step 2. (d) shows the mean of the extracted
windows of the interpolated ECG. This is the initial ECG
template. (e) shows the interpolated ECG, and the initial
template at the locations of maximal cross correlation. The
template maximum is marked. It represents the result after
steps 2.–4. have been executed once. These results serve
as input when repeating the steps 2.–4. (f) shows a com-
parison between the original data and the algorithm output.
The template (red line) and the physiologically true R-peak
position (green cross) is shown along with the original raw
ECG (blue line). Each blue dot indicates the location of one
of the original samples. Note that the true R-peak position
defined by the algorithm is in between two of the original
samples.
CARDIOTECHNIX 2015 - International Congress on Cardiovascular Technologies
32

In (Fonseca et al., 2014) a post-processing algo-
rithm for precise R-peak location without the use of
interpolation is introduced. However, the template
matching algorithm is also used in (Fonseca et al.,
2014) as a “golden standard” and is thus preferred
here.
2.2 HRV Measures
For this study HRV measures from both the time
(SDNN, RMSSD, pNN50, SDI), frequency (LF/HF,
VHF), geometric (
π
SD1SD2), and non-linear domain
was chosen (ApEn, SampEn).
SDNN is the standard deviation of all normal-to-
normal (NN) intervals. RMSSD is the root-mean-
square of the differences between successive NN-
intervals. pNN50 is the percentage of differences
between successive NN-intervals that are larger than
50 ms. SDI is the mean of all SDNN calculated over
5 minute intervals across a long-term recording.
The following ranges are used for frequency do-
main analysis: Very low frequency (VLF) [0.003,
0.04], low frequency (LF) [0.04, 0.15], high frequency
(HF) [0.15, 0.4], and very high frequency (VHF) [0.4,
0.5]. The frequency spectrum was obtained both by
Lomb-Scargle (L-S) periodogram and Fourier trans-
formation of the RR time series equidistantly sampled
at 4 Hz by using cubic spline interpolation. The L-S
periodogram has the benefit of not requiring an equidis-
tantly sampled time series.
SD1 is the standard deviation of the distances of the
points of the Poincaré plot projected onto the identity
line (x=y) and is related to short-term HRV. SD2 is
the standard deviation of the distances of the points of
the Poincaré plot projected onto the line perpendicular
to the identity line and is related to long-term HRV.
π
SD1SD2 is calculated as
π ·SD1 ·SD2
and measures
the overall variability.
Approximate entropy (AnEn) quantifies the unpre-
dictability of fluctuations in the RR series. Sample
entropy (SampEn) is a refined version of approximate
entropy (Richman and Moorman, 2000).
2.3 Jitter Simulation
To investigate the effects of jitter a simulation of jit-
ter is executed. Physionet’s ‘Normal Sinus Rhythm
database’ (Goldberger et al., 2000) contains both the
raw ECG signals and annotations of 21 subjects and
serves as a basis for the simulation. The physiolog-
ically true R-peak locations are found via the auto-
matic template matching algorithm applied to the QRS
complex fiducial points marked in the annotation files.
In some areas the Normal Sinus Rhythm Database
Table 1: Optimal jitter values assuming smallest possible
jitter within the given sampling frequency. Average of jitter
values for the Pan-Tompkins algorithm for the first two hours
of the selected subjects of the dataset. Some subjects of the
dataset were excluded because of wrongful annotations in
the corresponding annotation files.
f
s
(Hz) Optimal jitter (ms) Pan-Tompkins jitter (ms)
128 2.3 8.8
256 1.1 4.3
512 0.6 1.8
1024 0.3 0.7
has marked normal QRS-complexes as being ‘QRS-
like artifacts’. We corrected this manually in order to
obtain RR series free of any technical errors and ex-
cluded some subjects because of wrongful annotations.
The RR series were detrended by a method based on
smoothness priors (Tarvainen et al., 2002).
It is assumed that the jitter is normally distributed.
Thus, the jitter simulation is carried out by adding
random numbers drawn from the normal distribution
to the true R-peak locations using a random number
generator in MATLAB
®
(Mersenne Twister). This
means that the simulation will only be exact for HRV
systems that show the same pattern in their differences
from the true R-peak locations. The simulation is run
with increasing jitter values and it is repeated ten times
for each jitter value. For each run relative accuracy
error (RAE) is calculated as
RAE =
|s −s
true
|
s
true
·100%, (1)
for each estimated HRV measure
s
and ground true
HRV measure s
true
. Finally the average RAE is calcu-
lated over the ten runs at each level of jitter.
Minimum Jitter.
Let the jitter be defined as the stan-
dard deviation of the localization errors of the R-peak
fiducial points. Assume that the true RR series is
known. Let the ECG signal be sampled at finite sam-
pling frequency
f
s
. Theoretical jitter values can then
be calculated assuming that the R wave fiducial point
localization was ideal within the respective sampling
frequency. The error will then be uniformly distributed
on
[0,1/ f
s
[
and the standard deviation equals (Kellogg,
1996)
1/ f
s
√
12
. (2)
The jitter values given in Table 1 are found via this
formula. It must be emphasized that these values re-
present best case scenarios.
Jitter of the Pan-Tompkins Algorithm. An imple-
mentation of the Pan-Tompkins QRS detector (Pan and
Investigation of the Minimum Conditions for Reliable Estimation of Clinically Relevant HRV Measures - Introducing a Novel Approach to
the Validation of HRV Measurement Systems
33
Tompkins, 1985) was tested on the data and compared
to the ground truth. The different sampling frequen-
cies were obtained by interpolation. This revealed the
jitter values shown in the last column of Table 1. The
values are much higher than the minimum values. The
differences between the physiological truth and the
fiducial points given by Pan-Tompkins were normally
distributed, hence the output of the later described
jitter simulation is accurate for this algorithm.
Handling Abnormal Heartbeats.
Ectopic beats do
not originate from the sinoatrial node, and the effect
of these should therefore be minimized or eliminated
when calculating the HRV measures. The abnormal
beats (e.g. ectopic beats) are marked in the annota-
tions file. From this information an investigation on
the effect of adjusting the respective RR time events
(outliers) versus leaving the RR series unaltered for
both short-term and long-term HRV was performed.
For time series analysis the outliers were deleted
prior to calculation of the HRV measures. For fre-
quency spectrum analysis, the outliers were replaced
by cubic spline interpolation when calculating the
equidistantly sampled RR series. For geometric and
nonlinear measures the outliers were replaced using
cubic spline interpolation.
Missed & False Detections.
Missed and false QRS
detections are simulated by extracting a random 5
minute RR series free of abnormal beats from each
subject and randomly removing or adding an extra
beat. The added beat is restricted to not being closer
than 250 ms to any neighboring beat. This simulates
a refractory period typically implemented in an au-
tomatic QRS detector. Automatic outlier detection
and replacement methods for manipulation of the RR
series can be found in e.g. (Kemper et al., 2007).
3 RESULTS & DISCUSSION
3.1 Jitter
Subsets of the results of the short-term and long-term
HRV jitter simulations are shown in Figure 5 and 6,
respectively. Figure 4 explains how Figure 5 and 6
should be read. The short-term HRV error is calculated
as the mean error of the HRV measures of 5-minute
segments selected randomly as the beginning of each
of the first ten hours of the recordings which all start
before noon, yielding a total of ten segments for each
subject. For each chosen subject and HRV measure
the average relative accuracy error (RAE) is shown as
HF
RAE (%)
QRS jitter (ms)
0
1
2 3 4 5 6 7 8 9 10
0
5
10
15
20
25
30
35
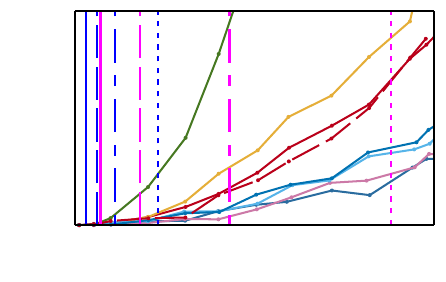
Figure 4: This figure and text explains how Figures 5 and 6
should be read. The blue vertical lines represent minimum
(which also means optimal) jitter values at sampling frequen-
cies 1024, 512, 256, and 128 Hz from left to right. The ma-
genta lines represent jitter values of the tested Pan-Tompkins
algorithm at the same sampling frequencies and illustrates
that the jitter at various sampling frequencies depends on the
QRS detector. Note that each sampling frequency is illus-
trated by a distinct line style. It is apparent that the relative
accuracy error (RAE) does not only depend on sampling
frequency, but on the system as a whole. On Figures 5 and 6
the lines marking the Pan-Tompkins algorithm performance
are left out. The acceptable level of RAE will be application
dependent. This graph shows the jitter simulation output of
one HRV measure (HF) for a subset of subjects from the
database. Only eight subjects are included in this illustrative
graph for the sake of clarity. A large inter-subject variability
is seen. Furthermore, it is seen that the relative accuracy
error (RAE) increases as the jitter increases.
a function of increasing jitter. The minimum jitter at
sampling frequencies 1024, 512, 256 and 128 Hz is
shown as the blue lines from left to right. Figures 5(a)
and 6(a) show the measured jitter of the tested im-
plementation of the Pan-Tompkins algorithm as the
magenta lines. This illustrates that the jitter does not
only depend on the choice of sampling frequency but
of many other factors, one being the performance of
the QRS detector.
In general, the results of the two simulations are
quite close to each other. However, the curves of the
long-term simulation are smoother. This is probably
because of the simulated noise is randomly chosen
from the normal distribution. Longer segments will
create empirical distributions quite close to the normal
distribution, while shorter segments might not. This
illustrates how the instability of a system can have a
greater impact on HRV analysis on shorter segments.
There are large interpersonal variations in the relative
accuracy errors (RAE) for all simulations.
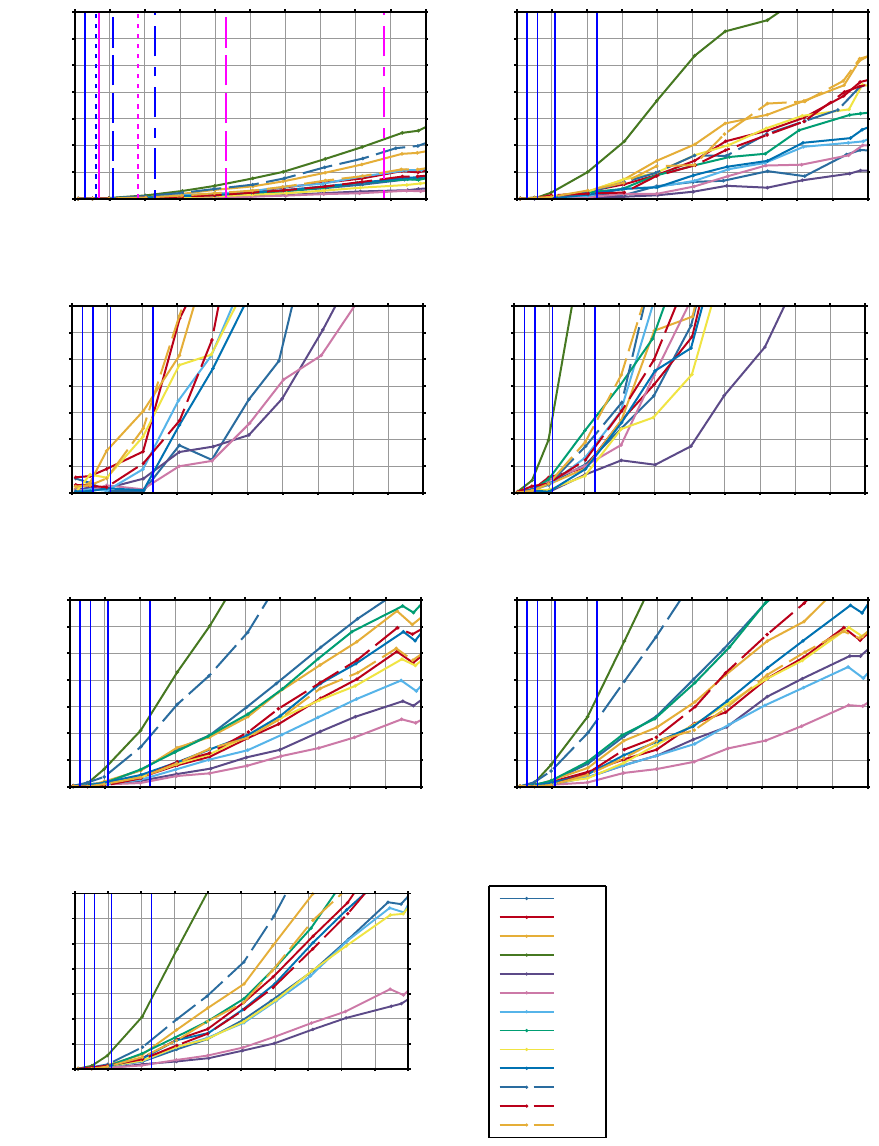
A HRV measure like pNN50 can quite quickly
have a large RAE since the respective NN50 count
can e.g. be equal to 1 and adding e.g. 1 more as a
CARDIOTECHNIX 2015 - International Congress on Cardiovascular Technologies
34
result of noise can then double the RAE. This shows
that conclusions based on pNN50 should be made with
care, especially for short-term HRV, see Figures 5(c)
and 6(c).
The jitter induced changes in the LF/HF measure
are dominated by HF. LF, VLF, and ULF are quite
stable in regards to jitter as could be expected. Since
HF is overestimated at higher levels of jitter, LF/HF
is underestimated as a result, see Figures 5(b), 6(b),
and 6(d). VHF is affected to a greater degree by jit-
ter than HF, which shows that jitter induced by e.g.
lower sampling frequency adds high frequency noise
— the higher the frequencies in question the greater
the error, see Figure 5(d). Frequency domain mea-
sures based on L-S periodogram and Fourier transfor-
mation were strikingly similar as illustrated by Fig-
ures 6(d) and 6(b). This was surprising since the L-
S method does not require the step of obtaining an
equidistantly sampled RR series. The error in the
measure
π
SD1SD2 is dominated by SD1 measuring
short-term variability and will be overestimated as a re-
sult of jitter, see Figures 5(g) and 6(g). It is thought by
some to give a better estimate of the overall variability
as compared to SDNN, but it is not as stable in regards
to jitter, see Figures 5(a) and 6(a). SDI is as stable
as SDNN, which could be expected, see Figure 6(f).
RMSSD is very similar to
π
SD1SD2 in the way that
it is calculated and thus not surprisingly also in jitter
sensitivity, see Figure 6(e).
Sampling Frequency.
It is interesting to note that in-
ducing jitter, e.g. by lowering the sampling frequency,
will have the effect of overestimating most of the HRV
measures. This means that a perfect QRS detector will
potentially be able to detect the high frequency fluc-
tuations of the HRV measures with greater accuracy
at higher sampling frequencies, and inducing jitter by
lowering the sampling frequency and/or decreasing the
localization accuracy of the QRS detector can result
in overestimation of the HRV measures designed to
measure high frequency fluctuations.
As discussed, the jitter might originate from several
different factors (e.g. low bit resolution, low sampling
frequency, artefacts, and low QRS localization accu-
racy). These factors are mutually influencing each
other, and it is thus difficult to provide a definitive
conclusion on the required sampling frequency inde-
pendently of all other factors in the HRV measurement
system. We therefore recommend that the cumulative
effect from all factors are investigated when choosing
the sampling frequency.
Abnormal Heartbeats.
Table 2 on page 9 shows
the average plus/minus the standard deviation of the
relative accuracy error for all subjects. It is clear that
the effect of not correcting the abnormal beats in the
short-term HRV can be quite severe. The long-term
analysis is more robust for this type of error with a
maximum value of 2%. This suggests that when per-
forming short-term HRV analysis on healthy subjects
biological errors need to be addressed. However, for
long-term analysis on this dataset the effects of abnor-
mal beats are deemed to be insignificant.
Missed & False Detections.
The effects of a missed
detection are higher than that of a false detection, see
Table 2. It is interesting to see that a missed detection
also has a profound effect on LF, while a false detec-
tion has much less. Overall the errors are very high
except for the HRV measure meanNN. It is clear that
such an error will have a much more serious negative
effect on the HRV measures than the choice of lower
sampling frequency of e.g. 128 Hz. This can also be
observed on SDNN which proved to be very stable
when higher levels of jitter were applied.
Comparison with Existing Literature.
In
(Ziemssen et al., 2008) the EUROBAVAR data set,
sampled at 500 Hz, is downsampled to 200 Hz
and 100 Hz. Only ultra high frequency (defined by
frequencies
> 40
Hz) was significantly different when
comparing the values across the different sampling
frequencies. This is comparable to our results, where
VHF shows larger errors than LF/HF at the same jitter
levels, see Figure 5. In (AHA and ESC, 1996) it is
recommended to use RMSSD instead of pNN50, since
it has better statistical properties. In (Hejjel and Roth,
2004) the authors find that pNN50 is very unreliable
even at jitter levels of 1 ms. This is also supported by
our results.
4 CONCLUSION
We recommend that each HRV measurement system
should be validated by
1. showing low jitter levels, and/or
2.
the HRV measures that it produces should be com-
pared with and be close to the ones obtained by the
template matching method described in this study.
This method will allow HRV systems to be tested with-
out the need for synthetic signals or comparison with
a different system recording simultaneously. It only
requires access to the recorded ECG signal.
In this study it was found that handling abnormal
beats was important for short-term HRV analysis, but
Investigation of the Minimum Conditions for Reliable Estimation of Clinically Relevant HRV Measures - Introducing a Novel Approach to
the Validation of HRV Measurement Systems
35
(a) SDNN
RAE (%)
Jitter (ms)
0
1
2 3 4 5 6 7 8 9 10
0
5
10
15
20
25
30
35
(b) LF/HF
RAE (%)
Jitter (ms)
0
1
2 3 4 5 6 7 8 9 10
0
5
10
15
20
25
30
35
(c) pNN50
RAE (%)
Jitter (ms)
0
1
2 3 4 5 6 7 8 9 10
0
5
10
15
20
25
30
35
(d) VHF
RAE (%)
Jitter (ms)
0
1
2 3 4 5 6 7 8 9 10
0
5
10
15
20
25
30
35
(e) ApEn
RAE (%)
Jitter (ms)
0
1
2 3 4 5 6 7 8 9 10
0
5
10
15
20
25
30
35
(f) SampEn
RAE (%)
Jitter (ms)
0
1
2 3 4 5 6 7 8 9 10
0
5
10
15
20
25
30
35
(g) π
π
π SD1SD2
RAE (%)
Jitter (ms)
0
1
2 3 4 5 6 7 8 9 10
0
5
10
15
20
25
30
35
19090
18184
18177
17453
17052
16795
16786
16773
16539
16483
16420
16273
16265
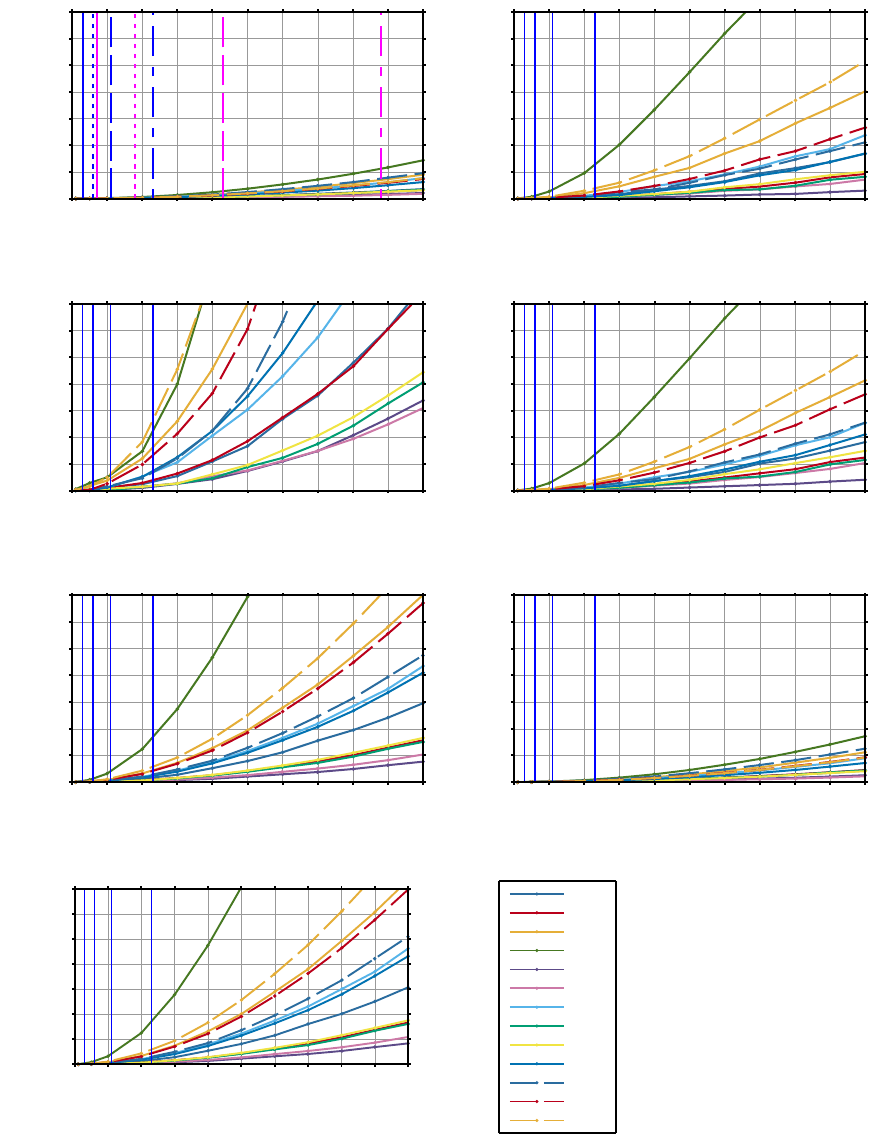
Figure 5: Jitter simulations based on short-term HRV measures. The average relative accuracy error (RAE) is shown as a
function of jitter for different subjects. The blue lines correspond to minimal possible jitter at sampling frequencies 1024, 512,
256, and 128 Hz from left to right. (a) also shows the jitter of the Pan-Tompkins algorithm — note the matching line styles
between the sampling frequencies. The subject identification numbers are shown in the legend.
CARDIOTECHNIX 2015 - International Congress on Cardiovascular Technologies
36
(a) SDNN
RAE (%)
Jitter (ms)
0
1
2 3 4 5 6 7 8 9 10
0
5
10
15
20
25
30
35
(b) LF/HF
RAE (%)
Jitter (ms)
0
1
2 3 4 5 6 7 8 9 10
0
5
10
15
20
25
30
35
(c) pNN50
RAE (%)
Jitter (ms)
0
1
2 3 4 5 6 7 8 9 10
0
5
10
15
20
25
30
35
(d) LF/HF (L-S)
RAE (%)
Jitter (ms)
0
1
2 3 4 5 6 7 8 9 10
0
5
10
15
20
25
30
35
(e) RMSSD
RAE (%)
Jitter (ms)
0
1
2 3 4 5 6 7 8 9 10
0
5
10
15
20
25
30
35
(f) SDI
RAE (%)
Jitter (ms)
0
1
2 3 4 5 6 7 8 9 10
0
5
10
15
20
25
30
35
(g) π
π
π SD1SD2
RAE (%)
Jitter (ms)
0
1
2 3 4 5 6 7 8 9 10
0
5
10
15
20
25
30
35
19090
18184
18177
17453
17052
16795
16786
16773
16539
16483
16420
16273
16265
Figure 6: Jitter simulations based on long-term HRV measures. The average relative accuracy error (RAE) is shown as a
function of jitter for different subjects. The blue lines correspond to minimal possible jitter at sampling frequencies 1024, 512,
256, and 128 Hz from left to right. (a) also shows the jitter of the Pan-Tompkins algorithm — note the matching line styles
between the sampling frequencies. The subject identification numbers are shown in the legend.
Investigation of the Minimum Conditions for Reliable Estimation of Clinically Relevant HRV Measures - Introducing a Novel Approach to
the Validation of HRV Measurement Systems
37

Table 2: Average plus/minus standard deviation of relative approximation error in percent for both abnormal beats, false and
missed detections.
meanNN SDNN RMSSD pNN50 HF LF π SD1SD2
Abnormal beat
Long-term 0.0 ±0.0 0.1 ±0.1 0.6 ±0.6 0.2 ±0.4 0.4 ±0.5 0.1 ±0.1 0.5 ±0.6
Short-term 0.0 ±0.0 1.6 ±1.7 11.6 ±11.1 7.6 ±14.6 14.1 ±15.2 4.1 ±8.0 12.4 ±11.3
False detection
Short-term 0.2 ±0.0 7.9 ±7.0 53.7 ±51.2 15.5 ±13.8 85.1 ±124.1 6.0 ±4.6 64.0 ±62.5
Missed detection
Short-term 0.2 ±0.0 15.8 ±17.6 128.7 ±102.7 11.8 ±10.9 657.6 ±1119.7 83.8 ±91.9 158.9 ±155.0
not for long-term HRV. It was found that missed and
false detection had a severe effect on short-term HRV.
We cannot define a limit for acceptable jitter levels
because it will depend on the analysis carried out in
each the specific study.
This investigating was carried out using ECG from
healthy subjects. The results are therefore limited to
studies using healthy subjects. Analysis of subjects
with lower HRV measures might result in larger rela-
tive errors at the same levels of jitter.
REFERENCES
Bashir, M., Lee, D., Akasha, M., Yi, G., Cha, E., Bae, J., Cho,
M., and Ryu, K. (2010). Highlighting the current issues
with pride suggestions for improving the performance
of real time cardiac health monitoring. Information
Technology in Bio-and Medical Informatics, ITBAM
2010, pages 226–233.
ESC and NASPE (1996). Guidelines Heart rate variability.
European Heart Journal, pages 354–381.
Citi, L., Brown, E. N., and Barbieri, R. (2012). A real-time
automated point-process method for the detection and
correction of erroneous and ectopic heartbeats. IEEE
Transactions on Biomedical Engineering, 59(10):2828–
2837.
Dodson, M. (1992). Shannon’s Sampling Theorem. Current
Science, 63(5):253 – 260.
Fonseca, P., Aarts, R. M., Foussier, J., and Long, X. (2014).
A novel low-complexity post-processing algorithm for
precise QRS localization. SpringerPlus, 3(1):376.
García-González, M. a., Fernández-Chimeno, M., and
Ramos-Castro, J. (2004). Bias and uncertainty in
heart rate variability spectral indices due to the finite
ECG sampling frequency. Physiological measurement,
25(2):489–504.
Goldberger, A., Amaral, L., Glass, L., Hausdorff, J., Ivanov,
P., Mark, R., Mietus, J., Moody, G., Peng, C.-K.,
and Stanley, H. (2000). PhysioBank, PhysioToolkit,
and PhysioNet: Components of a New Research Re-
source for Complex Physiologic Signals. Circulation,
101(23):e215–e220.
Hejjel, L. and Roth, E. (2004). What is the adequate sam-
pling interval of the ECG signal for heart rate vari-
ability analysis in the time domain? Physiological
measurement, 25(6):1405–1411.
Huikuri, H. V. and Stein, P. K. (2013). Heart rate variability
in risk stratification of cardiac patients. Progress in
Cardiovascular Diseases, 56(2):153–159.
Kellogg, B. (1996). CRC Standard Mathematical Tables and
Formulae (Daniel Zwillinger, ed.).
Kemper, K. J., Hamilton, C., and Atkinson, M. (2007). Heart
rate variability: Impact of differences in outlier identi-
fication and management strategies on common mea-
sures in three clinical populations. Pediatric Research,
62(3):337–342.
Pan, J. and Tompkins, W. J. (1985). A real-time QRS de-
tection algorithm. IEEE transactions on bio-medical
engineering, 32(3):230–236.
Proakis, J. G. and Monolakis, D. G. (1996). Digital Signal
Processing: principles, algorithms and applications.
Richman, J. S. and Moorman, J. R. (2000). Physiological
time-series analysis using approximate entropy and
sample entropy. American journal of physiology. Heart
and circulatory physiology, 278(6):H2039–H2049.
Shaw, G. R. and Savard, P. (1995). On the detection of
QRS variations in the ECG. IEEE Transactions on
Biomedical Engineering, 42(7):736–741.
Smith, F. E., Bowers, E. J., Langley, P., Allen, J., and Murray,
A. (2002). Heart rate variability characteristics required
for simulation of interval sequences. In Computers in
Cardiology, volume 29, pages 237–240.
Tapanainen, J. M., Seppänen, T., Laukkanen, R., Loimaala,
A., and Huikuri, H. V. (1999). Significance of the
accuracy of RR interval detection for the analysis of
new dynamic measures of heart rate variability. Annals
of Noninvasive Electrocardiology, 4(1):10–18.
Tarvainen, M. P., Ranta-Aho, P. O., and Karjalainen, P. A.
(2002). An advanced detrending method with appli-
cation to HRV analysis. IEEE transactions on bio-
medical engineering, 49(2):172–5.
Ziemssen, T., Gasch, J., and Ruediger, H. (2008). Influence
of ECG sampling frequency on spectral analysis of
RR intervals and baroreflex sensitivity using the EU-
ROBAVAR data set. Journal of Clinical Monitoring
and Computing, 22(2):159–168.
CARDIOTECHNIX 2015 - International Congress on Cardiovascular Technologies
38
