News Classifications with Labeled LDA
Yiqi Bai and Jie Wang
Department of Computer Science, University of Massachusetts, 1 University Avenue, Lowell, MA 01854, U.S.A.
Keywords:
Labeled LDA, Classification, SVM, Content Complexity.
Abstract:
Automatically categorizing news articles with high accuracy is an important task in an automated quick news
system. We present two classifiers to classify news articles based on Labeled Latent Dirichlet Allocation,
called LLDA-C and SLLDA-C. To verify classification accuracy we compare classification results obtained by
the classifiers with those by trained professionals. We show that, through extensive experiments, both LLDA-C
and SLLDA-C outperform SVM (Support Vector Machine, our baseline classifier) on precisions, particularly
when only a small training dataset is available. SSLDA-C is also much more efficient than SVM. In terms
of recalls, we show that LLDA-C is better than SVM. In terms of average Macro-F
1
and Micro-F
1
scores,
we show that LLDA classifiers are superior over SVM. To further explore classifications of news articles we
introduce the notion of content complexity, and study how content complexity would affect classifications.
1 INTRODUCTION
In an automated quick news system, we would need
to automatically classify news articles. A number of
supervised (Chen et al., 2015), semi-supervised (Lee
et al., 2015), and unsupervised (Lin et al., 2014) ma-
chine learning techniques have been investigated on
text classifications (see, e.g., (Sebastiani, 2002) for a
survey). In particular, Naive Bayes is a simple, super-
vised text classifier, but its performance is sensitive to
data feature selections (Chen et al., 2009).
SVM is a widely-used text classifier that sepa-
rates data with maximal margins to hyperplanes for
reducing misclassification on training data (Tong and
Koller, 2002). It performs better than Naive Bayes.
We use linear SVM as the baseline classifier and as-
sume that the reader is familiar with SVM. Note that
SVM does not provide a word-to-category distribu-
tion.
The Latent Dirichlet Allocation (LDA) method
computes a word-to-category distribution (Blei et al.,
2003). LDA models the underlining topics for a cor-
pus of documents, where each topic is a mixture over
words and each document is a mixture over topics. It
is natural to associate a topic to a class. However,
LDA is an unsupervised model and it cannot label
classes.
Labeled LDA (LLDA), a natural extension of both
LDA and Multinomial Naive Bayes (Ramage et al.,
2009a), offers a solution, which overcomes a num-
ber of drawbacks in previous attempts of using LDA
to perform classifications, including Supervised LDA
(Mcauliffe and Blei, 2008), DiscLDA (Lacoste-Julien
et al., 2009), and MM-LDA (Ramage et al., 2009b).
Unlike SVM that puts a document in exactly one
category, that is, SVM associates each document with
exactly one label, LLDA can classify a document with
multiple labels, which is useful in a quick news sys-
tem. It was shown (Ramage et al., 2009a) that LLDA
beats SVM on tagged web page and a corpus from a
Yahoo directory.
To verify the accuracy of classification results on
news articles we would need to acquire a large corpus
of documents that have been classified by trained pro-
fessionals and use it as the ground truth. We were for-
tunate to have access to such a dataset, which consists
of news articles collected from over 120 national and
regional media websites in mainland China. These
news articles were classified by human editors into
a number of categories. We constructed two LLDA-
based classifiers called LLDA-C and SLLDA-C to
classify these news articles. To compare with SVM,
we restrict LLDA-C and SLLDA-C to classify a doc-
ument with exactly one label in our experiments.
We show that, through extensive experiments,
both LLDA-C and SLLDA-C outperform SVM (Sup-
port Vector Machine, our baseline classifier) on preci-
sions, particularly when only a small training dataset
is available. SSLDA-C is also much more effi-
cient than SVM. While LLDA-C is moderately better
Bai, Y. and Wang, J..
News Classifications with Labeled LDA.
In Proceedings of the 7th International Joint Conference on Knowledge Discovery, Knowledge Engineering and Knowledge Management (IC3K 2015) - Volume 1: KDIR, pages 75-83
ISBN: 978-989-758-158-8
Copyright
c
2015 by SCITEPRESS – Science and Technology Publications, Lda. All rights reserved
75

than SLLDA-C, it incurs higher time complexity than
SVM. In terms of recalls, we show that LLDA-C is
better than SVM, which is better than SLLDA-C. In
terms of average Macro-F
1
and Micro-F
1
scores, we
show that LLDA classifiers are superior over SVM.
To further explore classifications of news articles we
introduce the notion of content complexity, and study
how content complexity would affect classifications.
We show that, among the news articles correctly
classified by LLDA-C, SLLDA-C, and SVM, the
number of documents with one significant topic in
each category correctly classified by either LLDA-C
or SLLDA-C is larger than that by SVM. This may in-
dicate that SVM would do better on documents with
multiple significant topics. However, for the news ar-
ticles incorrectly classified by LLDA-C, SLLDA-C,
and SVM, this result does not hold.
In any case, for a document with multiple signif-
icant topics, it would be natural to assign it multiple
labels using an LLDA classifier, instead of just one
label as restricted by SVM.
The rest of the paper is organized as follows: We
briefly describe the LLDA model in Section 2, includ-
ing training and inference. In Section 3 we present
LLDA-C and SLLDA-C. In Section 4 we present ex-
periment results and conclude the paper in Section 5.
2 LABELED LDA
LLDA is a probabilistic graphical model based on
LDA devised by Ramage et al (Ramage et al., 2009a).
It models a document in a corpus as a mixture of top-
ics and topic-generated words, and constructs a one-
to-one correspondence between latent topics and la-
bels, from which a word-label (i.e., word-category)
distribution could be learned, where a label represents
a class. We provide a brief description of LLDA in
this section for the convenience of describing our al-
gorithms in Section 3. For more details of LLDA the
reader is referred to (Ramage et al., 2009a).
LLDA uses two Dirichlet distribution priors, one
for generating document-topic distribution with hy-
perparameter α
α
α, and one for topic-word distribu-
tion with hyperparameter β
β
β. LLDA also employs a
Bernoulli distribution prior with hyperparameter Φ
Φ
Φ,
which generates topic presence/absence indicators Λ
Λ
Λ
for a document. In other words, θ
θ
θ is a document dis-
tribution over topics constrained by Λ
Λ
Λ for mapping a
topic to a label, and ϕ
ϕ
ϕ is the topic distribution over
words that affect the generation of words with param-
eter z
w
, sampling from θ
θ
θ.
Let D be a corpus of M documents to be clas-
sified, indexed from 1 to M. We view each docu-
ment d as a bag of words w
w
w
(d)
= (w
1
,··· ,w
N
d
), where
N
d
is the number of words in document d. Then
D = {w
w
w
(1)
,··· ,w
w
w
(M)
}. Each word belongs to a fixed
vocabulary V
V
V = {w
1
,w
2
,··· ,w
V
}. Let
Λ
Λ
Λ
(d)
= (Λ
(d)
1
,··· ,Λ
(d)
K
)
denote the topic presence/absence indicator for doc-
ument d, where K is the total number of unique la-
bels in the training data and Λ
(d)
k
∈ {0,1} indicates
whether document d contains topic k. Thus, |α
α
α| = K,
|Φ
Φ
Φ| = K, and |β
β
β| = V .
2.1 Mixture Model
The number of topics K under the LLDA model is the
number of unique labels. In what follows, by “gener-
ate g ∼ G” we mean to draw (sample) g with distribu-
tion G, where g may also be a distribution. Let Mult
denote a multinomial distribution, Ber a Bernoulli
distribution, and Dir a Dirichlet distribution. A la-
beled document can be generated as follows (Fig. 1
is a standard graphical representation of the model),
where d represents document, k and z
i
∈ {1, · · · ,K}
represent topics, and w
i
∈ V represent words:
Figure 1: Graphical model of LLDA.
I. (Topic-word generation) For each topic k, gener-
ate ϕ
ϕ
ϕ
k
∼ Dir(· | β
β
β).
II. (Document-topic generation) For each d do the
following:
1. For each topic k, generate Λ
(d)
k
∼ Ber(· | φ
k
).
2. Compute α
α
α
(d)
= L
L
L
(d)
· α
α
α, where L
L
L
(d)
is an
L
d
× K matrix
h
l
(d)
i j
i
,
L
d
= |λ
λ
λ
(d)
|,
λ
λ
λ
(d)
= {k | Λ
(d)
k
= 1},
l
(d)
i j
=
1, if λ
(d)
i
= j,
0, otherwise.
KDIR 2015 - 7th International Conference on Knowledge Discovery and Information Retrieval
76

3. Generate θ
θ
θ
(d)
∼ Dir(α
α
α
(d)
).
4. For each w
i
in d, generate
z
i
∈ λ
λ
λ
(d)
∼ Mult(· | θ
θ
θ
(d)
),
w
i
∈ V
V
V ∼ Mult(· | ϕ
ϕ
ϕ
z
i
).
Let z
z
z
(d)
= (z
1
,··· ,z
N
d
).
In the topic-word generation process, a multino-
mial topic distribution over the vocabulary for each
topic k is generated, denoted by
ϕ
ϕ
ϕ
k
= (ϕ
k,1
,··· ,ϕ
k,V
).
In the document-topic generation process, a multi-
nomial mixture distribution over the topics for each
document d is generated, denoted by
θ
θ
θ
(d)
= (θ
(d)
1
,··· ,θ
(d)
L
d
),
which is restricted on its labels Λ
Λ
Λ
(d)
.
The vector λ
λ
λ
d
= {k|Λ
(d)
k
= 1} and the document-
specific projection matrix L
L
L
(d)
restrict the parameter
of a Dirichlet distribution prior α
α
α = (α
1
,··· ,α
K
) to
a lower dimension α
α
α
(d)
= L
L
L
(d)
· α
α
α with length L
d
=
∑
K
k=1
Λ
(d)
.
With a training dataset in hand, where each docu-
ment is properly labeled, we can obtain Λ
Λ
Λ directly.
2.2 Learning and Inference
Suppose that the values of parameters α
α
α and β
β
β are
given. For each document w
w
w
(d)
, we want to obtain
a label-word distribution and determine which cate-
gory this document would belong to. This means that
we would need to infer z
z
z
(d)
from w
w
w
(d)
, and we can do
so using collapsed Gibbs sampling for the probability
p(z
z
z
(d)
| w
w
w
(d)
).
Let z
z
z
(d)
−i
denote z
z
z
(d)
− {z
i
} and w
w
w
(d)
−i
denote
w
w
w
(d)
− {w
i
}. Let n
(w
i
)
−i, j
denote the total numbers of
word w
i
assigned to topic j excluding the current
assignment z
i
(Lakshminarayanan and Raich, 2011).
Following standard computations (Griffiths and
Steyvers, 2004) we have
p(z
i
= j | z
z
z
(d)
−i
,w
w
w
(d)
)
∝ p(z
i
= j,w
i
= t | z
z
z
(d)
−i
,w
w
w
(d)
−i
)
= E(θ
d j
) · E(ϕ
jt
)
where
E(θ
d j
) =
n
(t)
−i, j
+ β
t
W
(1)
E(ϕ
jt
) =
n
(d)
−i, j
+ α
(d)
j
T
(2)
W =
V
∑
t=1
n
(t)
−i, j
+
V
∑
l=1
β
l
(3)
T =
∑
k∈λ
λ
λ
(d)
n
(d)
−i,k
+
L
d
∑
k=1
α
(d)
k
(4)
We will need to establish ϕ
ϕ
ϕ from the training data,
and then classify test data by calculating the new topic
distribution with ϕ
ϕ
ϕ.
3 LLDA NEWS CLASSIFIERS
We devise two classification methods for news arti-
cles based on LLDA.
3.1 LLDA Classifier (LLDA-C)
LLDA-C consists of the following four steps:
1. Each document in the corpus has exactly one la-
bel, from which we can learn Λ
Λ
Λ directly (that is,
we can bypass Φ
Φ
Φ). It was noted that when Λ
Λ
Λ is
known, Φ
Φ
Φ is d-separated from the model (Ramage
et al., 2009a).
2. Learn ϕ
ϕ
ϕ using collapsed Gibbs sampling on the
training data with the specified values of α
α
α and β
β
β,
and the values of Λ
Λ
Λ learned in Step 1.
3. Inference on a new unlabeled document d using
Gibbs sampling. We have the following two cases
for calculating the sampling probability
p(z
i
= j,w
i
= t|z
z
z
(d)
−i
,w
w
w
(d)
−i
),
where d is the new document and w is a word that
appears in d.
Case 1: Word w is in the training data. Let p(w)
be the highest probability of word w under ϕ
ϕ
ϕ.
Then the sampling probability is the product of
Equation (1) and p(w).
Case 2: Word w is not in the training data, that is,
word w is not in ϕ
ϕ
ϕ. Then the sampling probability
is the product of Equation (1) and Equation (2).
Finally, infer θ
θ
θ
(d)
from the sampling probability
E(θ
d j
).
4. Assign a label k to document d if k is the topic
with the highest probability in θ
θ
θ
(d)
; that is, the
summation of probabilities of words under topic
k is the largest.
News Classifications with Labeled LDA
77
3.2 Simplified LLDA Classifier
(SLLDA-C)
SLLDA-C consists of the following four steps.
1. Obtain Λ
Λ
Λ from the training data in the same way
as Step 1 in LLDA-C.
2. Learn ϕ
ϕ
ϕ in the same way as Step 2 in LLLDA-C.
3. After ϕ
ϕ
ϕ is learned from the training data, extract
the top 20% the highest probability words for each
topic from ϕ
ϕ
ϕ as label related words.
4. Assign a label k to a document if the document
contains most topic related words with topic k.
These two classification methods each have their
own advantages. In the following section we will
show that LLDA-C is more accurate than SLLDA-C.
On the other hand, SLLDA-C is easier to implement
and much more efficient than LLDA-C. We may use
different methods in different situations to better meet
our needs.
3.3 Content Complexity
Given a document d, we will use its document-topic
distribution θ
θ
θ
(d)
to measure its content complexity.
We would like to understand how content complex-
ity may affect the classification results.
We say that a topic t contained in document d is
significant if the probability of t under the topic dis-
tribution θ
θ
θ
(d)
is greater than a threshold value v. In
this paper we choose v = 1/K, where K is the fixed
number of topics for the corpus.
If d contains only one significant topic, then we
say that it has a straightforward content-complexity,
and d is referred to as an SCC document. If d contains
two or more significant topics, then we say that it has
a high content-complexity, and d is referred to as an
HCC document.
4 EXPERIMENTS
To verify the accuracy of the LLDA classifiers we
constructed, we use Chinese news articles as test data.
The reason of choosing Chinese news articles is sim-
ply that we have access to a large corpus of news arti-
cles collected from over 120 national and local media
websites, and moreover, the news articles were classi-
fied into a number of categories by human editors. We
use this dataset to train LLDA-C and SLLDA-C and
test their accuracies. We note that the selection of a
particular language should not affect the accuracy of
the LLDA classifier, for the accuracy is determined
Table 1: Categories and the number of labeled news articles,
where NoA stands for “number of articles”.
Category NoA Category NoA
Politics 693 Health 479
Technology 444 History 295
Military 241 Real estate 347
Sports 549 Automobiles 500
Entertainment 929 Games 523
by the topic-word and document-topic distributions
learned by LLDA with the training data.
Table 1 lists the number of articles we selected
for the following 10 categories: Politics, Technology,
Military, Sports, Entertainment, Health, History, Real
estate, Automobiles, and Games. We select 5,000
news articles in these 10 categories as training data.
4.1 Chinese Text Fragmentation
To process Chinese text documents, we need to seg-
ment the Chinese characters into meaningful words
(that is, a sequence of two or more Chinese charac-
ters) for a given document. We use Jieba, an open-
source Chinese text segmentation tool, to carry out
fragmentation for Chinese text. In addition, we also
use authentic Chinese stop words, preposition words,
and pronoun words to filter unnecessary words.
Different from English text, we do not need to ex-
tract stems of verbs for Chinese text documents since
tenses in Chinese are represented by words that mod-
ify verbs, not by the tenses of verbs. There are neither
prefix nor suffix in any Chinese character. Thus, cor-
rect segmentation and appropriate filtering are impor-
tant to obtain efficient and accurate text classification.
4.2 Parameters
For a given corpus of labeled documents, we view the
total number K of different labels as the total num-
ber of topics for the corpus. It is conventional to let
(Griffiths and Steyvers, 2004)
α
k
= 50/K, k = 1, · · · , K,
β
i
= 0.1, i = 1, ·· · ,V .
(These seem to be the best empirical values for these
two hyperparameters).
For a labeled document d in the training data, we
set Λ
(d)
to indicate which labels d belongs to. We use
the Collapsed Gibbs sampling method to sample each
topic to learn ϕ
ϕ
ϕ and θ
θ
θ
(d)
(Darling, 2011) by counting
the total number of words for each topic in each doc-
ument and the total number of each word under each
topic.
KDIR 2015 - 7th International Conference on Knowledge Discovery and Information Retrieval
78
4.3 Experiment Framework
We use a linear SVM as a baseline classifier, where
words with high TF-IDF scores are used as features.
Since SVM can only classify each news article into
exactly one category, for each document, LLDA-C
classifies it into the category by the label with the
highest probability in the document-topic distribu-
tion, and SLLDA-C classifies it into the category by
the label for which the document has the most top
topic words.
We execute our experiments on a server running
QEMU Virtual CPU version 1.2.0 with 2.6 GHz and
16 GB RAM.
For each experiment on a given training dataset
S, which may be the entire training dataset of 5,000
news articles or a random subset of it, we select 80%
of S uniformly at random as the training set and the
remaining 20% as the testing set. We run each ex-
periment on the same dataset S for M = 10 rounds
and take the average result for each of the following
measurements: precision, recall, Micro-F
1
score, and
Micro-F
2
score.
Our experiments consist of three parts. In the
first part we compare the overall precisions, overall
recalls, and the running time of LLDA-C, SLLDA-
C, and SVM. In the second part we compare the
Macro-F
1
and Micro-F
1
scores for each category un-
der LLDA-C, SLLDA-C, and SVM. In the third part
we compare the classification results on documents of
different content complexity.
4.4 Accuracy Measurements
In each round i, i = 1, 2, ·· · ,M, let P
i
denote the pre-
cision, R
i
the recall, T P
i
the number of true positives,
FP
i
the number of false positives, and NF
i
the number
of false negatives. Then
P
i
=
T P
i
T P
i
+ FP
i
(5)
R
i
=
T P
i
T P
i
+ FN
i
(6)
The overall precision P and the overall recall R are
calculated by, respectively, the following formulas:
P =
∑
M
i=1
P
i
M
(7)
R =
∑
M
i=1
R
i
M
(8)
Let P
0
denote the Micro-average precision and R
0
the Micro-average recall. Then
P
0
=
∑
M
i=1
T P
i
∑
M
i=1
(T P
i
+ FP
i
)
(9)
R
0
=
∑
M
i=1
T P
i
∑
M
i=1
(T P
i
+ FN
i
)
(10)
The Macro-F
1
score and the Micro-F
1
score for
the given dataset are calculated by
Macro-F
1
=
2(P · R )
P + R
(11)
Micro-F
1
=
2(P
0
· R
0
)
P
0
+ R
0
(12)
4.5 Overall Precision and Recall
Comparisons
Table 2 lists the overall precision and recall results for
LLDA-C, SLLDA-C, and SVM for the given dataset
of 5,000 news articles.
Table 2: Overall precisions and recalls of classifiers on the
dataset of 5,000 news articles.
LLDA-C SLLDA-C SVM
Precision 0.905 0.894 0.884
Recall 0.881 0.867 0.875
We then evaluate the precisions and recalls for
datasets of different sizes by using data sets of 100,
200, 300, 500, 1,000, 2,000, 3,000, 4,000, and 5,000
news articles selected uniformly at random from the
training dataset. Fig. 2 shows our experiment results,
where the horizontal axis represents the volume of the
datasets, and the vertical axis represents the overall
precisions.
From Fig. 2, Fig. 3 and Table 2 we can conclude
the following:
1. For all classifiers, larger training set will produce
higher accuracy.
2. LLDA-C has higher precision and recall than
SLLDA-C and SVM.
3. SLLDA-C has higher precision than SVM, but has
lower recall than SVM.
4. For a small training set with items less than 500,
LLDA-C still produces high accuracy, much bet-
ter than SVM. Thus, LLDA-C is a clear winner,
particularly when we have new classifications for
new types of data. We may use LLDA-C with a
small set of training data to achieve classification
results of over 75% precision.
Fig. 4 shows the log scale of the running time for
SLLDA-C, LLDA-C, and SVM on datasets of differ-
ent sizes. The running time of LLDA-C depends on
News Classifications with Labeled LDA
79
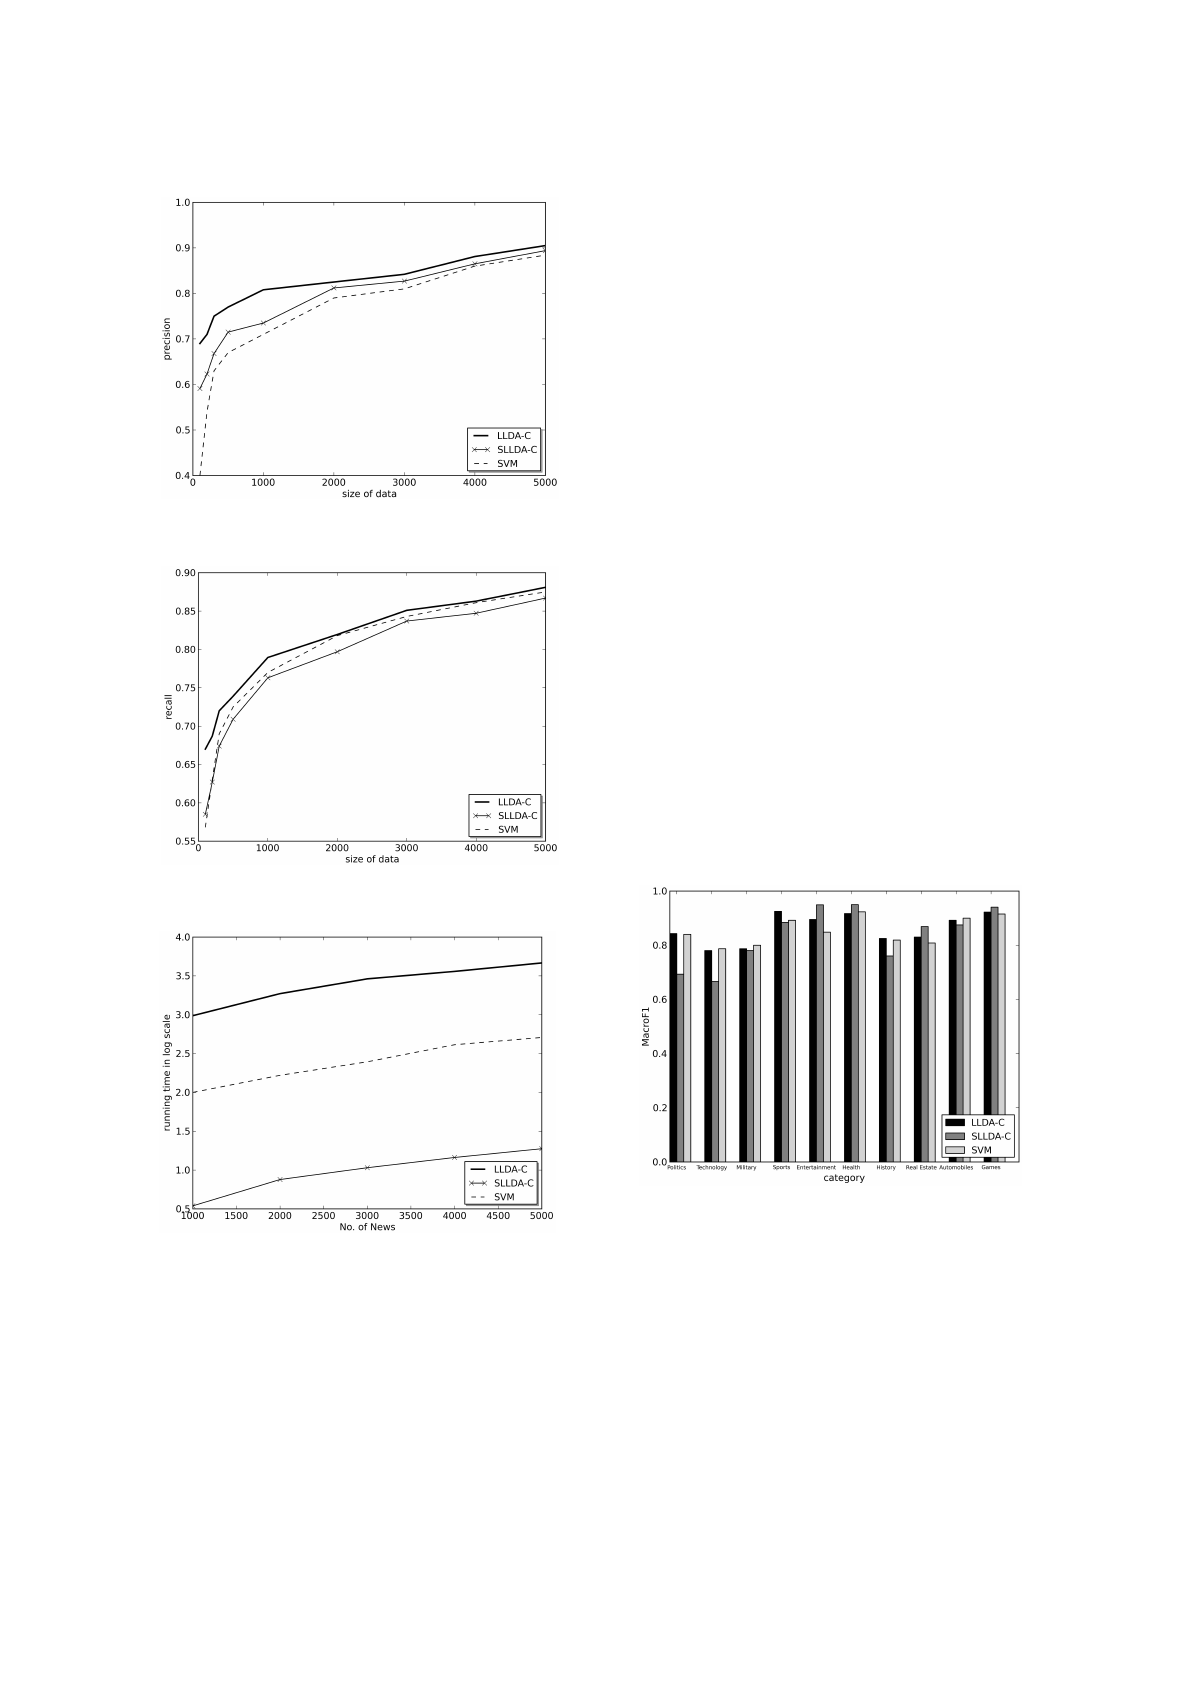
Figure 2: Comparison of overall precisions of LLDA-C,
SLLDA-C, and SVM.
Figure 3: Comparison of overall recalls of LLDA-C,
SLLDA-C, and SVM.
Figure 4: Log scale of running time for LLDA-C, SLLDA-
C, and SVM.
the numbers of iterations in Gibbs sampling, which
we set to 100. From Fig. 4 we can see that SLLDA-
C is much more efficient than SVM, which is more
efficient than LLDA-C.
4.6 Comparisons of Macro-F
1
and
Micro-F
1
Scores
The comparisons presented here are obtained from the
entire training set of 5,000 news articles, shown in
Figs. 5 and 6. We can see that LLDA-C (the blue
bars), SLLDA-C (the green bars), and SVM (the red
bars) for Macro-F
1
scores in each category are about
the same for Micro-F
1
scores, respectively. More-
over, the blue bars and the red bars are about the same
heights for each category in either score, with LLDA-
C doing slightly better (more blue bars are higher than
red bars). In particular, we can see that for 7 out 10
categories on Macro-F
1
scores, either the blue bar or
the green bar is higher than the red bar; and for 8 out
of 10 categories on Micro-F
1
scores, either the blue
bar or the green bar is higher than the red bar. This
indicates that the LLDA-based classifiers are superior
to SVM.
We can also see that SLLDA-C (the green bars)
sometimes is much better than both LLDA-C and
SVM, such as in the category of Entertainment; some-
times is much worse, such as in the category of Tech-
nology, and sometimes is about the same, such as in
the categories of Automobiles. Overall, SLLDA-C is
better than both LLDA-C and SVM in four categories
for each type of scores. It would be interesting to fur-
ther investigate why this would be the case and in-
crease the accuracy of SLLDA-C.
Figure 5: Comparison of Macro-F
1
scores.
4.7 Content Complexity
We use the entire training set of 5,000 news articles
to run this experiment. In each round, we calculate
θ
θ
θ
(d)
for each news articles d, count the numbers of
SCC and HCC documents, and record the numbers of
SCC and HCC documents that are correctly classified.
Finally, we calculate the percentage of SCC in the test
data. The results are shown in Figs. 7–9.
KDIR 2015 - 7th International Conference on Knowledge Discovery and Information Retrieval
80

Figure 6: Comparison of Micro-F
1
scores.
Figure 7: Percentage of SCC documents in news articles
correctly classified by LLDA-C, SLLDA-C, and SVM in
each category.
We can see that for documents correctly classified
by LLDA-C, SLLDA-C, and SVM, the percentages
of SCC documents in each category are roughly the
same for LLDA-C and SLLDA-C, which are all larger
than that of SVM. For documents incorrectly classi-
fied by LLDA-C, SLLDA-C, and SVM, the percent-
ages of SCC documents in each category are much
different and there is no clear pattern.
We note that for an HCC document, it is better for
an LLDA classifier to give it multiple labels, instead
of just one label as restricted by SVM.
Fig. 9 shows the the percentage of SCC doc-
uments under each category. From this figure and
the previous figures on macro and micro F
1
scores
(Figs. 5 and 6) we can see that, for categories that
LLDA-C and SLLDA-C have larger Macro and Mi-
cro F
1
-scores than SVM, such as categories Real es-
tate and Games, they tend to either contain more
SCC documents or they contain a significant percent-
age of SCC documents. For categories that LLDA-
C and SLLDA-C have smaller Macro and Micro F
1
-
scores than SVM, such as categories of Technology
Figure 8: Percentage of SCC documents in misclassifica-
tions by LLDA-C, SLLDA-C, and SVM in each category.
Figure 9: Percentage of SCC and HCC in the test data.
and Military, they contain significantly more HCC
documents.
4.8 Example
The following is an example news item (translated
from Chinese to English with consistent translation
of top words), with a correct label of Technology:
The Zhuhai Radio and Television station plans
to launch a live service to its users. The tele-
vision station deploys unmanned aircrafts to
perform realtime recording and send realtime
network data back to the station. Transmis-
sion of pictures and video via cell phone sig-
nals is made easier than before, significantly
increasing efficiency. Zhuhai online mobile
phone users could log on to the station’s web
site and watch the current traffic conditions.
The unmanned aircraft takes video of traffic in
intersections and transmits the video through
the Internet to the station’s web site. The user
clicks the traffic video on their browser, which
allows them to easily view the surrounding
traffic situations and acquire parking informa-
tion. This brings a new experience to the gen-
News Classifications with Labeled LDA
81

eral public.
This news item is labeled incorrectly as Military
by the linear SVM classifier.
LLDA-C computes the document-topic distribu-
tion for this news item shown in Table 3, from which
we can see that Technology has the highest document-
topic distribution, and so LLDA-C labels this news
item correctly as Technology.
Table 3: Document-topic distributions for the example news
item, where DTD stands for “document-topic distribution”.
Technology has the highest DTD of 0.379, Politics has the
second highest DTD of 0.192, and Military has the third
highest DTD of 0.104.
Category DTD Category DTD
Politics 0.192 Health 0.039
Technology 0.379 History 0.052
Military 0.104 Real estate 0.039
Sports 0.052 Automobiles 0.065
Entertainment 0.039 Games 0.039
For SLLDA-C, it first computes the top words in
each category in the training dataset (translated from
Chinese to English). Table 4 lists the top 19 words
for each of the categories of Politics, Technology, and
Military in the training dataset. The top words for the
other categories are omitted for this example.
Table 4: The top 19 words in each of the categories of Poli-
tics, Technology, and Military for SLLDA-C classification.
Politics Technology Military
development intelligent UAV
construction internet Equipment
countryside network arms
issue market military
agriculture innovation troops
cadres business target
strengthen science reconnaissance
reform user aircraft
government robot political
economy technology fight
leadership apple missile
plan service task
politicy computer aircraft
project online army
implement advertisement attack
innovation password achieve
further data test
management Silicon Valley antitank
conference signal engine
For this example, SLLDA-C computes the num-
ber of top words in each category that this news item
contains, and the result is shown as follows, where
abc indicates that the word “abc” is in the category of
Politics, abc in the category of Technology, and
:::
abc
in the category of Military. The other categories of
words are omitted for this example.
The Zhuhai Radio and Television station plans
to launch a live service to its users. The tele-
vision station deploys unmanned
::::::
aircrafts to
perform realtime recording and send realtime
network data back to the station. Transmis-
sion of pictures and video via cell phone sig-
nals is made easier than before, significantly
increasing efficiency. Zhuhai online mobile
phone users could log on to the station’s web
site and watch the current traffic conditions.
The unmanned
::::::
aircraft takes video of traffic in
intersections and transmits the video through
the Internet to the station’s web site. The
user clicks the traffic video on their browser,
which allows them to easily view the sur-
rounding traffic situations and acquire parking
information. This brings a new experience to
the general public.
We can see that this news item contains the largest
number of top words in the category of Technology
(the number is 7). The number of top words in each
of the other categories is all smaller than 7 (in this ex-
ample we only list the top words in three categories).
Thus, SLLDA-C correctly labels this news item as
Technology.
5 CONCLUSIONS
We conclude that both LLDA-C and SLLDA-C out-
perform SVM on precisions, particularly when only
a small training dataset is available, where SSLDA-
C is much more efficient than SVM. We showed
that LLDA-C is moderately better than SLLDA-C on
precisions, recalls, and both Macro-F
1
and Micro-F
1
scores, while LLDA-C incurs higher time complexity
than SVM. In terms of recalls, LLDA-C is better than
SVM, which is better than SLLDA-C. In terms of av-
erage Macro-F
1
and Micro-F
1
scores, the LLDA clas-
sifiers are better than SVM. To further explore classi-
fication properties we introduced the concept of con-
tent complexity and showed that among the news arti-
cles correctly classified by LLDA-C, SLLDA-C, and
SVM, the number of SCC documents in each category
correctly classified by either LLDA-C or SLLDA-C is
larger than that by SVM. However, for the news ar-
ticles incorrectly classified by LLDA-C, SLLDA-C,
and SVM, this result does not hold.
For the applications with news classification (Bai
et al., 2015), if new categories are created for appli-
cations, it is much better to start with LLDA-C, for it
KDIR 2015 - 7th International Conference on Knowledge Discovery and Information Retrieval
82
can do well on a small number of labeled documents.
To classify a new article, we may first use SVM to
classify it into a larger comprehensive category that
contain multiple topics. We then either use LLDA-C
or SLLDA-C to classify it into a more specific subcat-
egory.
ACKNOWLEDGEMENT
The authors thank an anonymous reviewer for inspir-
ing them to consider content complexity. This work
was supported in part by the NSF under grant CNS-
1331632 and by a grant from Wantology.
REFERENCES
Bai, Y., Yang, W., Zhang, H., Wang, J., Jia, M., Tong, R.,
and Wang, J. (2015). Kwb: An automated quick news
system for chinese readers. page 110.
Blei, D. M., Ng, A. Y., and Jordan, M. I. (2003). La-
tent dirichlet allocation. volume 3, pages 993–1022.
JMLR. org.
Chen, J., Huang, H., Tian, S., and Qu, Y. (2009). Feature
selection for text classification with na
¨
ıve bayes. vol-
ume 36, pages 5432–5435. Elsevier.
Chen, X., Xia, Y., Jin, P., and Carroll, J. (2015). Data-
less text classification with descriptive lda. In Twenty-
Ninth AAAI Conference on Artificial Intelligence.
Darling, W. M. (2011). A theoretical and practical imple-
mentation tutorial on topic modeling and gibbs sam-
pling. In Proceedings of the 49th annual meeting of
the association for computational linguistics: Human
language technologies, pages 642–647.
Griffiths, T. L. and Steyvers, M. (2004). Finding scientific
topics. volume 101, pages 5228–5235. National Acad
Sciences.
Lacoste-Julien, S., Sha, F., and Jordan, M. I. (2009). Dis-
clda: Discriminative learning for dimensionality re-
duction and classification. In Advances in neural in-
formation processing systems, pages 897–904.
Lakshminarayanan, B. and Raich, R. (2011). Inference
in supervised latent dirichlet allocation. In Machine
Learning for Signal Processing (MLSP), 2011 IEEE
International Workshop on, pages 1–6. IEEE.
Lee, S., Kim, J., and Myaeng, S.-H. (2015). An extension
of topic models for text classification: A term weight-
ing approach. In Big Data and Smart Computing (Big-
Comp), 2015 International Conference on, pages 217–
224. IEEE.
Lin, Y.-S., Jiang, J.-Y., and Lee, S.-J. (2014). A similarity
measure for text classification and clustering. Knowl-
edge and Data Engineering, IEEE Transactions on,
26(7):1575–1590.
Mcauliffe, J. D. and Blei, D. M. (2008). Supervised topic
models. In Advances in neural information processing
systems, pages 121–128.
Ramage, D., Hall, D., Nallapati, R., and Manning, C. D.
(2009a). Labeled lda: A supervised topic model for
credit attribution in multi-labeled corpora. In Proceed-
ings of the 2009 Conference on Empirical Methods in
Natural Language Processing: Volume 1-Volume 1,
pages 248–256. Association for Computational Lin-
guistics.
Ramage, D., Heymann, P., Manning, C. D., and Garcia-
Molina, H. (2009b). Clustering the tagged web. In
Proceedings of the Second ACM International Confer-
ence on Web Search and Data Mining, pages 54–63.
ACM.
Sebastiani, F. (2002). Machine learning in automated text
categorization. volume 34, pages 1–47. ACM.
Tong, S. and Koller, D. (2002). Support vector machine
active learning with applications to text classification.
volume 2, pages 45–66. JMLR. org.
News Classifications with Labeled LDA
83
