JFA Platform for Football Analysis
Fábio
Silva
1
,
Pedro
Passos
2
and
Octavian
Postolache
1
1
ISCTE-Instituto
Universitário
de
Lisboa, Lisboa, Portugal
2
CIPER, Faculdade de Motricidade Humana, Universidade de Lisboa,
Lisboa,
Portugal
Keywords: Football, Performance Analysis, Collective Behavior, Interpersonal Distances.
Abstract: The aim of the article was to present a Java Platform for Football Analysis, designed and implemented
for
football game analysis. The framework presents capability on game analysis based on players
coordinates
inputs and helping coaches and players to extract information from processed games. The
analysis tools to
achieve this aim used collective metrics based on player’s positioning on the three team
sectors: defensive;
middle and; offensive. This allows analyzed player’s collective behaviors before critical
situations (e.g.,
shot on goal). Data revealed that a decrease on interpersonal distances between the defensive
sector and the offensive sector affords an opportunity to score.
1
INTRODUCTION
Football has a large impact in our society. Starting
with the media to entrepreneurs, also going through
all the supporters who weekly fill football stadiums
around the world. This phenomenon leads to the in-
crease of frameworks linked to football. These frame-
works can range from the simple application, which
allows watching the games and results in real time,
to the more complex ones that collect data, process
data and calculate game statistics, such as team ball
possession, individual players distance traveled or in-
dividual player’s number of passes performed.
One issue that hasn’t been fully explored is the
player’s collective behavior during a match. The idea
of this kind of analysis is to find out, collective met-
rics which accurately describe the interactive behav-
ior of a set of players. Therefore, the aim of this
study was to create an user friendly platform where
performance analysts and coaches can easily analyze
player’s collective behaviors, usually associated to
tactical performance.
Recent studies have been create and developed
several coordinative variables aiming to analyze col-
lective performance in team sports (McGarry et al.,
2002) (Frencken et al., 2012) (Vilar et al., 2012). As
an exploratory work, for our platform we decided to
use players interpersonal distances as the coordinative
variable which describes player’s interactive behav-
ior (Duarte et al., 2012). This variable allows us to
collect data of intrateam and interteam collective be-
haviors. One main issue of our work was to relate the
behavior of this collective variable with player’s team
performance. Thus our platform provide the follow-
ing options: i) uploading data games files (from video
cameras or GPS); ii) analyze data directly on the plat-
form; iii) export data in a csv format; iv) select the
game time window. All this in just one click away
and totally user-friendly. Therefore, the main goal of
this study is to develop an analysis platform in web
browser environment capable of supporting sports an-
alysts and coaches on decision making and team per-
formance analysis.
2
RELATED WORK
This platform increases the ease of access of data
analysis. The main goal to achieve with this platform
is that team’s sports analysts or simple practition-
ers which have access to any data collection device
(e.g., GPS) may upload data and analyze team col-
lective performance. Moreover as previously stated
this platform provides data mainly focus on collective
behavior analysis, for instance the interpersonal dis-
tance between a team defensive ‘line’ and the opposi-
tion team offensive ‘line’. This goes beyond the most
common notational analysis mainly focus on the fre-
quency os passes performed or distances traveled by
the players.
Silva, F., Passos, P. and Postolache, O..
JFA Platform for Football Analysis.
In Proceedings of the 3rd International Congress on Sport Sciences Research and Technology Support (icSPORTS 2015), pages 345-351
ISBN: 978-989-758-159-5
Copyright
c
2015 by SCITEPRESS – Science and Technology Publications, Lda. All rights reserved
345
2.1
Sports Platforms
Most of the platforms that are currently on the market
have its main focus on the notation of each individual
player technical skills and/or physical abilities.
Inmotio (Inmotio, 2015) is one of those platforms.
Its main modules support three main areas: i) phys-
ical analysis; ii) injury prevention; and iii) tactical
analysis. The first two modules are used by various
teams to improve physical conditioning, player’s in-
dividual performance and even to help in the player’s
injury recovery. In the tactical analysis, we see some
metrics like: i) Transition moments; ii) ball posses-
sion statistics of both teams; iii) the number of passes
when there was ball possession; iv) the duration of the
ball possession; v) pass options to detect and visualize
the pass options of a player during a game.
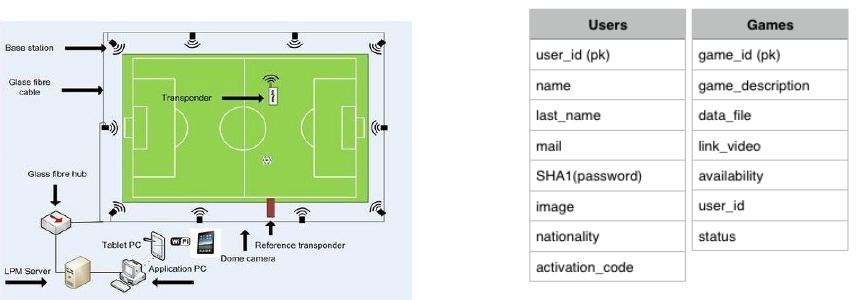
Data collection is done by technology LPM (Local
Position Measurement), which is based on a wireless
communication system. It’s a sort of technology is
already very used, but requires players to use a trans-
mitter to communicate their position at every moment
of the game to the base station, how we can see in
Figure 1. The position calculation is performed au-
tomatically and in real time (live) and therefore the
measured data can be analyzed even during the mea-
surements.
Figure 1: LPM technology (Adapted from (Inmotio,
2015)).
Viper Software (Technologies, 2015) is another
platform that uses this type of data collection. It has
a similar approach to Inmotio, however it has a mod-
ule of tactical analysis rather interesting for selecting
blocks of players and interpret their collective perfor-
mance in critical moments. One of drawback of this
platform is that it doesn’t allow us to visualize the
ball’s position at every moment.
With the players is easy to have their position
through the transmitter, but the ball position implies
the usage of transceiver attached to the ball. By video
observation the ball tracking is possible. Inmotion has
developed this kind of technology and it is, also, pos-
sible to get the position of several balls during train-
ing.
2.2
Technology
This game analysis platform has been developed us-
ing Bootstrap (Bootstrap, 2015), a powerful open-
source framework for creating web applications. It
contains HTML and CSS design templates for inter-
face and uses JavaScript to define and interact with
buttons, forms and other interfaces. It was
also used
another framework - Code Igniter based on
Model-
View-Controller development pattern. Used
for
building dynamic web sites with PHP. This frame-
work allows to create the connection to the database
and manages inserts, deletes and updates. Another
very important feature is the creation of controllers of
each web page that we have in the framework. The
controllers permit the passage of data to the database
by the POST Method, i. e., the values are sent by a
HTTP message and not written in the page URL (GET
method), because in this way, everyone could have ac-
cess to confidential data. The controllers also allow
redirect one page to another.
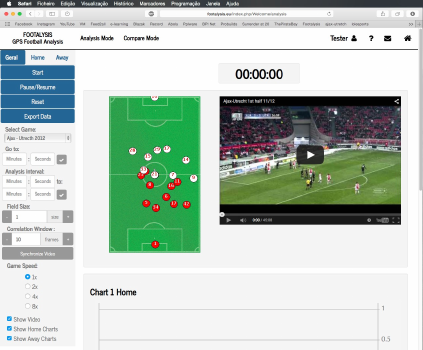
Figure 2: Database tables.
The database only has two tables. In the Figure 2
we
can see the attributes of users and he game tables.
Both are identify with id.
The password will be encrypted with SHA1 (Se-
cure Hash Algorithm) (Eastlake 3rd and Jones, 2001)
and stored in the database. This kind of encryption
only works in one way, i.e., we can always generate
the same encryption code using the password, but we
can’t get the password from encryption code. The
activation code is necessary to prevent register from
bots (piece of software designed to complete a minor
but repetitive task automatically) on our website. The
email field is used as username for the user login, it
PerSoccer 2015 - Special Session/Symposium on Performance Analysis in Soccer: How does Technology Challenge Current Practices? -
3rd Edition
346
is a unique key. It is also asked for the name of each
user and their nationality, because it’s interesting to
know how many countries are reached by our frame-
work. Finally, the image is optional and is only for
user identification. If the login is done through API
Google with a Google account (one of the functions
provided to register), the user’s image is the image
that is associated with that account.
The game’s table contains a description of the
game and it can only be the name of the teams that are
competing. It contains the data file with the respective
coordinates, which will be explain in detail in subsec-
tion 3.1, Data Collection. The link field contains the
URL of the video, which is preloaded on a video shar-
ing platform. The availability on the game’s table, in-
dicates which games are available for all users or only
to the user who uploaded the game. If the availability
is public, all users have access to the game, if it’s pri-
vate, only the user who uploaded have access to the
game. That user is identified by user id that works as
a foreign key. Lastly, the status is a Boolean: if status
= false, game is not approved yet, status = true, game
is already approved.
3
SOFTWARE
IMPLEMENTATION
With the aim to be generic, the platform is im-
plemented as a web service. Using a computation
unit expressed by a PC or tablet with an installed
web browser and internet access the developed game
analysis is accessible without restrictions. Comparing
with windows based applications designed for game
analysis the web based platform may be used
through the browser independent by the operation
system.
3.1
Data Collection
The used data to test the developed platform have
been video recorded at 25 fps (frames-per-second).
Due to data collection technological constraints this
video data are coordinates x and y
for the 22 players
in the game (home team and away
team), and
coordinates x, y and z for the ball. The file
containing this data is in .csv (comma-separated
values) format. Our platform affords to load another
files
for further analysis. This file has to comply
with the
format and specific rules to be correctly
interpreted in
the virtual simulator.
These data were provided by SportVU (SportVU,
2015) for testing. These data are from a match of
the Dutch League of the 2011/2012 season, which
ended with the victory of the away team by 0-2.
3.2
Web Interface
As we can see in the Figure 3 below, the GUI is
ex-
pressed by a control panel with some options to
interact with the applet, we have a video that has
to
be previously loaded from a video-sharing
website
like Youtube, lastly we have charts that
show metrics
about the game.
Figure 3: Panel options in analysis mode.
To access the interface showed in Figure 3 is re-
quired to make the registration in the website. After
registration, any registered user may upload the video
and coordinates to our platform. (If the file isn’t
available in this moment, it’s because we need to
validate
him). The file must comply with the
formatting rules,
which
they are explained on the
screen where the upload is
done. Data integrity must
be maintained. It is difficult to ensure that files are
always sent in the
correct format. Due to this, it is
necessary to make a
manual validation to the file
after the upload is done,
so is only available for
analysis after that validation
has been successfully
performed.
Some of the analysis mode functionalities are
graphical expressed in Figure 4. Three groups of
options were considered:
•
General option – includes information related to
both teams;
•
Home option – includes information for the
home
team;
•
Away option – include information for the away
team;
JFA Platform for Football Analysis
347
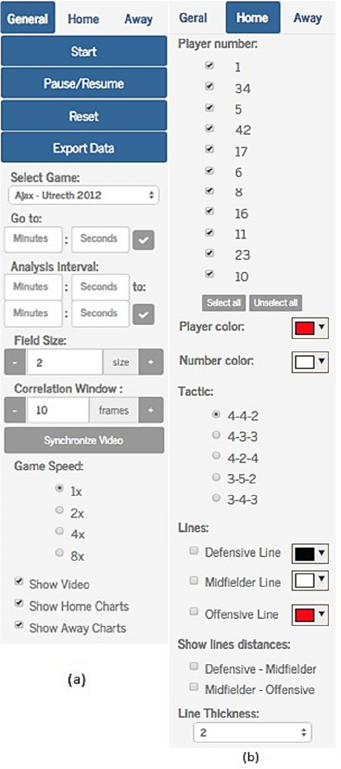
3.2.1
General Options
In this tab we have the standard options, like: ’Start’,
’Pause/Resume’ and ’Reset’. These options make
the interaction with the virtual representation and the
video. Another implemented functionality is ’Export
Data’. This
one makes it possible to export data in
csv format that
is collected throughout the game. We
have the possibility to choose the analyzed period of
time and the metrics that are considered for each
team.
Figure 4: Platform control panel in analysis mode: (a) gen-
eral options, (b) options for each team (home in this case).
Options such as:
forward in time, analysis period
setup, change the correlation window, change the
field size and change the
game speed are presented
in Figure 4. a..
3.2.2
Home/Away Options
In Figure 4.a. we only can see ’Home’ tab because
the options are the same, regardless of team. In the
beginning we have all the players identified by num-
ber, along with a checkbox. This checkbox allows
the player to appear or not in the field (virtual repre-
sentation). We can change the colors of equipment
and numbers of the players. It’s possible to select
the
tactics of each team. This option is very impor-
tant
because it’s based on a tactic where the lines are
calculated: defensive, midfielder and offensive. You
can see them in the virtual representation with their
respective colors. You can choose the line color us-
ing the checkbox and the color picker. Another op-
tion, which is much easier to see without resorting to
graphic, is ’Show Lines Distances’, which will show
the distance, in meters, between the lines. Finally, the
last option allows the thickness increase of the line,
only for visual effects.
3.2.3
Analysis Mode/Compare Mode
The framework has two modules: Analysis mode and
Compare Mode. Both of this modes, contains: i) vir-
tual representation of the game; ii) video of the game;
iii) timer; iv) charts. In the first one, we have an anal-
ysis of one game, with the options mentioned in 3.2
Web Interface. The charts show the metrics we ana-
lyze in the framework, it’s explained on the subsection
metrics 3.4. We have two charts, one for each team,
and each chart presents the distance between lines and
their correlation. We use two axes to present the met-
rics in the same chart.
The second one, Compare Mode, has as main goal
compare two different parts of the game. For exam-
ple, we want to see the behavior of the team, in the
first 10 minutes, and compare it with the last 10m in
the first half. In this mode, this kind of approach is
possible. The time is totally customizable, i.e., we can
choose the analysis interval we want. In this window
is showed two virtual representations, and four charts,
two for each part we are comparing. The panel con-
trol is almost the same, having only one more option
that allows us to select the time each part of the game
that we will compare.
3.3
Game Virtual Representation
The g a m e virtual representation was implemented
in Java and exposed on browser as an applet (Farrell,
2011).
As it can be observed in the Figure 5, a
simplified representation of a football game is
PerSoccer 2015 - Special Session/Symposium on Performance Analysis in Soccer: How does Technology Challenge Current Practices? -
3rd Edition
348
provided the included elements were: 22
players and
1 ball. The representation is updated at 25 frames
per second. The implemented applet
performs file
reading and shows the information contained on the
pitch. Many of the functions available
on the
interface web are interpreted by the applet, like
export data, fast forward or step in the time during the
game.
Figure 5: Example of virtual representation with applet.
Java Technology was chosen due to the facts:
•
Cross-platform solution web (Windows, OS X
and
Linux);
•
Totally scalable with the number of users / clients;
•
Java applets are fast - similar performance to na-
tive installed software;
•
Easy to develop with java language and debug the
applet.
3.4
Metrics
The perception of the space is a crucial issue to de-
cide and act during a football match. The space be-
tween lines (e.g., the distance between the midfielder
line and the defensive line) may provide the players
with different opportunities for action (e.g., shot on
goal; or pass to a team mate). Passos et al., (2011)
and Duarte et al., (2012) used the player’s interper-
sonal distances as coordinative variable to describe
player’s interactive behavior during the game. Thus
to measure the space that is available we used the dis-
tance between imaginary horizontal lines, parallel to
the field end line. Accordingly the distance to the goal
the lines under analysis were i) the defensive line; ii)
the midfielder line; and iii) the offensive line.
3.4.1
Distance between Lines
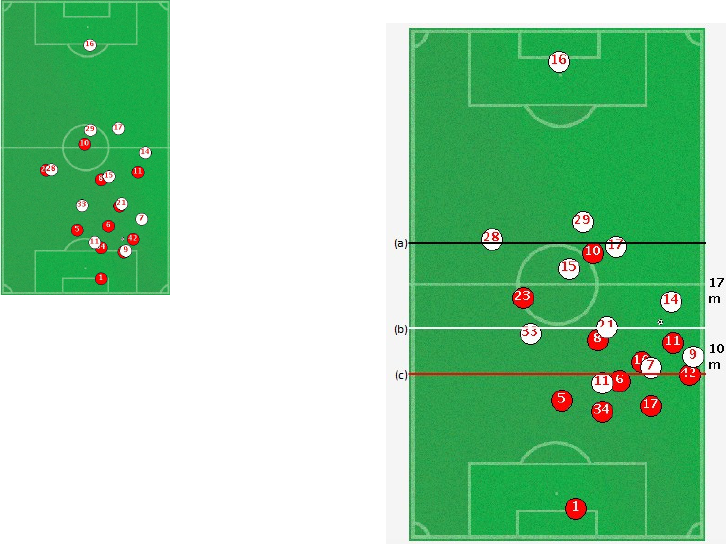
Figure 6 pr ese n ts the lines madden by the
three-
team sectors. The computation of these lines,
which
defines each sector, depends by the current
tactic
chosen for the team. In presented case, the team was
chosen 4-4-2 as tactical system. Accordingly with
the team
tactical system it is possible to change the
computed lines, through the GUI, as it can be
observed in Figure 4.b.
The defensive line is
computed based on the position of
the four players
closest to the pitch bottom line (i.e.,
the pitch end
line; the end line closest its own goal).
Figure 6: Representation of the lines during the game: (a)
defensive line, (b) midfielder line, (c) offensive line. The
values on left side show the distance between lines in me-
ters.
The midfielder line is composed by the next four play-
ers, and the offensive line by the two players farthest
the pitch end line. Note that the goalkeeper positions
it wasn’t used to calculate these lines.
The computation of these lines takes into account
the dynamic of player’s position, which means that
when a defending player collaborate in a team offen-
sive phase, he contributes to the computation of the
midfielder or offensive line. The same is true when a
midfielder backs on the pitch to collaborate with de-
fending functions. That player will contribute to the
computation of the defensive line. With these options,
the platform ensure that the team tactical system is re-
spected, although the players, being defenders or at-
tackers, contribute to different lines over time.
JFA Platform for Football Analysis
349
3.4.2
Correlation between Lines
Correlation is a statistical linear technique to measure
how well two sets of data are related. In this case, it
was used, the Pearson Coefficient of Correlation. The
values of this correlation will be between -1 and 1.
When the correlation value approaches to zero, there
is a greater variability of the set of data around the line
of best fit (Benesty et al., 2009). Correlation values
can be classified as such:
•
Strong correlation: 0.5 to 1.0 or -0.5 to -1.0
•
Moderate correlation: 0.3 to 0.5 or -0.3 to 0.5
•
Weak correlation: 0.1 to 0.3 or -0.1 to -0.3
,2 2 2 2
()()
[()]
·,
)]·[ (
Nxy x y
r
Nx x Ny y
−
=
− −
(1)
In this case, the Pearson coefficient of correlation
was used to relate the distances between lines (e.g.,
defensive line with the midfielder line; midfielder line
with the offensive line). Examining how this relation-
ship between lines varies throughout the game, may
provide information regarding the players collective
behavior before critical moments (e.g., shots on goal).
4
RESULTS AND DISCUSSIONS
To test the utility of the platform and implemented
metrics we will analyze a critical situation more
specifically the moments before the goal in a foot-
ball match of the Dutch League that occurred after
the minute 39:40. The move that preceded the goal
of the away team (i.e., white team) begins with loss
of ball possession of the home team (i.e., red team) at
minute 39:31. Bellow it was provided exemplar data
of the movements of the lines of both teams analyzed
for an intrateam perspective and for an interteam per-
spective, in the moments before goal scoring.
4.1
Intra Team Analysis
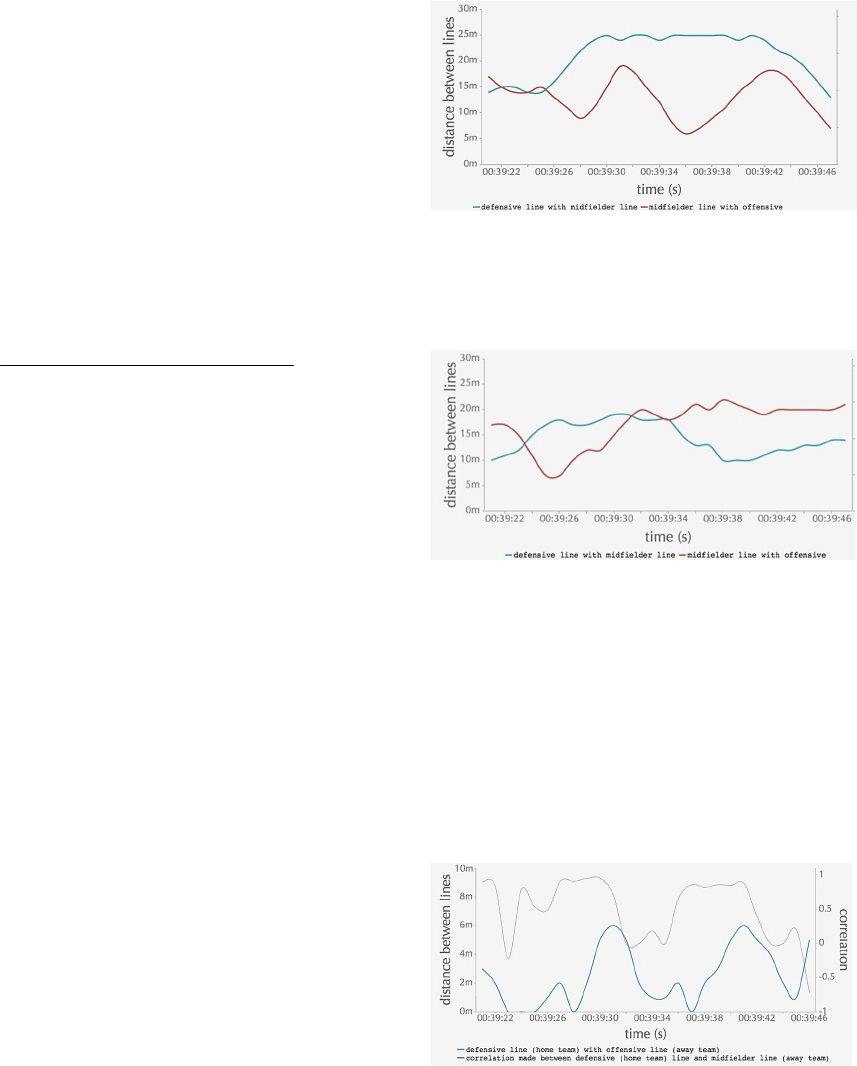
Figure 7 and Figure 8 display the distance between
lines of each team. The lost of ball possession occurs
at time 39:31, and the away team goal was scored at
minute 39:40.
For the home team the distance between the
defensive line and the midfielder line (blue line on
Figure 7) increases being characterized by values
included in 20m to 25m interval until the opposition
team scored its goal. Despite a moderate correlation
between these two team sectors this data captures a
possible less efficient relationship between sectors.
Figure 7: Home chart metrics.
We may suggest that it was this gap size between
midfield and defensive lines on the home team,
affords the away team an
opportunity to score a goal.
Figure 8: Away Chart.
4.2
Inter Team Analysis
As it can be observed in Figure 9, the distances
between the home team defensive line and the away
team offensive line achieved
the shortest values in
the time interval defined by the following moments:
ball possession moment (39:31) and goal scored
m o m e n t (39:40). So, we may suggest that this
distance between lines has a relevant influence on
goal
scoring of the away team.
Figure 9: The evolution of distance and correlation during
the critical moment.
The calculated correlation value reinforces our
previous suggestion regarding the influence of the
distance between lines on goal scoring. It is worth
noting that soon after
regain
ball possession (away
team) a decrease on the correlation a c h i e v e d
PerSoccer 2015 - Special Session/Symposium on Performance Analysis in Soccer: How does Technology Challenge Current Practices? -
3rd Edition
350
values
close to 0 (zero) (between minute 39:32 and
39:36).
This might suggest that for brief moments
the defensive line of the home team and the
offensive line of
the away team were unrelated (i.e.,
not moving in the
same direction or at the same
speed) which provides
the offensive line of the away
team getting closer the
defensive line of the home
team, which seems to be
a suitable position to score
a goal...
5
CONCLUSIONS
In this article, we propose a football analysis plat-
form designed and implemented to support coaches
and match analyzers decision making.
Functionalities such as virtual representation of the
uploaded data using an applet, and
game analysis as
part of extended game analysis were
implemented.
The game analysis functionalities are
associated
with appropriate GUI. Additionally data
management, data storage and data exporting func-
tionalities were implemented and tested. The data
provided by this platform allow an intrateam and an
interteam game analysis of the dynamics of the
different sectors of each team for moments
previously identified as critical, for instance loss of
ball possessions and goals scored.
6
FUTURE WORK
For further analysis it will be possible to add new met-
rics to this platform. The main idea is to develop this
version to a fully customize platform where coaches
and game analysts can choose the metrics which more
accurately describe team and individual performance.
Other important point would be to use data from other
sources, i.e., from other devices. This platform was
built to accept football player’s positional data, up-
load on any part of the world. Now we just need to
test it www.footalysis.eu.
ACKNOWLEDGEMENTS
We would like to thank Stats-SportVU for, kindly,
provided the data used on this study.
REFERENCES
Benesty, J., Chen, J., Huang, Y., and Cohen, I. (2009).
Pearson correlation coefficient. In Noise reduction in
speech processing, pages 1–4. Springer.
Bootstrap (2015). Bootstrap - getting started. http://get
bootstrap.com/getting-started/. Accessed:
2015-04-11.
Duarte, R., Arau´jo, D., Davids, K., Travassos, B., Gazimba,
V., and Sampaio, J. (2012). Interpersonal coordina-
tion
tendencies shape 1-vs-1 sub-phase performance
outcomes in youth soccer. Journal of sports sciences,
30(9):871–877.
Eastlake 3rd, D. and Jones, P. (2001). Us secure hash algo-
rithm 1 (sha1). Technical report.
Farrell, J. (2011). Java Programming. Cengage Learning.
Frencken, W., Poel, H.d., Visscher, C., and Lemmink,
K. (2012). Variability of inter-team distances associated
with match events in elite-standard soccer. Journal of
sports sciences, 30(12):1207–1213.
Inmotio (2015). Inmotio. http://www.inmotio.eu. Ac-
cessed: 2015-06-10.
McGarry, T., Anderson, D. I., Wallace, S. A., Hughes, M.
D., and Franks, I. M. (2002). Sport competition as
a
dynamical self-organizing system. Journal of Sports
Sciences, 20(10):771–781.
SportVU (2015). http://www.sportvu.com/football_coachin
g.asp. Accessed: 2015-06-22.
Technologies, S. (2015). Viper Software - multiple
ways to
monitor athletes. http://statsports.ie/
technology/viper -
software/. Accessed: 2015-06-14.
Vilar, L., Arau´jo, D., Davids, K., and Button, C. (2012).
The
role of ecological dynamics in analysing
performance
in team sports. Sports Medicine, 42(1):1–
10.
JFA Platform for Football Analysis
351
