EasySDM
An Integrated and Easy to Use Spatial Data Mining Platform
Leila Hamdad
1
, Amine Abdaoui
2
, Nabila Belattar
1
and Mohamed Ala Alchikha
1
1
LSCI, ESI, BP 68M Oued Smar, Algiers, Algeria
2
LIRMM, 860 St Priest Street, Montpellier, France
Keywords: Spatial Data Mining, Geo-Visualization, Classification, Clustering, Association Rules.
Abstract: Spatial Data Mining allows users to extract implicit but valuable knowledge from spatial related data. Two
main approaches have been used in the literature. The first one applies simple Data Mining algorithms after a
spatial pre-processing step. While the second one consists of developing specific algorithms that considers
the spatial relations inside the mining process. In this work, we first present a study of existing Spatial Data
Mining tools according to the implemented tasks and specific characteristics. Then, we illustrate a new open
source Spatial Data Mining platform (EasySDM) that integrates both approaches (pre-processing and dynamic
mining). It proposes a set of algorithms belonging to clustering, classification and association rule mining
tasks. Moreover and more importantly, it allows geographic visualization of both the data and the results.
Either via an internal map display or using any external Geographic Information System.
1 INTRODUCTION
Spatially related data is present in many fields such as
epidemiology, environmental science, image
analysis, etc. In fact, many problems are spatially
dependent. The study of any characteristic of such
data can not be done without taking into account their
respective geographical positions. In its most
common form, a spatial data is divided into two parts:
a descriptive part that can be of any standard type
(Integer, Boolean, etc.) and a geographic part
describing the geometry and geo-spatial position of
the data. Voluminous geographic data are being
collected with modern acquisition techniques such as
Global Positioning Systems (GPS), high-resolution
remote sensing, Geographic Information System
(GIS), etc. Extracting unknown and unexpected
information from these spatial data sets requires
efficient methods that take into account the spatial
dependencies (Guo, 2009). Spatial data are
characterized by their interdependence, which comes
from the following assumption: “The more objects
are close to each other, the higher is the correlation
between them” (Miller, 2004). Therefore, Spatial
Data Mining (SDM) has emerged as an active area of
research for extracting implicit and relevant
knowledge from large spatial databases containing
great, complex and interdependent data (Anselin et
al., 2006). In general, SDM tasks are extensions of
Data Mining (DM) ones by taking into account spatial
relations. These tasks include clustering,
classification, association rule mining and geo-
visualization.
In the literature, several software of SDM exist,
which function according to two main approaches.
The first approach, which is the most intuitive one,
consists of using classical DM algorithms on pre-
processed spatial data. The pre-processing consists of
extracting smoothed data table from the matrix
between neighbouring objects, or by representing the
spatial relations as new features (Ouattara, 2010;
Rinzivillo et al, 2008). This approach is simple but
time consuming (Guo, 2008). The second approach
consists of developing specific SDM techniques that
dynamically takes into consideration spatial
relationships inside the mining process. Therefore,
the exploratory process of this approach is faster than
the first one but more complicated to implement.
In this work, we first propose a study on existing
SDM tools focusing on their proposed tasks and
specific characteristics. To our knowledge, no similar
study has been proposed before in order to compare
SDM tools, in contrast to the huge work done to
compare classical DM tools (Goebel and Gruenwald,
1999;. Elder and Abbott, 1998; Witten and Frank,
2005). Then, we present EasySDM, our new
integrated, open source and easy to use SDM
394
Hamdad, L., Abdaoui, A., Belattar, N. and Chikha, M..
EasySDM - An Integrated and Easy to Use Spatial Data Mining Platform.
In Proceedings of the 7th International Joint Conference on Knowledge Discovery, Knowledge Engineering and Knowledge Management (IC3K 2015) - Volume 1: KDIR, pages 394-401
ISBN: 978-989-758-158-8
Copyright
c
2015 by SCITEPRESS – Science and Technology Publications, Lda. All rights reserved

platform. It integrates algorithms from both pre-
processing and dynamic SDM approaches. On the
one hand, algorithms from the Weka DM tool (Hall et
al., 2009) have been used after a pre-processing step
using the GDPM API (Bogorny et al., 2006). On the
other hand, a naïve regionalization algorithm and a
simple spatial rules association extraction algorithm
that can be directly applied on spatial data have been
implemented. While existing SDM tools show a lack
of visualisation especially for open source ones,
EasySDM offers the possibility to visualize spatial
data directly on an integrated geographical map
before and after applying DM algorithms.
Furthermore, a visualization is also possible via any
external Geographic Information System (GIS). Due
to its simplicity and visualization capabilities, we
believe that EasySDM may be helpful, inter alia, in
explaining SDM to students in the academic area. It
has been produced under the GPL licence in order to
allow researchers and programmers to access and
improve the source code. The platform setup, source
code and documentation are publically available on
the internet
1
.
The rest of the paper is organized as follow: First,
a comparative study on existing SDM tools is
presented in section 2. Then, EasySDM and its
components are detailed in section 3. After that, we
conduct some experiments using EasySDM in order
to illustrate its functionalities and present them in
section 4. Finally, section 5 concludes and gives our
main perspectives.
2 COMPARATIVE STUDY OF
SDM TOOLS
Many SDM tools have been proposed in the literature.
(Han et al., 1997) proposed GeoMiner, the first
knowledge extraction software from spatial
databases, developed in 1997. It is an extension of the
classical DM tool DBMiner (Jiawei Han, 1996)
developed by the same team in 1996. Similarly,
(Ouattara, 2010) developed GeoKnime, an extension
of the Knime software (www.knime.org) to spatial
data. (Appice et al., 2007) proposed Ingens, an
integrated platform for SDM within a GIS
environment. (Lazarevic et al., 2000) developed
SDAM, a software system for spatial data analysis
and modelling that includes two tasks of SDM
(clustering and classification). (May and Savinov,
2001) developed the SPIN system, a spatial
1
http://www.lirmm.fr/~abdaoui/EasySDM
information system that implements many clustering,
classification and association rule mining algorithms.
(Bogorny et al., 2006) developed a spatial pre-
processing API that can be added to the Weka
software in order to treat spatial data. Finally, an
interesting application of clustering, named
CrimeStat, has been proposed in (Levine and al,
2004) in order to detect hot spots of crime incidents.
In this section, we compare these tools according
to their general characteristics. Table 1 presents for
each tool: the year of its latest release, whether the
software and the source code are publically accessible
or not, whether a documentation is available or not
and, finally, the type of the proposed visualization (if
any).
Table 1 : General characteristics of existing SDM tools.
Tool name
Year of last
release
Tool public
accessibility
Sources public
accessibility
Documentation
integrated map
display
External map
display
Geo-
Miner
1999 No No No Yes No
Geo-
Knime
2010 No No No No No
Ingens 2007 No No No Yes No
SDAM 2000 No No No No No
SPIN 2003 Yes No Yes Yes No
GDPM 2007 Yes Yes Yes No No
Crime-
Stat
2010 Yes No Yes Yes Yes
Table 2 presents a comparison of these tools
according to their technical characteristics. For each
tool, it presents its architecture, the programming
language, whether it functions with all operating
systems, and the possible types of data input. Finally,
Table 3 presents a functional comparison, which
takes into consideration the used SDM approach, the
types of the considered spatial relations, and the
implemented SDM tasks.
It is important to notice that GeoMiner and Ingens
have been built on specific spatial query languages.
When they were released, these two tools were not
successful. Moreover, GeoKnime and SDAM are not
publically accessible and do not seem to be massively
used. Since we could not test these four tools, their
characteristics have been extracted from the scientific
papers describing them.
EasySDM - An Integrated and Easy to Use Spatial Data Mining Platform
395

Table 2: Technical characteristics of SDM tools (Un:
Unknown, Win: Windows).
Tool name
System
architecture
Programmin
g language
Operating
system
Data input
types
GeoMiner Client/
Server
Un All Database
GeoKnime Desktop Java All Database
Ingens Client/
Server
Java All Database
SDAM Desktop C++ Win Database
SPIN N-tier Java All Database
GDPM Desktop Java All Database
CrimeStat Desktop C++ All Files: dbf,
shp and dat
Table 3: SDM characteristics of SDM tools (Pre-pro: Pre-
processing, D: Distance, T: Topological, R: Directional,
Un: Unknown).
Tool name
SDM
approach
Spatial
relations
SDM tasks
Classification
Clustering
Association
GeoMiner Dynamic D Yes Yes Yes
GeoKnime Dynamic D and T Yes Yes No
Ingens Dynamic D, T and R No No Yes
SDAM Pre-pro Un Yes Yes Yes
SPIN Dynamic D and T Yes Yes Yes
GDPM Pre-pro D and T Yes Yes Yes
CrimeStat Pre-pro D and T No No Yes
3 SYSTEM OVERVIEW
3.1 Architecture
As presented in the previous section, Weka- GDPM
is accessible, open source and includes the main three
SDM tasks using the pre-processing approach.
However, it does not provide any geographical
visualization of the results. Therefore, we decided to
use and enrich Weka-GDPM with a geographic
visualization. Figure 1 below presents the platform
architecture. The visualization of the spatial data and
the results can be performed within the platform or
using any external GIS. The internal map display has
been implemented using the MapWinGIS API. The
external visualization can be done by any GIS to open
the data and the results. In addition to the Weka
algorithms that can be applied on pre-processed data,
we implemented a naïve regionalization and a simple
spatial rule association mining algorithms (spatial
Apriori) that can be applied directly on spatial data
without any pre-processing. The development was
carried out on a Microsoft Visual Studio 2012
platform using the C# programming language. The jar
files of Weka and GDPM have been converted to dll
files accessible from the C# code using the IKVM
tool (www.ikvm.net). The data sources can be either
arff files (.arff), shape files (.shp) or a PostGis 2.0
database. The obtained results can be saved in .arff or
.shp formats.
3.2 Graphical User Interface
The Graphical User Interface (GUI) is simple and
intuitive, hence the name of EasySDM. As presented
in Figure 2, the GUI is divided into three areas:
Region A: Allows the user to interact with the
platform by specifying the shape file and the
.arff file, setting up the parameters, modifying
the theme of or the attribute to be displayed on
the map, lunching the algorithm, and saving the
results.
Region B: Displays information about the run
such as: the algorithm status, the success/fail of
the algorithm, the execution time and error
messages, etc.
Region C: This area is dedicated to the map
display and the legend. It allows to visualize on
the map both the data and the results. For
example the same colour is used for objects that
are in the same cluster.
3.3 Geographic Pre-Processing
The geographic pre-processing is performed using the
GDPM API. This step consists of extracting spatial
relations and including them as new features to the
data. These features represent the spatial objects as
we used the instance granularity level. Each new
feature will take as value, the existing spatial relation
between the object represented by the new feature
(columns) and the object represented by the
corresponding instance (lines). If no spatial relation is
found between the two objects, the corresponding cell
takes the value ‘no’. Two types of spatial pre-
processing are available according to the types of the
extracted spatial relationships:
KDIR 2015 - 7th International Conference on Knowledge Discovery and Information Retrieval
396
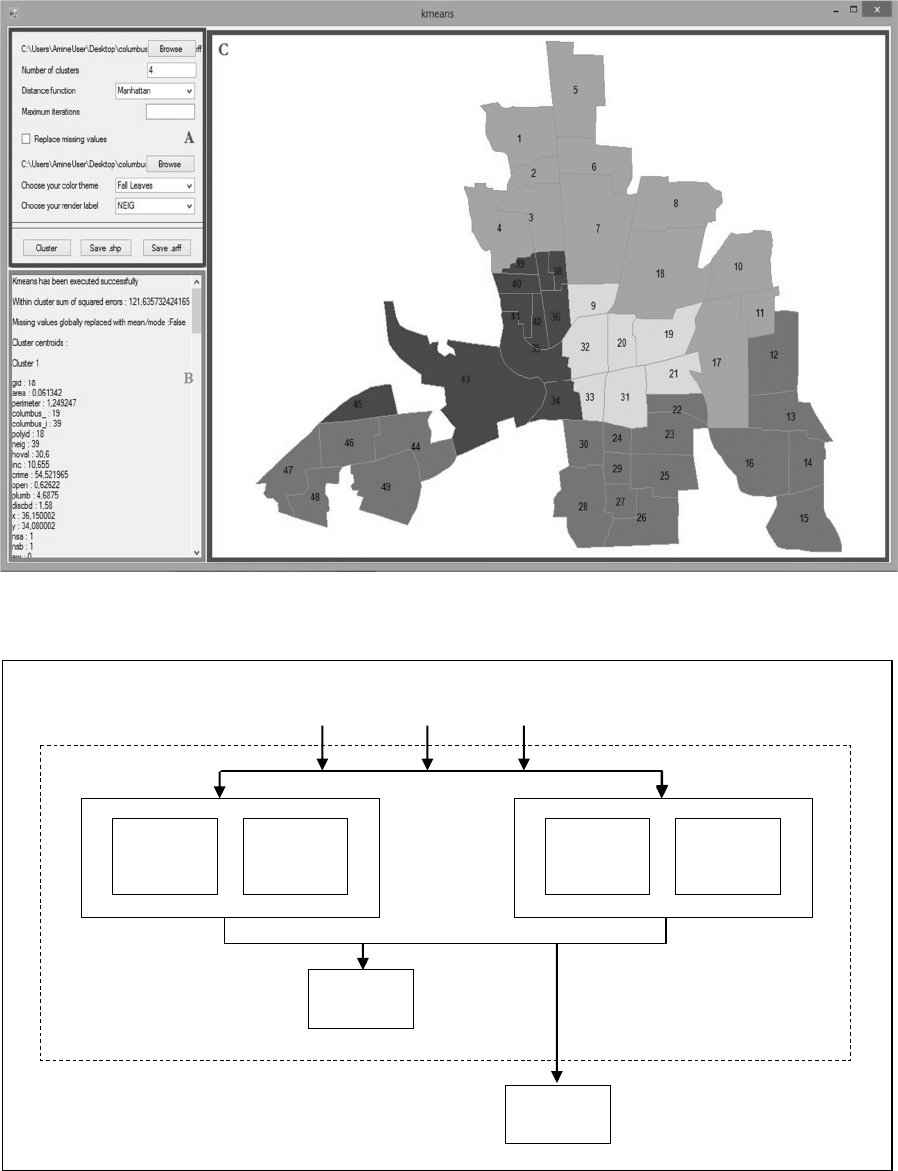
Figure 1: EasySDM Graphical User Interface and its three areas. Here, the K-means clustering algorithm has been applied
(k=4).
Figure 2: EasySDM architecture.
.
arff
.shp
PostGis
Spatial
Apriori
Regional-
ization
GDPM
Weka
MapWin
Gis
External
GIS
EasySDM - An Integrated and Easy to Use Spatial Data Mining Platform
397
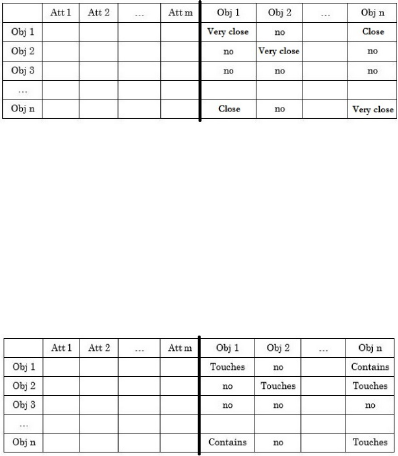
3.3.1 Distance Relationships
Three types of distance spatial relations have been
considered: close, very close and far. The spatial
relationship is chosen according to thresholds. Figure
3 presents the structure of the obtained arff file.
Figure 3: Structure of the arff file after the extraction of
distance relationships.
3.3.2 Topological Relationships
Eight types of topological spatial relationships have
been considered: equal, disjoint, touches, within,
overlaps, crosses, contains and covers. Figure 4
presents the structure of the obtained arff file.
Figure 4: Structure of the arff file after the extraction of
topological relationships.
Once the geographical pre-processing step has
been applied, the data can be used with classical DM
algorithms. In this first version, the following
representative algorithms have been integrated using
the Weka software:
Clustering by partitioning: K-means, Farthest
First and Expectation Maximization.
Density based clustering: Cobweb and DBscan.
Classification: J48 and Naïve Bayes.
3.4 Dynamic SDM Algorithms
Two naive SDM algorithms that can be applied
directly on the spatial data have been implemented.
The goal here is to illustrate the dynamic processing
approach by simple examples.
3.4.1 Regionalization
While classical clustering methods do not guarantee
that objects in the same cluster are contiguous,
regionalization groups similar objects in contiguous
regions. Our implemented regionalization algorithm
is divided into two steps. First, a classical clustering
algorithm is applied (here we applied the FarthestFirst
algorithm). Then, the obtained clusters are organized
into contiguous regions. If non-contiguous objects
exist in each cluster, they are separated in order to
form a new cluster. This process is repeated until all
regions become contiguous.
The algorithm is presented below:
Input: Dataset: D
Minimal number of regions: k.
Output: The assignments of elements to
different regions.
Begin
1. Apply Farthest First (D, k)
2. For each cluster c not yet checked,
we create a region r containing the
first object of c
2.1. For all other objects o from
c:If (o touches at least one
object of r): r = r union {o}
2.2. All remaining objects (if any)
are affected to a new cluster.
End
3.4.2 Spatial Apriori
Spatial association rule mining extracts rules in the
form: X->Y, where X and Y are spatial predicates
(intersection, contains, overlaps, disjointed, crosses,
covers, covered and touches). We implemented a
spatial variation of the Apriori algorithm that we call
Spatial Apriori. It outputs the rule that has the highest
confidence and the geographical objects that
participate in this rule. Hence, Spatial Apriori can
extract the best association rule found in a shape file
with considered minimum support and minimum
confidence. The different steps of Spatial Apriori
algorithm are detailed below:
Input:Dataset: D
Minimal support: MinSup
Minimal confidence: MinConf.
Output: Best rule found
Confidence
Support.
Begin
1. Predicates <- Apply all the
families of spatial relations on
all the elements of D.
2. Predicates <- Select only those
for which the support is greater
than MinSup.
3. Predicates <- Select the best
predicate for each family.
4. Rules <- Combine the predicates
and generate all possible
association rules.
KDIR 2015 - 7th International Conference on Knowledge Discovery and Information Retrieval
398
5. Rules <- Select rules with
confidence greater than MinConf.
6. Return the association rule with
maximal confidence.
End
3.5 Licence
EasySDM is distributed under the GPL licence in
order to guarantee free access to the platform, the
source code and to any software build on it. Weka,
GDPM and IKVM are already under the GPL licence.
However, MapWinGis has been distributed under the
MPL 1.1 licence, which is incompatible with GPL.
Therefore, we contacted MapWinGis owners and
they gave us authorization to use their API along with
GPL licences we are using.
4 EXPERIMENTS
In order to test the functionalities of our new SDM
platform, we conducted experiments using publically
available spatial data on the GeoDa website
(www.geodacenter.asu.edu/sdata). The main goal
here is to illustrate the visualisation capabilities of
EasySDM on a real benchmark.
4.1 Description of the Benchmark
It contains Malaria incidence and population in
Colombia. We selected information corresponding to
the year 1998. The obtained benchmark contained 33
spatial objects (polygons) representing the 33
Colombia departments. These 33 departments were
described only with 5 features: department name,
department code, number of malaria incidences
(MALARI98), total population (TP1998), rural
population (RP1998) and urban population (UP
1998). Geographical pre-processing added 33 new
features to the data. Due to the nature of this
benchmark (polygons) topological relations have
been considered.
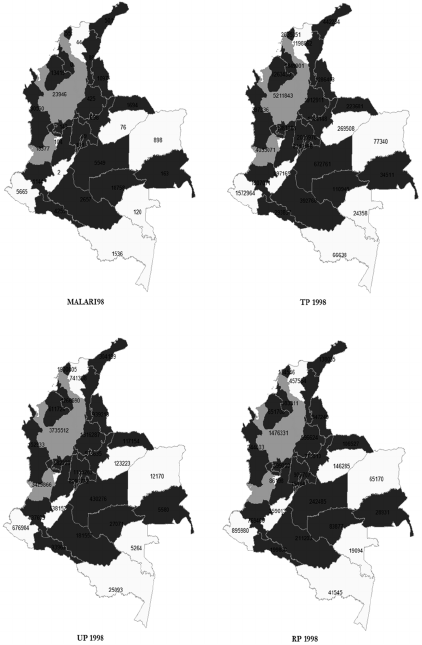
4.1.1 Clustering
We first conduct a clustering experiment using K-
means (k=3) on the geographically pre-processed
data. In this experiment, the department “San Andres”
has been removed in order to be used later in the
classification. As shown in Figure 5, three clusters
have been created:
The Black Cluster contains many departments
especially from the center. Therefore, they
contains many common borders. The number of
Malaria incidences may be very high.
The Gray Cluster contains departments from
the North West of the country. The number of
Malaria incidences is high as well as the
population, which is more urban than rural.
The White Cluster groups departments which
has less common borders, less population and
less Malaria cases. The population is more rural
than urban.
4.1.2 Classification
We used the 32 already classified departments to
build a Naive Bayes classifier which was used to
classify the left “San Andres” department (composed
of two islands). As shown in Figure 6, “San Andres”
has been affected to the white cluster since it has no
Malaria incidence (0), a small population (69525) and
no common border with any other department.
Figure 5: Clustering using K-means (k=3) on the first
benchmark. The number of Malaria incidence
(MALARI98) and the rural (RP 1998), urban (UP 1998)
and total population (TP 1998) are presented for each
department.
EasySDM - An Integrated and Easy to Use Spatial Data Mining Platform
399
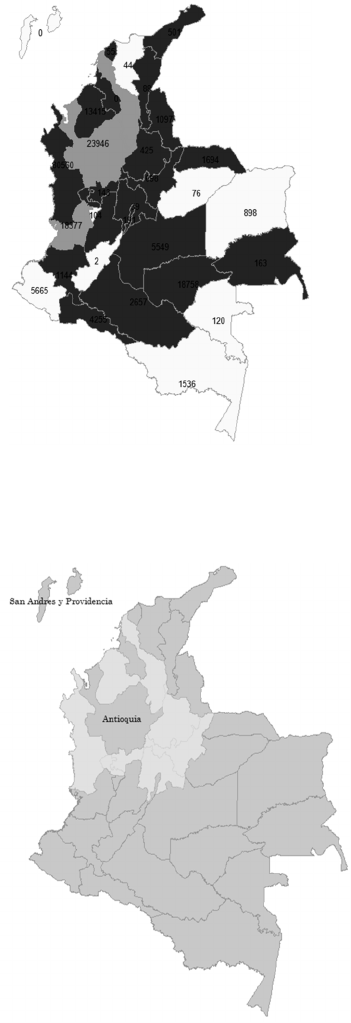
4.1.3 Association Rules
Finally, we apply the naive variation of Apriori to this
benchmark. The extracted rule is the following
(support and confidence have been set to 0):
Intersects(Antioquia) => Disjoint(San Andres)
Figure 6: Classification of the “San Andres” department
(the two islands) using a Naïve Bayes classifier. The
number of Malaria incidences is indicated for each
department.
Figure 7: The departments verifying the obtained rule by
Spatial Apriori.
This rule has a value of 0.24 in terms of support
and 1 in terms of confidence. The departments
verifying this rule are presented in light colore in
Figure 7. The obtained rule is obvious and may not be
valuable for the user. Since the purpose of the
platform is to explain SDM to novice users we did not
remove obvious rules. This can be included in future
versions.
5 CONCLUSION
In this work, we propose an open source and easy to
use SDM platform named EasySDM. It integrates
classical DM methods implemented in the Weka
platform after a Geographical pre-processing step.
Moreover, it contains two naïve algorithms that
consider the spatial relations inside the mining
process without any pre-processing. The main
contribution concerns the integration of an internal
geographic visualization of the spatial data before and
after applying the algorithms. EasySDM can also be
interfaced with any GIS to offer external visualization
and to take advantage of GIS functionalities.
Therefore, we believe that it can be used in the
academic area. The main expected improvements of
EasySDM consist of enriching it with existing
algorithms from the literature.
REFERENCES
Anselin, L., Syabri, I., Kho, Y., 2006. GeoDa: An
Introduction to Spatial Data Analysis.
Geographical
Analysis
38, 5–22.
Appice, A., Lanza, A., Malerba, D., 2007. An Integrated
Platform for Spatial Data Mining Within a GIS
Environment, in:
ICDE Workshop on Spatio-Temporal
Data Mining,
pages 507–516.
IEEE Computer Society.
Bogorny, V., Palma, A.T., Engel, P., Alvares, L.O., 2006.
Weka-gdpm: Integrating classical data mining toolkit to
geographic information systems, in:
SBBD Workshop
on Data Mining Algorithms and Aplications,
Florianopolis,
Brasil
, pp. 16–20.
Goebel, M., Gruenwald, L., 1999. A Survey of Data Mining
and Knowledge Discovery Software Tools.
SIGKDD
Explor. Newsl.
1, 20–33.
Guo, D., 2008. Regionalization with Dynamically
Constrained Agglomerative Clustering and Partitioning
(REDCAP).
Int. J. Geogr. Inf. Sc
i. 22, 801–823.
Guo, D.,Mennis. J. 2009.Spatial data mining and
geographic knowledge discovery—An introduction.
Computers, Environment and Urban Systems
. 33. 403–
408.
Hall, M., Frank, E., Holmes, G., Pfahringer, B., Reutemann,
P., Witten, I.H., 2009. The WEKA Data Mining
KDIR 2015 - 7th International Conference on Knowledge Discovery and Information Retrieval
400
Software: An Update. SIGKDD Explor. Newsl. 11, 10–
18.
Han, J., Koperski, K., Stefanovic, N., 1997. GeoMiner: A
System Prototype for Spatial Data Mining, in:
Proceedings of the 1997 ACM SIGMOD International
Conference on Management of Data, ACM, New York,
NY, USA, pp. 553–556.
Jiawei Han, Y.F., 1996. DBMiner: A System for Mining
Knowledge in Large Relational Databases. KDD-96
Proceedings, 250–255.
Elder .J. F., Abbott. D.W, 1998. A Comparison of Leading
Data Mining Tools. Presented at the Fourth
International Conference on Knowledge Discovery and
Data Mining, New York.
Lazarevic, A., Fiez, T., Obradovic, Z., 2000. A software
system for spatial data analysis and modeling, in:
Proceedings of the 33rd Annual Hawaii International
Conference on System Sciences.
Levine, N., others, 2004. CrimeStat III: a spatial statistics
program for the analysis of crime incident locations
(version 3.0). Houston (TX): Ned Levine &
Associates/Washington, DC: National Institute of
Justice.
May, M., Savinov, R., 2001. An Architecture for the SPIN!
Spatial Data Mining Platform, in: Proc. New
Techniques and Technologies for Statistics. pp. 467–
472.
Miller, H.J., 2004. Tobler’s First Law and Spatial Analysis.
Annals of the Association of American Geographers 94,
284–289.
Ouattara, M., 2010. Fouille de données: vers une nouvelle
approche intégrant de façon cohérente et transparente la
composante spatiale. Université Laval.
Rinzivillo.S, Turini. F,Bogorny. V, Körner. C, Kuijpers. B,
andMay, M. 2008. Knowledge discovery from
geographical data. Mobility, Data Mining and Privacy,
pp. 243–265,
Witten, I.H., Frank, E., 2005. Data Mining: Practical
Machine Learning Tools and Techniques, Second
Edition. ed. Morgan Kaufmann Publishers Inc., San
Francisco, CA, USA.
EasySDM - An Integrated and Easy to Use Spatial Data Mining Platform
401
