Prediction of Earnings per Share for Industry
Swati Jadhav, Hongmei He and Karl Jenkins
School of Aerospace, Transport and Manufacturing, Cranfield University, Cranfield, U.K.
Keywords: EPS Prediction, Data Mining, Regression, RBF Network, Multilayer Perceptron (MLP).
Abstract: Prediction of Earnings Per Share (EPS) is the fundamental problem in finance industry. Various Data Mining
technologies have been widely used in computational finance. This research work aims to predict the future
EPS with previous values through the use of data mining technologies, thus to provide decision makers a
reference or evidence for their economic strategies and business activity. We created three models LR, RBF
and MLP for the regression problem. Our experiments with these models were carried out on the real datasets
provided by a software company. The performance assessment was based on Correlation Coefficient and Root
Mean Squared Error. These algorithms were validated with the data of six different companies. Some
differences between the models have been observed. In most cases, Linear Regression and Multilayer
Perceptron are effectively capable of predicting the future EPS. But for the high nonlinear data, MLP gives
better performance.
1 INTRODUCTION
Even though financial market analysis requires
knowledge, intuition and experience, the automation
process has been growing steadily because of the
availability of large Finance data. There is a growing
evidence to research in the fields of data mining and
machine learning and their applications to
Computational finance industry.
In a mature finance industry, a company that takes
the dominant position in the industry earns greater
profits because of better ways of handling its
economic scale and market power (San Ong et al.,
2010).
Evaluation of stocks of a company to buy or sell
is an important decision to be made by the investors
of a company. Nowadays, when huge amounts of data
are made available with the advent of technology, this
decision does not become any easier without the help
of some model. Thus determining the best model
directly affects the investment decisions for a
company.
EPS is considered as one of the most important of
the profitability metrics of a company. It represents
the returns delivered by the company for each
outstanding share of common stock. It is a major
indicator for investors to purchase stocks. Price
Earnings (PE) ratio is obtained by dividing the stock
price by EPS. The EPS used here can be current or
future earnings. EPS over past quarters as well as
“forward” forecasted quarters is most frequently used
in the calculation of PE ratio of a company.
Comparison of a stock’s current PE with those of its
competitors or with its own average multiple over
three to ten years gives useful information about
hopeful future profits, investment in the company and
also if a possible bargain has happened. Investment
into a stock depends on the current PE ratio: Is it too
high or low compared with the PE ratio of the stock’s
peers, industry or aggregate market?
This paper proposes three regression models to
predict EPS: (1) Statistical Regression Model using
Linear Regression (LR) (2) Neural network (NN)
regression using Multilayer Perceptron (MLP) and
(3) Neural network regression using Radial Basis
Function (RBF). For construction of these models,
56-quarter EPS data are employed. The experimental
results indicate that LR and MLP models outperform
the RBF models, except for the high nonlinear data,
where MLP gives better performance.
If one has huge and complex dataset, data mining
can be carried out on it keeping in mind a particular
problem and goal of discovering insights and predict
future accurately. Formally, Data Mining or
Knowledge Discovery in Databases (KDD), is the
process of intelligent analysis of large amounts of
data, also called as big data to explore consistent
patterns and relationships among variables. This can
Jadhav, S., He, H. and Jenkins, K..
Prediction of Earnings per Share for Industry.
In Proceedings of the 7th International Joint Conference on Knowledge Discovery, Knowledge Engineering and Knowledge Management (IC3K 2015) - Volume 1: KDIR, pages 425-432
ISBN: 978-989-758-158-8
Copyright
c
2015 by SCITEPRESS – Science and Technology Publications, Lda. All rights reserved
425
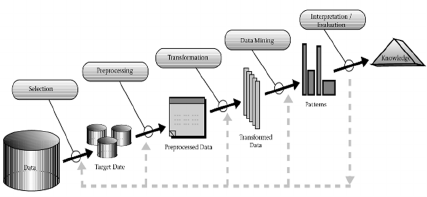
be seen in Figure 1. The patterns found are in the form
of models and are validated by subjecting them to
new datasets. This process is called as deployment of
the models. Data mining involves building models to
detect patterns which then are used to predict
situations. It is the amalgamation of different fields
like Statistics, Information systems, Applied Machine
learning, Data engineering, Database Systems,
Artificial intelligence and Genetic Algorithms.
Knowledge discovery process is being applied by
various industries for fraud detection, bankruptcy
prediction, marketing campaigns, forecasting high-
risk clients and improving production processes, to
name a few. Application of data mining in the area of
finance is becoming more amenable since large
financial datasets are becoming available.
Data mining takes inspiration from Machine
learning which involves building and applying the
models or algorithms to predict the future without any
real explanation of any reasoning of the real causes of
relationships. Machine learning takes from statistics
but stresses more on accuracy of prediction. Various
unsupervised or supervised machine learning
techniques can be applied in the process of data
mining.
Predictive data mining identifies very complex
and generic model(s) which are then used to predict
the response of new data sets. Prediction is a form of
data analysis used to extract models to predict future
data trends and get better understanding of the data.
Prediction learns a mapping or function, y = f (X),
where X is the input and y is the continuous output to
model the relationship between X and y.
Figure 1: Data Mining as a step in the process of Knowledge
Discovery (Fayyad et al., 1996).
The paper is organized as follows. Next section
reviews the literature on usage of EPS for stock price
forecasting. Then, the methodology of the research
along with the applied methods is introduced. Next
section describes the dataset and experimental set up
of the work. The experimental results of forecasting
performance across the LR and NNs are compared in
next section followed by conclusions of the work.
2 RELATED WORK
Prediction of Earnings per share forms the basis for
stock price forecasting. Forecasting is s function
approximation problem involving choosing a model
and fitting its parameters to the data. This problem is
complex because of stock price changes in time being
highly nonlinear. Many artificial intelligence, soft
computing and machine learning methods have been
used wherein neural networks and regression show
good results since they are robust against noise, can
model nonlinear relationships and give good
generalization performance.
Data mining and regression have long been
researched upon to solve various problems. There are
three types of Regression models such as Linear,
Polynomial and Logistic Regression.
Regression modelling has many applications
wherein the output is continuous such as in trend
analysis, business planning, marketing, financial
forecasting, time series prediction, biomedical and
drug response modelling, and environmental
modelling (Sajja and Akerkar, 2012).
Artificial neural networks (ANNs) are one of the
most common supervised data mining techniques
used by the industry for forecasting.
MLPs have been employed for prediction of stock
prices and indexes on various stock markets, see:
(Mostafa, 2010; Ince and Trafalis, 2008; Guresen et
al., 2011). Similarly RBF neural networks were the
topic of choice for same purpose in: (Shen et al.,
2011; Chen et al., 2009; Yan et al., 2005). Use of
RBFs along with various other data mining
techniques can be found in (Guo et al., 2015;
Sermpinis et al., 2013; Kara et al., 2011).
Other research regarding forecasting and
prediction in the area of finance focuses on stock
market, bankruptcy, fraud, credit scoring and
business failures. Bankruptcy prediction attempts to
predict bankruptcy and financial distress of public
firms. It is one of the vast areas of finance research.
Creditors and investors have always given
importance to the evaluation of credit worthiness of
firms.
A lot of them consider ANNs as the main
technique of forecasting (Geng et al., 2015; Wong
and Versace, 2012; Ravisankar et al., 2011; Pacelli et
al., 2011; Du Jardin and Séverin, 2011; Ravisankar
and Ravi, 2010; Hsieh and Hung, 2010; Esichaikul
and Srithongnopawong, 2010; Wang et al., 2011; De
Oliveira et al., 2011; Vaisla and Bhatt, 2010).The
learning and predicting potential of the adaptive
neuro-fuzzy inference system (ANFIS) model, a
variant of ANN is used for stock market returns
KDIR 2015 - 7th International Conference on Knowledge Discovery and Information Retrieval
426
prediction in (Bagheri et al., 2014; Chen, 2013;
Boyacioglu and Avci, 2010).
Classic economic model of regression is used to
predict stock trends in (Olaniyi et al., 2011). To
obtain n-day ahead volatility forecasts, the implied
volatility may be parameterized within an ARCH
model (Blair et al., 2010). Similarly Regression along
with neural network was applied in (Saigal and
Mehrotra, 2012) and along with support vector
machines was investigated in (Kazem et al., 2013).
Other research work using Regression can be found
in (Serrano-Cinca and GutiéRrez-Nieto, 2013; Pan,
2012; Öğüt et al., 2012).
The observation is that models based on neural
networks are suitable for stock market related
forecasting. They are efficient at producing better
results for trading systems with higher forecasting
accuracy. The literature demonstrates that soft
computing techniques have natural connection with
classical statistics methods and have been used
alongside conventional models. However, difficulties
arise when defining the structure of the model (the
hidden layers, number of neurons etc.). While
determining the structure of the model trial and error
procedures are still employed.
A company’s stock price is mainly affected by
Earnings Per Share (EPS) since the stocks vary
according to EPS ratio. Researchers have investigated
several methods to construct models taking help of
EPS: (Patell, 1976) suggested that firms disclose
more frequently when experiencing favourable
earnings results and that earnings forecasts are,
usually associated with positive returns. Financial
distress prediction was the topic of study in (Chen and
Du, 2009) wherein EPS was used as one of the inputs
to neural networks.
A study involving financial ratios included EPS
among others and showed that application of
ensemble methods with diverse models have good
predictive capacity and have good applications in the
area of forecasting. PE ratio has been used in many
research works: DJIA stock selection assisted by
neural network (Quah, 2008). Few researchers have
taken into consideration the EPS ratio as part of
dataset. (Khirbat et al., 2013; Lai et al., 2009) used it
for stock price forecasting and (Pan et al., 2011) used
it for financial crisis prediction.
In (Han and Chen, 2007), a method of SVM was
proposed with financial statement analysis for
prediction of stocks using EPS as one of the finance
parameters. EPS was used as a financial variable for
financial crisis prediction in (Song et al., 2010). SVM
and ANN models including PE ratio as one of the
basic financial indicator give meaningful
performance results for the stock selection (Timor et
al., 2012). Many stock prediction, stock selection,
financial crisis prediction and fraud detection studies
have used EPS as part of the study: (Qiu, 2007; Jiang
et al., 2009; Quah and Ng, 2007; Li and Wong, 2014;
Arefin and Rahman, 2011; Rezaie et al., 2013).
Actual EPS forecasting was the topic of research
in few studies. In an interesting study of Markov
process model to forecast subsequent quarterly EPS
values, the authors applied time independent
transition probability matrices to predict EPS of IT
companies (Rajakumar and Shanthi 2014).
It is seen that EPS forecasting using machine
learning techniques is still a new area. Neural
networks seem obvious choice to model nonlinear
data, but need the decision about parameters,
architecture and speed.
When a real problem needs to be solved, the goal
is to find an approach as easy as possible with the
performance as good as possible. Therefore, we select
three models of LR, MLP and RBF for the EPS
problem, and compare the suitability for the real data.
3 ALGORITHMS USED FOR THE
PREDICTIVE PROBLEM
In order to find the best model for the predictive
problem, we select Linear Regression (LR),
Multilayer Perceptron (MLP) and Radial Basis
Function (RBF) for the predictive problem.
3.1 Linear Regression
Regression is used to predict values in Data Mining.
The process starts with a dataset where the target
values are known and other attributes might be the
predictors in predicting value of the target. While
building the regression model, the algorithm which is
a relationship between predictors and target estimates
the target as a function of the predictors for each
observation in the dataset. This model then can be
applied to a dataset not seen by the model previously
to determine target values.
Least squares regression, a standard approach to
regression, finds a best-fitting line that minimizes the
mean squared difference between the observed values
and the fitted values.
The simplest regression model is the linear
regression model, which represents the linear
relations between independent (also called as x-
variables or predictors) and dependent variables (y-
Prediction of Earnings per Share for Industry
427

variables, response variables or goal variables), as
shown in formula (1).
f(X)= a0+a1x1+a2x2+a3x3+… (1)
3.2 MLP Architecture-Feedforward
Neural Networks
Artificial Neural Networks (ANN) are universal
approximators, and they are very popular with
regression applications where they obtain a close
relation to a continuous objective function. As they
are data-driven, if a good training dataset is available,
they provide good forecasting results.
It is comprised of a set of neural perceptrons. A
Perceptron is a simplest neural network. It is a linear
classifier, using sigmoid function as the activation
function. A perceptron can be described with the
following function:
=
(2)
)(
1
1
)(
θα
−−
+
==
u
e
ufv
(3)
where N is the total number of nodes in input layer,
W
i
is the weight vector connecting the neuron of the
output layer for the pattern p.
Multilayer Perceptron (MLP) extends the concept
of perceptron by adding one or more hidden layers of
neurons. Neural network is usually used to extract
patterns from complex data, as adaptive learning
makes it easy to model complex data, and they do not
assume about underlying probability density
functions or any information regarding the modelling
sample under consideration. Therefore, we
investigate the multiple layer perceptron regression
for the real predictive problem, and use classic
backpropagation algorithm to train the neural
network.
3.3 RBF Network Architecture
RBF network is one of the most popular neural
networks and is a main competitor for MLP networks.
RBFs are faster to train than MLPs of a similar size,
as RBF is a feed forward neural network with a single
hidden layer. But the number of hidden layer neurons
required for RBF neural networks grows
exponentially with the number of inputs. A unique
feature of this network is the process that is performed
in the hidden layer. Input layer sends the input value
to each of the nodes in the hidden layer. Each node in
the hidden layer (neurons) are characterized by a
transfer function: G. Usually the transfer function
uses radial basis functions (e.g. Gaussian functions in
formula (4)) as activation functions. The output of the
network is a linear combination of radial basis
functions of the inputs and neuron parameters (See
formula (5)).
=−
(4)
GW = b (5)
where W is the weight vector, linking the hidden layer
to the output layer and b is the output.
To avoid overtraining of the network, 10-fold
cross validation method is used. This method splits
the data into 10 parts of equal size. In each of the 10
iterations, one part is used as testing set and
remaining as training sets. At the end of 10 runs,
overall performance is the average of all runs’ results.
4 EXPERIMENTS
4.1 Data for the Experiments
The nature of the data used in this work is Estimates
made by the market on Earnings per Share for a
company. The data is captured multiple times in a
quarter for 14 years. First, the records for EPS values
were extracted separately for each company, and data
for six companies were used in the experiments.
The problem domain is divided into two
problems: Problem 1 and Problem 2. The EPS
numeric data for six companies is chosen, which is
organized in matrix as follows:
Problem 1: The EPS data is columnised such that
previous four values are used to predict the fifth
value.
In Table 1, x1-x4 are inputs of the model and y is the
fifth value as the target.
Table 1: Format of the Data sample for Problem 1.
x
1
x
2
x
3
x
4
y
1 2 3 4 5
2 3 4 5 6
3 4 5 6 7
4 5 6 7 8
5 6 7 8 9
Table 2: Format of the Data sample for Problem 2.
x
1
x
2
x
3
x
4
y
1 2 3 4 6
2 3 4 5 7
3 4 5 6 8
4 5 6 7 9
5 6 7 8 10
KDIR 2015 - 7th International Conference on Knowledge Discovery and Information Retrieval
428
Problem 2: The EPS data is columnised such that
previous four values are used to predict the sixth
value.
In Table 2, x1-x4 are the inputs of the model and y is
the sixth value as the target.
4.2 Experiment Set up
(1) The purpose of the work is to find the best model
for the EPS prediction problem. Therefore, we
perform the experiments for the data from six
companies, and compare the performance of the
three models LR, MLP and RBF.
(2) The parameter selection process for each
algorithm was carried out with the help of industry
experts.
(3) All the experiments are run for the datasets using
10-fold cross validation.
(4) Experiment platform: We use WEKA as the
experimental platform.
4.3 Performance Evaluation
In this study, Correlation Coefficient (r) and the root
mean square error (RMSE) are used for the evaluation
of performance of the models.
A correlation coefficient equal to zero indicates
that there is no relationship between the variables; i.e.
if one variable changes, the other may or may not
change. A correlation of +1.00 or -1.00 indicates that
the variables involved are perfectly associated
positively or negatively. A higher correlation
coefficient indicates better fitting to the data. It can be
calculated with formula (6).
=
∑
−
−
∑
−
−
(6)
RMSE gives the measure of the difference
between values predicted by the model and the real
values. The lower RMSE indicates the higher
accuracy. It can be calculated with formula (7).
=
∑
−
(7)
Where
n is the sample size
is the real observed value
is the predicted value
is the average of real observed value
is the average of predicted value from
the model
5 RESULTS AND EVALUATION
The performance of all the models built by the three
algorithms for Correlation Coefficient r and RMSE in
WEKA is shown in figures below.
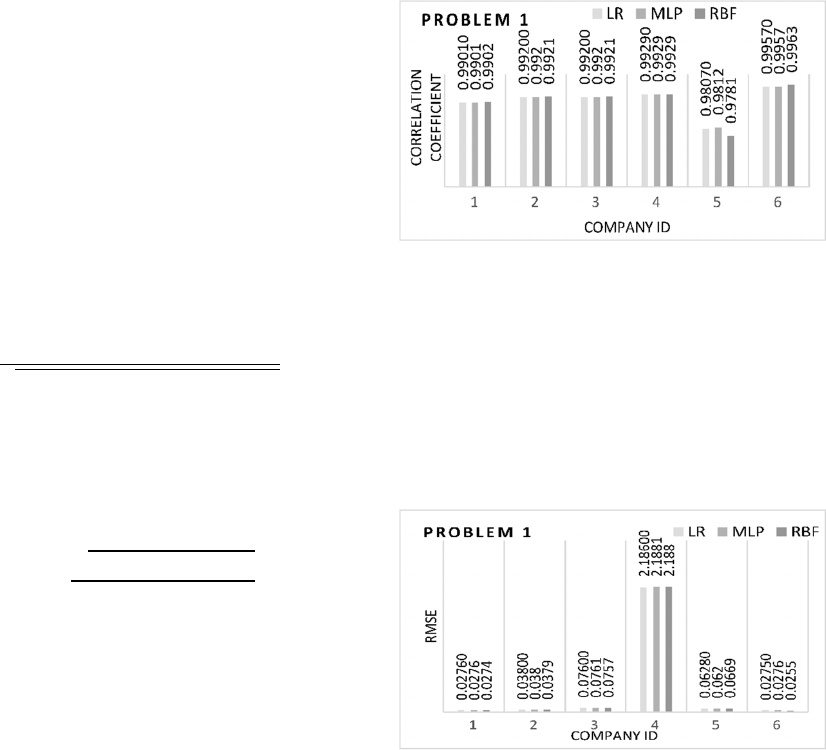
5.1 Problem 1
In Problem 1, we predict fifth value using previous
four values. Figure 2 illustrates the Correlation
coefficient obtained with the three models for
Problem 1. From Figure 2 we can see that the three
models obtained similar performance for all the
companies except for Company 5, for which MLP is
slightly better than LR and RBF. Also the
Correlation
Coefficient for Company 5 is lowest among all the six
companies. It means the data for Company 5 is
weakly linear. So MLP obtained better performance
for Problem 1.
Figure 2: Correlation Coefficient obtained with the three
models for Problem 1.
Figure 3 illustrates the RMSE obtained with the three
models for Problem 1. Obviously it can be seen that
RMSE for Company 4 is highest among all the
companies. Although for all companies the three
models obtained similar RMSE, for Company 5, MLP
obtained the lowest RMSE compared with other two
models for Problem 1. This is consistent with the
Correlation
Coefficient for Company 5 in Figure 2.
Figure 3: RMSE obtained with the three models for
Problem 1.
Prediction of Earnings per Share for Industry
429
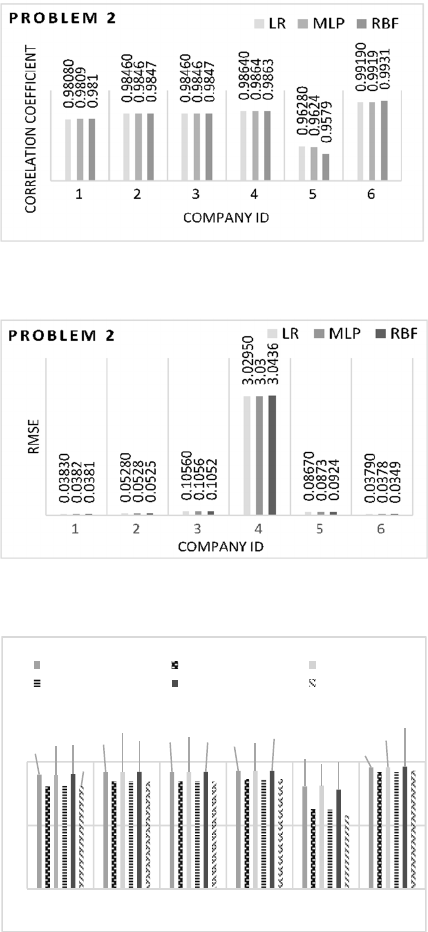
5.2 Problem 2
Figure 4 illustrates the Coefficient of Correlation of
six companies for Problem 2. From Figure 4, the
performance in Correlation Coefficient for all the six
companies for Problem 2 is similar to the
performance for Problem 1. But all values for
Problem 2 are lower than that of Problem 1. Company
5 still got the lowest Correlation Coefficient among
all the companies. LR and MLP obtained better
performance than RBF.
Figure 4: Correlation Coefficient obtained with the three
models for Problem 2.
Figure 5: RMSE obtained with the three models for
Problem 2.
Figure 6: Correlation Coefficient for all the three models for
six companies in both the problems.
From Figure 5, we can see that the RMSE of six
companies for Problem 2 are similar to that for
Problem 1. But the RMSE values of all companies for
Problem 2 are larger than for Problem 1. For each
company, the order of three models’ performance in
RMSE in Figure 5 is the same as the order of three
models’ performance in Correlation Coefficient in
Figure 4 for Problem 2. The Coefficient of
Correlation is consistent to the RMSE assessment.
In summary, Figure 6 illustrates all the
Correlation Coefficients of six companies for
Problems 1 and 2. It can be seen that the performance
of the three models for Problem 1 is better than that
for Problem 2. For company 5, which has high non-
linearity, the MLP obtained the best performance.
6 CONCLUSIONS
In this paper, we employ three models (LR, MLP and
RBF) to predict the change in the EPS of market firms
with historical data. The experiments were carried out
by running the three models on the data of six
companies. We use the Correlation Coefficient and
RMSE to assess the performance of the three models
on the data of the six companies.
The experimental results show that MLP obtained
best performance for high non-linear data. The
performance in Correlation Coefficient is consistent
to the performance in RMSE for the three models.
The performance of the three models for Problem 1 is
better than their performance for Problem 2. It means
that we need to use different models for different data.
REFERENCES
Arefin, J. & Rahman, R.M. 2011, "Testing different forms
of efficiency for Dhaka Stock Exchange", International
Journal of Financial Services Management, vol. 5, no.
1, pp. 1-20.
Bagheri, A., Peyhani, H.M. & Akbari, M. 2014, "Financial
forecasting using ANFIS networks with quantum-
behaved particle swarm optimization", Expert Systems
with Applications, vol. 41, no. 14, pp. 6235-6250.
Blair, B.J., Poon, S. & Taylor, S.J. 2010, "Forecasting S&P
100 volatility: the incremental information content of
implied volatilities and high-frequency index returns"
in Handbook of Quantitative Finance and Risk
Management Springer, , pp. 1333-1344.
Boyacioglu, M.A. & Avci, D. 2010, "An adaptive network-
based fuzzy inference system (ANFIS) for the
prediction of stock market return: the case of the
Istanbul stock exchange", Expert Systems with
Applications, vol. 37, no. 12, pp. 7908-7912.
Chen, K., Lin, H. & Huang, T. 2009, "The prediction of
0.9901
0.9920
0.9920
0.9929
0.9807
0.9957
0.9808
0.9846
0.9846
0.9864
0.9628
0.9919
0.9901
0.992
0.992
0.9929
0.9812
0.9957
0.9809
0.9846
0.9846
0.9864
0.9624
0.9919
0.9902
0.9921
0.9921
0.9929
0.9781
0.9963
0.981
0.9847
0.9847
0.9863
0.9579
0.9931
123456
CORRELATION COEFFICIENT
COMPANY ID
PROBLEM 1 VS PROBLEM 2
LR for Prob.1 LR for Prob.2 MLP for Prob.1
MLP for Prob.2 RBF for Prob.1 RBF for Prob.2
KDIR 2015 - 7th International Conference on Knowledge Discovery and Information Retrieval
430
Taiwan 10-year government bond yield", WSEAS
Transactions on Systems, vol. 8, no. 9, pp. 1051-1060.
Chen, M. 2013, "A hybrid ANFIS model for business
failure prediction utilizing particle swarm optimization
and subtractive clustering", Information Sciences, vol.
220, pp. 180-195.
Chen, W. & Du, Y. 2009, "Using neural networks and data
mining techniques for the financial distress prediction
model", Expert Systems with Applications, vol. 36, no.
2, pp. 4075-4086.
De Oliveira, F.A., Zárate, L.E., de Azevedo Reis, M. &
Nobre, C.N. 2011, "The use of artificial neural
networks in the analysis and prediction of stock prices",
Systems, Man, and Cybernetics (SMC), 2011 IEEE
International Conference onIEEE, , pp. 2151.
Du Jardin, P. & Séverin, E. 2011, "Predicting corporate
bankruptcy using a self-organizing map: An empirical
study to improve the forecasting horizon of a financial
failure model", Decision Support Systems, vol. 51, no.
3, pp. 701-711.
Esichaikul, V. & Srithongnopawong, P. 2010, "Using
relative movement to support ANN-based stock
forecasting in Thai stock market", International
Journal of Electronic Finance, vol. 4, no. 1, pp. 84-98.
Fayyad, U., Piatetsky-Shapiro, G. & Smyth, P. 1996, "From
data mining to knowledge discovery in databases", AI
magazine, vol. 17, no. 3, pp. 37.
Geng, R., Bose, I. & Chen, X. 2015, "Prediction of financial
distress: An empirical study of listed Chinese
companies using data mining", European Journal of
Operational Research, vol. 241, no. 1, pp. 236-247.
Guo, Z., Wang, H., Yang, J. & Miller, D.J. 2015, "A Stock
Market Forecasting Model Combining Two-
Directional Two-Dimensional Principal Component
Analysis and Radial Basis Function Neural Network", .
Guresen, E., Kayakutlu, G. & Daim, T.U. 2011, "Using
artificial neural network models in stock market index
prediction", Expert Systems with Applications, vol. 38,
no. 8, pp. 10389-10397.
Han, S. & Chen, R. 2007, "Using svm with financial
statement analysis for prediction of stocks",
Communications of the IIMA, vol. 7, no. 4, pp. 63.
Hsieh, N. & Hung, L. 2010, "A data driven ensemble
classifier for credit scoring analysis", Expert Systems
with Applications, vol. 37, no. 1, pp. 534-545.
Ince, H. & Trafalis, T.B. 2008, "Short term forecasting with
support vector machines and application to stock price
prediction", International Journal of General Systems,
vol. 37, no. 6, pp. 677-687.
Jiang, Y., Wang, H. & Xie, Q. 2009, "Classification model
of companies' financial performance based on
integrated support vector machine", Management
Science and Engineering, 2009. ICMSE 2009.
International Conference on IEEE, , pp. 1322.
Kara, Y., Boyacioglu, M.A. & Baykan, ÖK. 2011,
"Predicting direction of stock price index movement
using artificial neural networks and support vector
machines: The sample of the Istanbul Stock Exchange",
Expert Systems with Applications, vol. 38, no. 5, pp.
5311-5319.
Kazem, A., Sharifi, E., Hussain, F.K., Saberi, M. &
Hussain, O.K. 2013, "Support vector regression with
chaos-based firefly algorithm for stock market price
forecasting", Applied Soft Computing, vol. 13, no. 2, pp.
947-958.
Khirbat, G., Gupta, R. & Singh, S. 2013, "Optimal Neural
Network Architecture for Stock Market Forecasting",
Communication Systems and Network Technologies
(CSNT), 2013 International Conference onIEEE, , pp.
557.
Lai, R.K., Fan, C., Huang, W. & Chang, P. 2009, "Evolving
and clustering fuzzy decision tree for financial time
series data forecasting", Expert Systems with
Applications, vol. 36, no. 2, pp. 3761-3773.
Li, H. & Wong, M. 2014, "Knowledge discovering in
corporate securities fraud by using grammar based
genetic programming", Journal of Computer and
Communications, vol. 2, no. 04, pp. 148.
Mostafa, M.M. 2010, "Forecasting stock exchange
movements using neural networks: Empirical evidence
from Kuwait", Expert Systems with Applications, vol.
37, no. 9, pp. 6302-6309.
Öğüt, H., Doğanay, M.M., Ceylan, N.B. & Aktaş, R. 2012,
"Prediction of bank financial strength ratings: The case
of Turkey", Economic Modelling, vol. 29, no. 3, pp.
632-640.
Olaniyi, S.A.S., Adewole, K.S. & Jimoh, R. 2011, "Stock
trend prediction using regression analysis–a data
mining approach", ARPN Journal of Systems and
Software, vol. 1, no. 4, pp. 154-157.
Pacelli, V., Bevilacqua, V. & Azzollini, M. 2011, "An
artificial neural network model to forecast exchange
rates", Journal of Intelligent Learning Systems and
Applications, vol. 3, no. 02, pp. 57.
Pan, N.H., Lee, M.L. & Chang, C.W. 2011, "Construction
Financial Crisis Warning Model Using Data Mining",
Advanced Materials Research Trans Tech Publ, , pp.
684.
Pan, W. 2012, "A new fruit fly optimization algorithm:
taking the financial distress model as an example",
Knowledge-Based Systems, vol. 26, pp. 69-74.
Patell, J.M. 1976, "Corporate forecasts of earnings per
share and stock price behavior: Empirical test", Journal
of accounting research, , pp. 246-276.
Qiu, X.Y. 2007, "On building predictive models with
company annual reports", .
Quah, J.T. & Ng, W. 2007, "Utilizing computational
intelligence for DJIA stock selection", Neural
Networks, 2007. IJCNN 2007. International Joint
Conference onIEEE, , pp. 956.
Quah, T. 2008, "DJIA stock selection assisted by neural
network", Expert Systems with Applications, vol. 35,
no. 1, pp. 50-58.
Rajakumar, M.P. & Shanthi, V. 2014, "Forecasting
earnings per share for companies in it sector using
Markov process model", Journal of Theoretical and
Applied Information Technology, vol. 59, no. 2, pp.
332-341.
Ravisankar, P. & Ravi, V. 2010, "Financial distress
prediction in banks using Group Method of Data
Prediction of Earnings per Share for Industry
431
Handling neural network, counter propagation neural
network and fuzzy ARTMAP", Knowledge-Based
Systems, vol. 23, no. 8, pp. 823-831.
Ravisankar, P., Ravi, V., Rao, G.R. & Bose, I. 2011,
"Detection of financial statement fraud and feature
selection using data mining techniques", Decision
Support Systems, vol. 50, no. 2, pp. 491-500.
Rezaie, K., Dalfard, V.M., Hatami-Shirkouhi, L. & Nazari-
Shirkouhi, S. 2013, "Efficiency appraisal and ranking
of decision-making units using data envelopment
analysis in fuzzy environment: a case study of Tehran
stock exchange", Neural Computing and Applications,
vol. 23, no. 1, pp. 1-17.
Saigal, S. & Mehrotra, D. 2012, "Performance comparison
of time series data using predictive data mining
techniques", Advances in Information Mining, vol. 4,
no. 1, pp. 57-66.
Sajja, P.S. & Akerkar, R. 2012, Intelligent technologies for
Web applications, CRC Press.
San Ong, T., Yichen, Y.N. & Teh, B.H. 2010, "Can High
Price Earnings Ratio Act As An Indicator Of The
Coming Bear Market In The Malaysia?", International
Journal Of Business And Social Science, vol. 1, no. 1.
Sermpinis, G., Theofilatos, K., Karathanasopoulos, A.,
Georgopoulos, E.F. & Dunis, C. 2013, "Forecasting
foreign exchange rates with adaptive neural networks
using radial-basis functions and particle swarm
optimization", European Journal of Operational
Research, vol. 225, no. 3, pp. 528-540.
Serrano-Cinca, C. & GutiéRrez-Nieto, B. 2013, "Partial
least square discriminant analysis for bankruptcy
prediction", Decision Support Systems, vol. 54, no. 3,
pp. 1245-1255.
Shen, W., Guo, X., Wu, C. & Wu, D. 2011, "Forecasting
stock indices using radial basis function neural
networks optimized by artificial fish swarm algorithm",
Knowledge-Based Systems, vol. 24, no. 3, pp. 378-385.
Song, X., Ding, Y., Huang, J. & Ge, Y. 2010, "Feature
selection for support vector machine in financial crisis
prediction: a case study in China", Expert Systems, vol.
27, no. 4, pp. 299-310.
Timor, M., Dincer, H. & Emir, S. 2012, "Performance
comparison of artificial neural network (ANN) and
support vector machines (SVM) models for the stock
selection problem: An application on the Istanbul Stock
Exchange (ISE)-30 index in Turkey", .
Vaisla, K.S. & Bhatt, A.K. 2010, "An analysis of the
performance of artificial neural network technique for
stock market forecasting", International Journal on
Computer Science and Engineering, vol. 2, no. 6, pp.
2104-2109.
Wang, J., Wang, J., Zhang, Z. & Guo, S. 2011, "Forecasting
stock indices with back propagation neural network",
Expert Systems with Applications, vol. 38, no. 11, pp.
14346-14355.
Wong, C. & Versace, M. 2012, "CARTMAP: a neural
network method for automated feature selection in
financial time series forecasting", Neural Computing
and Applications, vol. 21, no. 5, pp. 969-977.
Yan, X., Wang, Z., Yu, S. & Li, Y. 2005, "Time series
forecasting with RBF neural network", Machine
Learning and Cybernetics, 2005. Proceedings of 2005
International Conference onIEEE, , pp. 4680.
KDIR 2015 - 7th International Conference on Knowledge Discovery and Information Retrieval
432
