
Open Data for Improving Youth Policies
Domenico Beneventano, Sonia Bergamaschi, Luca Gagliardelli and Laura Po
Dipartimento di Ingegneria ”Enzo Ferrari”, Universit
`
a di Modena e Reggio Emilia, Modena, Italy
Keywords:
Open Government Data, Linked Open Data, Youth Policies, Emilia Romagna Region, Municipality of
Modena.
Abstract:
The Open Data philosophy is based on the idea that certain data should be made available to all citizens, in an
open form, without any copyright restrictions, patents or other mechanisms of control. Various government
have started to publish open data, first of all USA and UK in 2009, and in 2015, the Open Data Barometer
project (www.opendatabarometer.org) states that on 77 diverse states across the world, over 55 percent have
developed some form of Open Government Data initiative. We claim Public Administrations, that are the
main producers and one of the consumers of Open Data, might effectively extract important information by
integrating its own data with open data sources. This paper reports the activities carried on during a one-
year research project on Open Data for Youth Policies. The project was mainly devoted to explore the youth
situation in the municipalities and provinces of the Emilia Romagna region (Italy), in particular, to examine
data on population, education and work. The project goals were: to identify interesting data sources both from
the open data community and from the private repositories of local governments of Emilia Romagna region
related to the Youth Policies; to integrate them and, to show up the result of the integration by means of a
useful navigator tool; in the end, to publish new information on the web as Linked Open Data. This paper also
reports the main issues encountered that may seriously affect the entire process of consumption, integration
till the publication of open data.
1 INTRODUCTION
In recent years, the number of international confer-
ences on Open Government and Open Data has been
increasing. Showing that the attention of governments
to the transparency and the interest of the scientific
and economic community to exploit these data is rais-
ing.
Many governments now release large quantities
of data into the public domain, often free of charge
and without administrative overhead. These data are
called Open Government Data (OGD). OGD has let
to several improvements, such as transparency and
democratic control, citizen participation, innovation,
improved efficiency and effectiveness of government
services, impact measurement of policies, the creation
of new knowledge from combined data sources and
patterns in large data volumes.
The powerful of open data is that many areas can
take advantage from their value. And also many dif-
ferent groups of people and organizations can benefit
from the availability of open data, including govern-
ment itself.
In Italy, in recent years, the open data approach
has been adopted by a growing number of Public Ad-
ministrations and, in some cases, an additional effort
has been made to supply Linked Open Data (LOD).
On June 2013, the leaders of the G8 signed an
agreement committing to advance open data in their
respective countries. In Italy a number of open data
activities started. At the beginning of June 2015, the
open data portal of the italian public administration
1
,
which since 2011 hosts a catalog of open data pub-
lished by ministries, regions and local authorities, has
been revamped in order to promote transparency, ac-
countability, diffusion and reuse of open data.
Among all the open datasets, the Emilia Romagna
Region is present with 642 datasets
2
and 14 open
data portals. The Emilia Romagna Region has nine
provinces (Piacenza, Parma, Reggio Nell’Emilia,
Modena, Bologna, Ferrara, Forl
`
ı-Cesena, Rimini,
Ravenna) and 340 municipalities. The open data por-
tals of the Emilia Romagna region include one re-
gional
3
, eight municipalities (Piacenza, Bologna, An-
1
www.dati.gov.it
2
information available on dati.gov.it at 31st July 2015
3
http://dati.emilia-romagna.it/
118
Beneventano, D., Bergamaschi, S., Gagliardelli, L. and Po, L..
Open Data for Improving Youth Policies.
In Proceedings of the 7th International Joint Conference on Knowledge Discovery, Knowledge Engineering and Knowledge Management (IC3K 2015) - Volume 2: KEOD, pages 118-129
ISBN: 978-989-758-158-8
Copyright
c
2015 by SCITEPRESS – Science and Technology Publications, Lda. All rights reserved
zola Emilia, Ferrara, Ravenna, Faenza, Cesena, Rim-
ini), three provinces (Parma, Bologna, Forl
`
ı-Cesena )
and the public transport company (Passenger Trans-
port Emilia-Romagna).
This paper describes the activities performed dur-
ing a one-year research project on Open Data for
Youth Policies. The project is called “Open Linked
Data of the youth observatory of the Emilia-Romagna
Region” and has been funded by the Municipality of
Modena. However, the main dimensions of analy-
sis of the project concern all the municipalities and
provinces of the Emilia Romagna region.
The project goals were: to identify interesting
data sources both from the open data community and
from the private repositories of local governments of
Emilia Romagna region related to the Youth Policies,
in particular, to the topics of population, education
and work; to integrate them and, to show up the re-
sult of the integration by means of a useful navigator
tool; in the end, to publish new information as Linked
Open Data.
We experienced practical problems in selecting,
using, integrating heterogeneous data and building a
set of concrete metrics to assess the quality of dis-
closed data. Moreover, it was challenging to support
the transition towards LOD.
There are many Open Data initiatives in Italy for
publich Open Data, for example: OpenCoesione
4
and
Open Bilanci
5
that show the public administration ex-
penses. In these websites the user can view fixed indi-
cators, chosen by the application’s but he cannot com-
bine the indicators as he likes. In these open dataset
it is not possible for the user to perform customized
searches, morever, the data can be navigated only sep-
arately, in example, the user cannot integrate data on
population with data on provided fundings. On the
contrary our work permits to integrate different data
sources, thus correlating open data sets.
The project has been developed in four phases.
The first phase was devoted to a deep and wide analy-
sis of the available data sources (local, regional, na-
tional and international) in order to individuate the
most relevant ones. The second phase made use of
the open source data integration system, MOMIS
6
,
to integrate the selected data sources in virtual global
views. The third phase provided an easy-to-use dash-
board, i.e. MOMIS dashboard, to visualize the in-
formation emerging from aggregated data. Finally,
the fourth phase aimed to make the resulting value-
added information, public and searchable on the Web
as Linked Open Data.
4
http://www.opencoesione.gov.it/
5
http://www.openbilanci.it
6
http://www.datariver.it/data-integration/momis/
The key partners in this project were: the Munic-
ipality of Modena, the Department of Culture, Youth
and Policies for the Legality of the Emilia Romagna
region and the DBGroup
7
.
The remainder of the paper is structured as fol-
lows. Section 2 illustrates the set of tools we used
to reach the project goals. The next four sections de-
scribe the phases of the project. Finally, Section 7
sketches the conclusion and the main difficulties faced
during the project.
2 TOOLS
The data integration process was performed with
MOMIS, a data integration system developed by the
DBGroup (Beneventano et al., 2003) of the University
of Modena and Reggio Emilia and now distributed by
the DATARIVER spin-off
8
. The integration results of
the project have been shown by the MOMIS Dash-
board, a web application developed by Datariver8.
For the publication and navigation of Linked open
Data, the D2R Server (Bizer and Cyganiak, 2007) and
the LODeX tool (Benedetti et al., 2014a; Benedetti
et al., 2014b) have been used.
The MOMIS Data Integration System
In the following, we briefly present the MOMIS’s ar-
chitecture, a more detailed description can be found in
(Beneventano et al., 2003) (Bergamaschi et al., 2001).
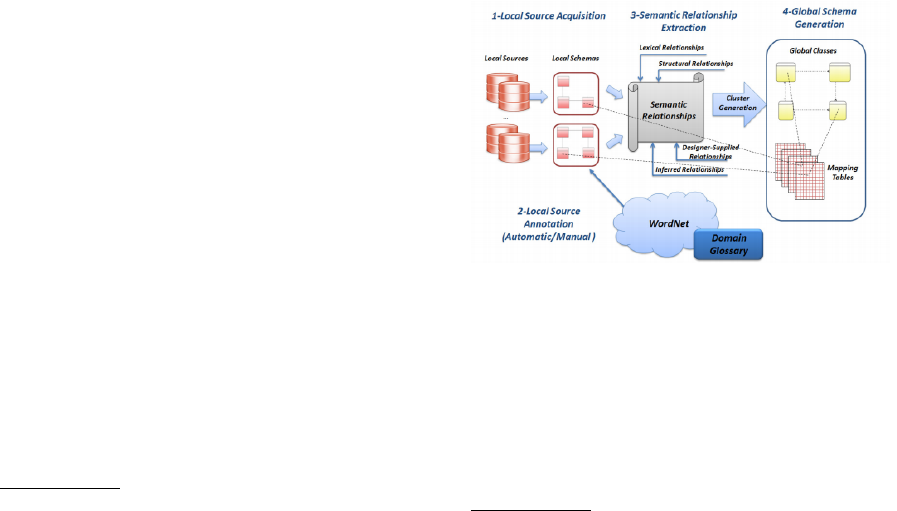
Figure 1: The MOMIS Data Integration Process.
Given a set of heterogeneous and distributed data
sources MOMIS generates in a semi-automatic way
a unified schema called Global Schema (GS), that al-
lows users to formulate queries on that schema like
they are querying a single database. The system per-
forms the integration task, by following an Global-
As-View (GAV) approach for creating the mappings
between the GS and local schemas of the integrated
7
http://dbgroup.unimo.it/
8
http://www.datariver.it
Open Data for Improving Youth Policies
119
data sources. MOMIS uses a virtual approach for
achieving an integration that preserves the autonomy
and security of the local sources.
The integration process is composed of four main
phases:
1. Local Schema Acquisition: (Figure 1-1) the ex-
traction of Local Source Schemas is performed by
wrappers that automatically extract the schema of
each local source and convert it into the common
language ODL
I3
.
2. Local Sources Annotation: (Figure 1-2) the de-
signer can perform automatic annotation and/or
can manually select a base form and the appropri-
ate WordNet meaning(s) (i.e. synset(s)) for each
term. Moreover, the designer can extend Word-
Net with Domain Glossaries. Annotation consists
in associating to each class and attribute name,
one or more meanings w.r.t. a common lexical ref-
erence, i.e. domain glossaries/WordNet
9
(Miller
et al., 1990). The Local Source Annotation phase
is performed by the Global Schema Designer tool
(see Figure 2)
3. Semantic Relationships Extraction: (Figure 1-
3) starting from the annotated local schemas,
MOMIS derives a set of intra and inter-schema
semantic relationships in the form of: synonyms
(SYN), broader terms/narrower terms (BT/NT)
and related terms (RT) relationships. The set of
semantic relationships is incrementally built by
adding: structural relationships (deriving from
the structure of each schema), lexical relation-
ships (deriving from the element annotations,
by exploiting the WordNet semantic network),
designer-supplied relationships (representing spe-
cific domain knowledge) and inferred relationship
(deriving from Description Logics equivalence
and subsumption computation). The Semantic
Relationship Extraction phase is performed by the
Global Schema Designer tool (see Figure 2).
4. GS Generation: (Figure 1-4) starting from the
discovered semantic relationships and the local
sources schemas, MOMIS generates a GS con-
sisting of a set of global classes, plus a corre-
sponding set of Mapping Tables which contain the
GAV mappings connecting the global attributes
of each global class with the local source at-
tributes. The GS generation is a process where
9
WordNet is a thesaurus for the English language, that
groups terms (called lemmas in the WordNet terminology)
into sets of synonyms called synsets, provides short defini-
tions (called gloss), and connects the synsets through a wide
network of semantic relationships.
classes describing the same or semantically re-
lated concepts in different sources are identified
and clustered into the same global class. The de-
signer may interactively refine and complete the
proposed integration result through the GUI pro-
vided by the Global Schema Designer tool. In par-
ticular, she/he can: modify the proposed global
classes and mappings; select the appropriate Join
function for each global class; define Transforma-
tion Functions to transform the local attribute val-
ues into the corresponding global attribute values
and solve possible data conflicts through the defi-
nition of Resolution Functions. Resolution Func-
tions are applied to each global attribute to solve
conflicts arising from different values of local at-
tributes mapped into the same global attribute.
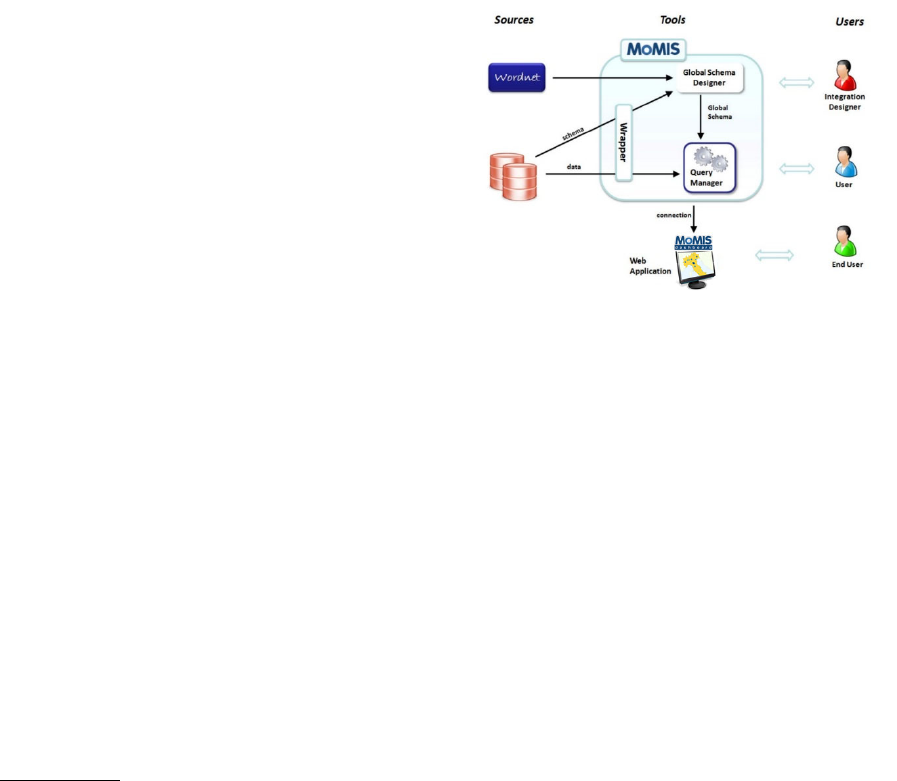
Figure 2: The MOMIS Architecture.
Finally, once obtained the desired integration re-
sult, a user can pose queries on the GS by using the
Query Manager tool (see Figure 2). As MOMIS fol-
lows a GAV approach, the query processing is per-
formed by means of query unfolding. The query un-
folding process generates for each global query (i.e. a
query on the GS) a Query Plan composed by a set of
queries:
• a set of local queries that have to be executed
on the local sources simultaneously by means of
wrappers,
• a mapping query for merging the partial results
(defined by means of the join function),
• a final query to apply the resolution functions and
residual clauses.
MOMIS provides another query capability, the
Query Manager Web Service, which permits to
easily integrate MOMIS with other applications (e.g.
Business Intelligence solutions) and a user-friendly
Web Application, i.e. the MOMIS Dashboard (Figure
2) to easily visualize synthetic information.
More information on MOMIS and exam-
ples can be found on DATARIVER website at
KEOD 2015 - 7th International Conference on Knowledge Engineering and Ontology Development
120
the following URL http://www.datariver.it/data-
integration/momis/tutorials/
For showing the integration results of our project,
we used the MOMIS Dashboard web application de-
veloped by Datariver8.
The MOMIS Dashboard
The advantages of using visualization tools to explore
the correlation among data are numerous (Tufte and
Graves-Morris, 1983). The analysts do not have to
learn any sophisticated method to be able to inter-
pret the resulting graphs. Effective visualizations help
users in analyzing and reasoning about data and evi-
dence and make complex data more accessible, un-
derstandable and usable.
The MOMIS Dashboard is a interactive visualiza-
tion tool that offers several views on a set of data. It
makes easier to compare data and capture useful in-
formation. It allows to filter the data and visualize the
results through different charts. In particular, it is pos-
sible to display line charts (for showing trends), bar
charts, pie charts, bubble charts on a Google Maps,
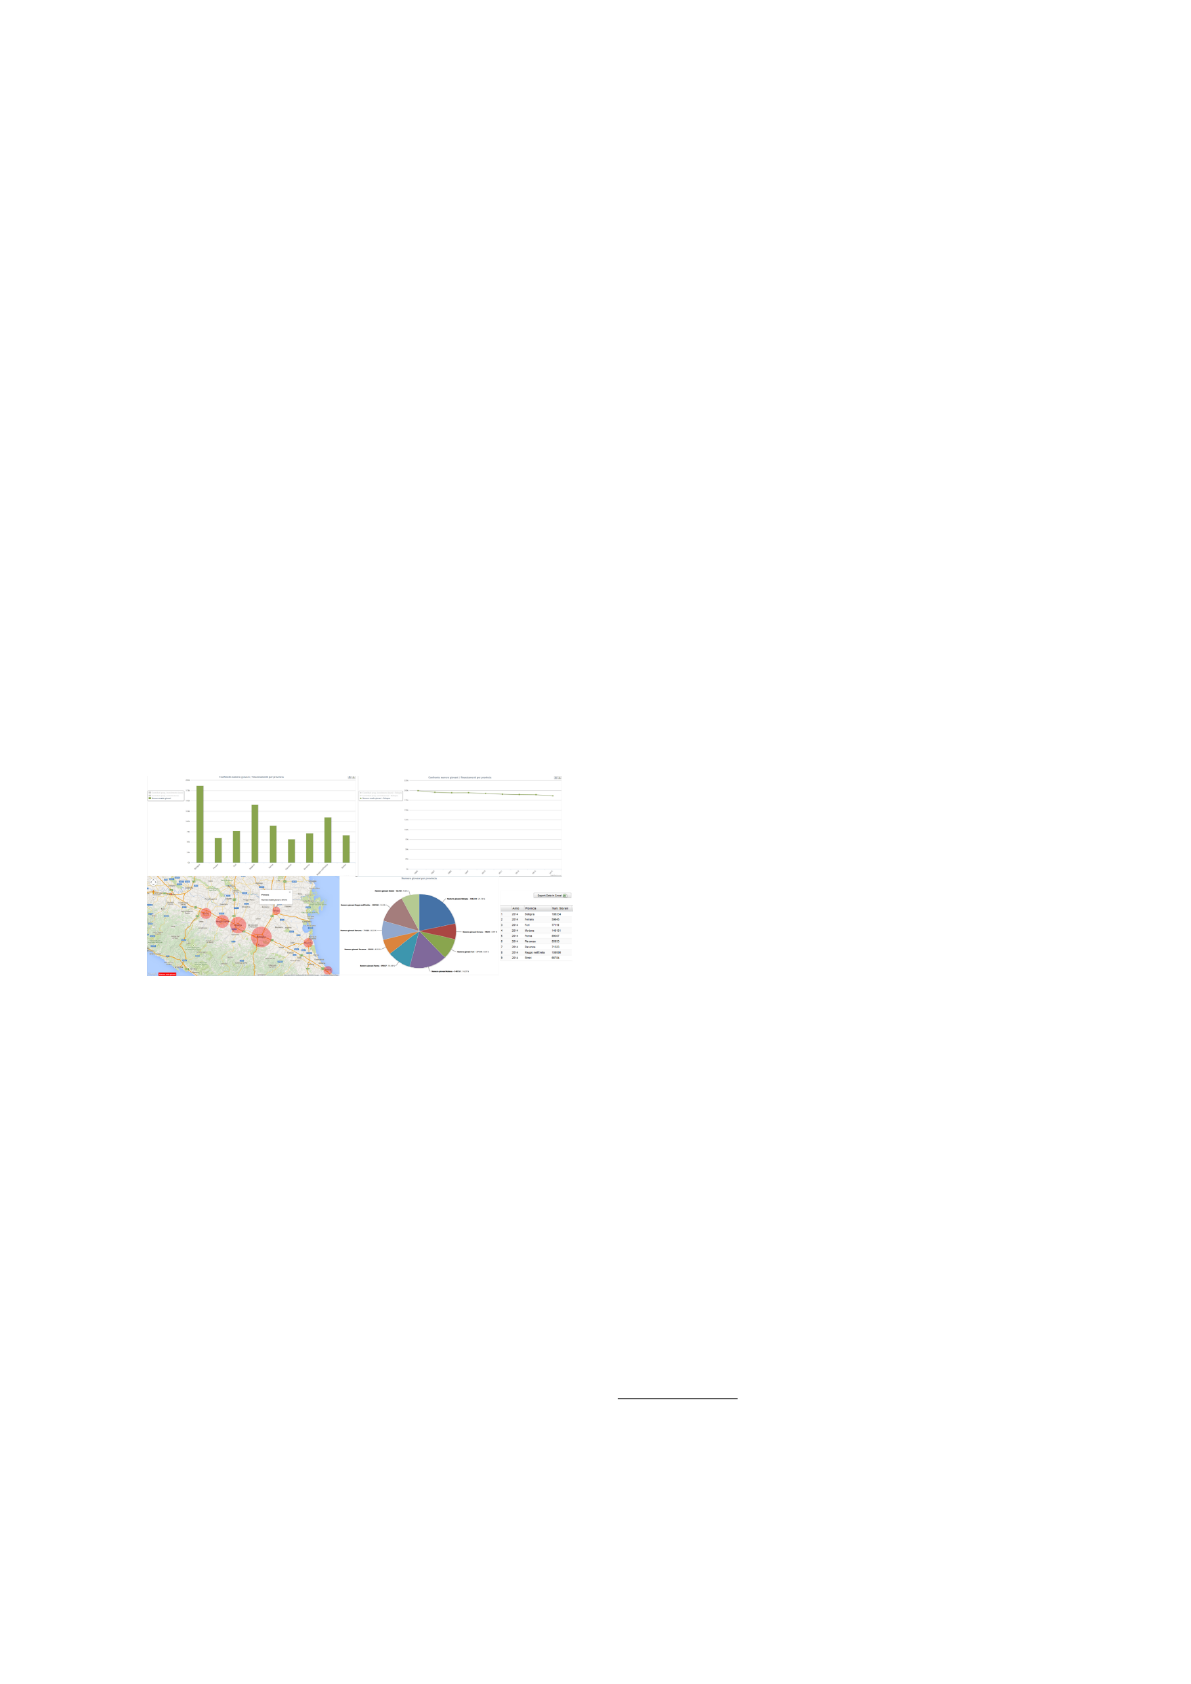
or show the data in a tabular view. Figure 3 presents
some examples of charts that can be generated with
the MOMIS Dashboard.
Figure 3: Different charts created by using the MOMIS
Dashboard.
The D2R Server and the LODeX Tool
In order to publish in the LOD cloud the project re-
sults, we needed a tool for mapping a relational source
in RDF. The W3C RDB2RDF Incubator Group (Sa-
hoo et al., 2009) had the mission to examine and clas-
sify existing approaches to mapping relational data
into an RDF source. The tools for automatic mapping
generation define a set of mappings between RDB and
RDF namely: an RDB record is a RDF node, the col-
umn name of an RDB table is a RDF predicate and an
RDB table cell is a value. Among these tools, we se-
lected D2RQ (Bizer and Cyganiak, 2007) as it allows
users to define customized mappings.
Once a LOD dataset is available, a tool to nav-
igate, explore and query it is necessary. We ex-
ploited LODeX(Benedetti et al., 2014a; Benedetti
et al., 2014b), a tool able to provide a summary of
a LOD source starting from scratch, thus supporting
users in exploring and understanding the contents of
a dataset. Moreover, LODEX provides a visual query
interface to easily compose queries, that are automat-
ically translated in Sparql and executed on a LOD
source.
3 DATA SOURCE SELECTION,
EXTRACTION AND CLEANING
In the first phase of the project, we focused on the
selection of the most relevant data sources w.r.t the
main dimensions of analysis of the project, i.e. mu-
nicipalities and provinces of the Emilia Romagna Re-
gion. We have used and analyzed both proprietary and
open data sources, the proprietary data sources was
provided by the Emilia Romagna region, the sources
were:
• A Database of Current Spending Projects: it
contains information about the fundings provided
for projects on youth populations actuated in the
different provinces of the region;
• An Excel File of Capital Spending Projects: it
contains information about funding provided for
long period investments (e.g. build structures,
equipments);
• A database of Social Centers (SAG - “Spazi di
Aggregazione Giovanile”) : it lists all the places
where young people get together or places where
recreational activities for youth are organized;
• Three Excel Files Related to the Youth Infor-
mation Project (“Progetto Informagiovani”):
The information centers provide data at local, na-
tional and international level on different topics of
interest for young people aged 13 to 35 years. The
main areas covered are relate to study, work, con-
tinuing education, travel and holidays, study and
work abroad, leisure, social life and health. These
files contain statistics about the number of visitors
of the website
10
, the number of points on the re-
gion and the number of editors;
• An Excel File about the Young ER Card
Project: YoungERcard
11
is the new card designed
by the Emilia Romagna region for young peo-
ple aged between 14 and 29 residents, students
or workers in Emilia Romagna. The card is dis-
tributed for free and reserve holders a series of fa-
cilities for the enjoyment of cultural and sportive
10
informagiovanionline.it
11
https://www.youngercard.it/
Open Data for Improving Youth Policies
121
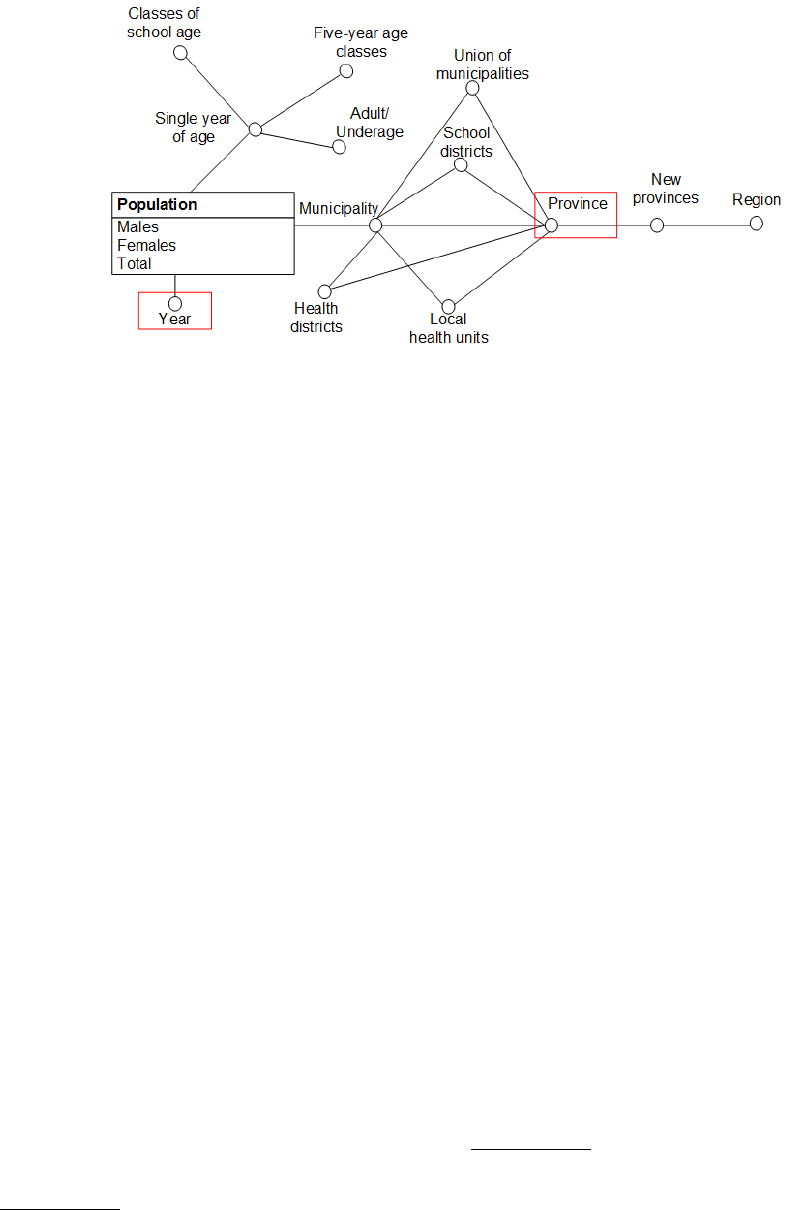
Figure 4: Conceptual schema of the Regional Statistical Service.
events and discounts at various shops. The file re-
ports information related to the Young Emilia Ro-
magna Card distribution and extensiveness in the
region.
Regarding open data sources, several sites and
portals that publish information regarding the youth
population have been investigated. Not all sources
have revealed to be of interest/usable for the project
and thus have not been included in the data sources to
be integrated.
• ISTAT - the Italian National Institute of Statis-
tics
12
provides different thematic datasets. We fo-
cused on some areas of interest: education and
work. In the education dataset information re-
garding the number of students per type of school
(primary, secondary, etc.) are provided, while
in the work dataset the rate of employment, un-
employment and wages are presented. Although
these data were useful for the project goals, they
were not included due to the coarse granularity
of the data, indeed, the minimum level of detail
available was at the regional level.
• Alma Graduate - The Alma Graduate website
13
yields information on the profile of the graduates
and their employment status. The profile of a
graduate student shows information such as de-
mographics, the study path and other statistics;
while the employment status reports data on the
type of job, salary, satisfaction, etc. These data
could have been useful for the project, but were
not included as they are not free accessible and
downloadable (data collected by AlmaLaurea are
usually sold to companies).
12
www.istat.it
13
www.almalaurea.it/universita/statistiche
• “Il Mulino” Youth Report - The database of the
Youth Report contains data derived from the sur-
vey conducted on a sample of 9000 youth aged
from 18 to 29. The survey concerns the values,
expectations, projects and life choices of young
people, their trust in institutions, their role in civil
society and the relationship between the genera-
tions. For each theme, you can choose a question-
naire, in which it is granted the choice by region,
gender, age, marital status and educational qualifi-
cation. This source was not included as the survey
questions do not match our goals and, moreover,
it is difficult to meaningfully integrate data from
poll and from statistics (due to the different level
of reliability).
• “Orienter” - Database of Training Courses -
This source
14
collects information of all training
courses financed or authorized by the Emilia - Ro-
magna Region. The source was not included, be-
cause it shows only the active courses and it was
not possible to access historical data.
• Emilia Romagna Labor Statistics - This web-
site
15
presents some data on the labor market of
the Emilia - Romagna region. Employment data,
trends in the labor markets and social security
benefits are collected and periodically updated.
By analyzing the source, we realized that the pub-
lished data are a rearrangement of other sources,
in particular, several data are taken from the IS-
TAT portal.
• Emilia Romagna Statistical Service - This web-
14
http://orienter.regione.emilia-romagna.it
15
http://formazionelavoro.regione.emilia-
romagna.it/analisi-sul-mercato-del-
lavoro/approfondimenti/statistiche-sul-lavoro-in-emilia-
romagna
KEOD 2015 - 7th International Conference on Knowledge Engineering and Ontology Development
122
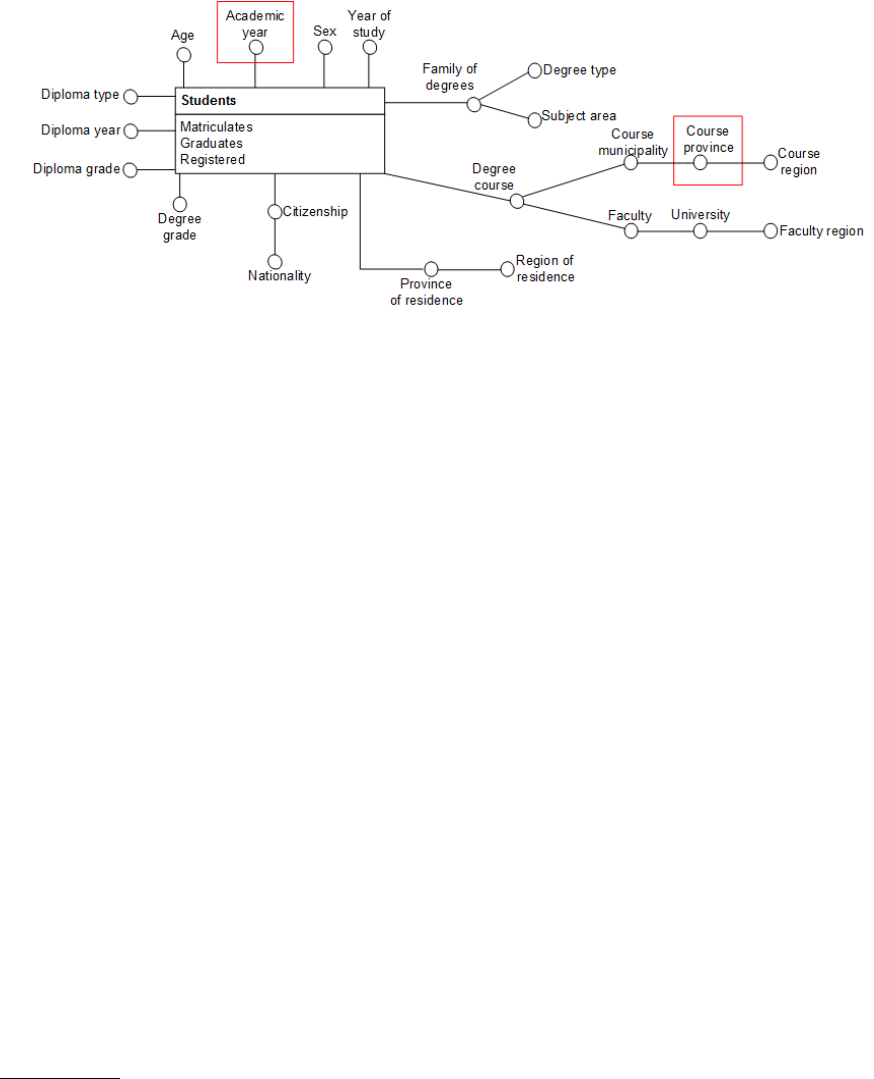
Figure 5: Conceptual schema of the National Student Register.
site
16
is divided into several thematic sites that re-
port information on population, transport, sports,
productive sectors, etc.. For our project, we fo-
cused on the “population” and “education” sites.
The population website
17
contains data organized
on the basis of different measures (age, sex, year
of the survey, place ...). The education web-
site
18
reports the number of schools, the number
of classes and the number of students per type of
school and province. The source was selected as
a relevant source, a detailed analysis was made to
understand how the data were structured (see the
analysis in the following).
• National Student Register - MIUR - This reg-
ister
19
, provided by the Italian Ministry of Edu-
cation, University And Research, contains infor-
mation on the number of students and graduates
in the various degree courses of Italian universi-
ties. The source was selected as a relevant source
for the project, a detailed analysis was made to
understand how the data were structured (see the
analysis in the following).
Our work of selecting sources and extracting rel-
evant data was driven by few relevant questions aris-
ing by the local and regional politicians: “how many
funding was provided in any province compared to
the number of youth residents (aged 15-34)?”, “which
is the higher education rate in each province?”. These
questions have to be answered in an historical per-
spective, thus monitoring the data of each province
16
http://statistica.regione.emilia-romagna.it/
servizi-online/
17
http://statistica.regione.emilia-romagna.it/
servizi-online/statistica-self-service/popolazione/
popolazione-per-eta-e-sesso
18
http://statistica.regione.emilia-romagna.it/
servizi-online/statistica-self-service/istruzione/
19
http://anagrafe.miur.it
over the years. To effectively answer these questions,
we selected, among the available sources, the ones
that supply the number of young residents in each
province and their level of education. The data on the
youth population have been extracted from the Emilia
Romagna Statistical Service, while the data on edu-
cation have been extracted from the National Student
Register. The data that was required had to be aggre-
gated by province and year, therefore a preliminary
study on which dimensions were provided on these
data sources was needed. Figures 4 and 5 show the
conceptual schema of the two sources. As you can
see, the sources have different dimensions and dif-
ferent level of granularity, thus we needed to select
appropriate dimensions to allow a successful integra-
tion.
From the Emilia Romagna Statistical Service, we
extracted the number of male, female and total popu-
lation with respect to the following dimensions: Year,
and Province. From the National Student Register,
we extracted the number of matriculates, graduates
and registered with respect to the following dimen-
sions: Academic Year, and Course Province. Since
the academic year is described by a couple of years
(e.g. 2012/2013), we applied a conversion function
to transform it to a single year. Our decision was
to take the first part of the academic year for rep-
resent the enrolling year (usually people enroll in
the first part of the academic year) and the second
part to represent the year of graduation (usually stu-
dents get their degree in the second part of the aca-
demic year). Some naming conflicts occur on the
province names. The main problems were found
on the provinces of Reggio Nell’Emilia and Forl
`
ı-
Cesena that were written in different ways, for exam-
ple “Reggio Emilia”, “Reggio-Emilia”, “Forl
`
ı e Ce-
sena”, “Forli-Cesena”. For solving this problem, we
choose as golden standard the names used on the Re-
Open Data for Improving Youth Policies
123
gional Statistical Service, namely “Forl
`
ı-Cesena” and
“Reggio Nell’Emilia”, and we converted any other
forms to the gold standard.
The data were extracted and saved in a set of
MySQL tables. From the Regional Statistical Service,
we import data into a table with province, year, num-
ber of young residents (aged 15-34 years) attributes;
from the National Student Register we import data
into two distinct tables with province, year, number
of enrolled/graduated students.
4 DATA INTEGRATION
At the end of the first phase of data extraction and
transformation, we had the following data sources:
S1. Current Spending Projects: information about
funding provided for projects on youth popula-
tions actuated in the different provinces of the re-
gion;
S2. Capital Spending Projects: information about
funding provided for long period investments (e.g.
build structures) organized for each province and
year;
S3. Number of Youth Residents: number of youth
residents in each province of the region Emilia
Romagna and for each year;
S4. Number of Youth Information Centers: num-
bers of points of the Youth Information Centers
located in each province and year.
S5. Number of Editors in the Youth Information
Centers: number of member in the editorial staff
operating in the Youth Information Centers for
each province and year.
S6. Number of Web Site Visitors Informagiovan-
ionline: information about the number of the vis-
itors to the website Informagiovanionline for each
province and year.
S7. Young ER Card: data on the Young ER Card for
each province and year.
S8. Number of Graduates Supply by MIUR: infor-
mation about the number of graduated for each
province and year.
S9. Number of Matriculations at the University
Supply by MIUR: information about the number
of matriculations for each province and year.
All these sources have two dimensions in com-
mon: the year and the province. We conducted two
analysis for evaluating the data coverage over the
two dimensions. We found no lack of data over the
provinces, meaning that the data are spread in all the
provinces. Instead, focusing on the entire interval of
years (2006-2014), we found a relevant number of
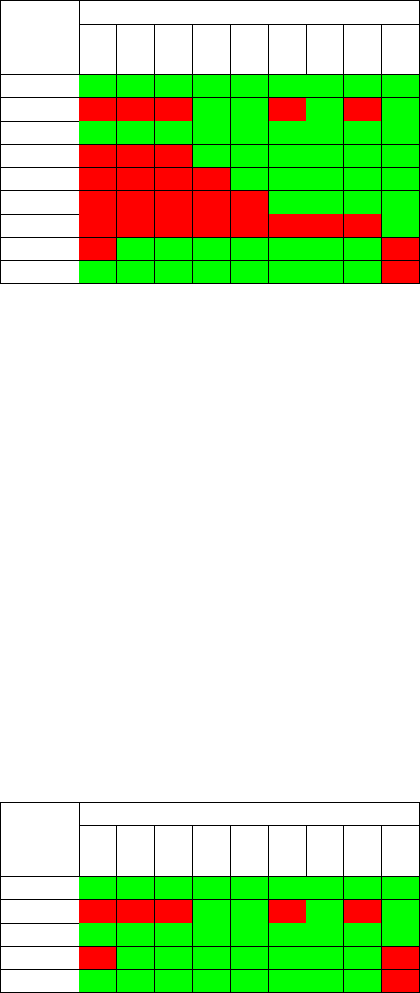
missing data, that is reported in Table 1.
Table 1: Data coverage over the years. The red cells repre-
sent missing data, the green represent that data are present.
Source
Years
2006
2007
2008
2009
2010
2011
2012
2013
2014
S1
S2
S3
S4
S5
S6
S7
S8
S9
Since MOMIS allows the creation of more Global
Schemas (for more information see chapter 2), to
avoid a proliferation of null values in the integration
result, we created three different Global Schemas:
• GS-Projects: this GS considers only S1, S2, S3,
S8, S9.
• GS-Global: this GS contains the data from all the
nine sources;
• GS-Projects-Informagiovani: this GS excludes
the Young ER Card from the integration;
4.1 GS-Projects
As shown in Table 2, only few sources includes data
over the entire period (2006-2014). In this case, we
have taken all data from five of the sources, in or-
der to create charts on the entire period that show the
correlation between founded projects, population and
education.
Table 2: Data coverage of the GS-Projects.
Source
Years
2006
2007
2008
2009
2010
2011
2012
2013
2014
S1
S2
S3
S8
S9
4.2 GS-Global
The GS-Global is the only that includes data on the
Young ER Card, it contains all the nine sources, as
KEOD 2015 - 7th International Conference on Knowledge Engineering and Ontology Development
124
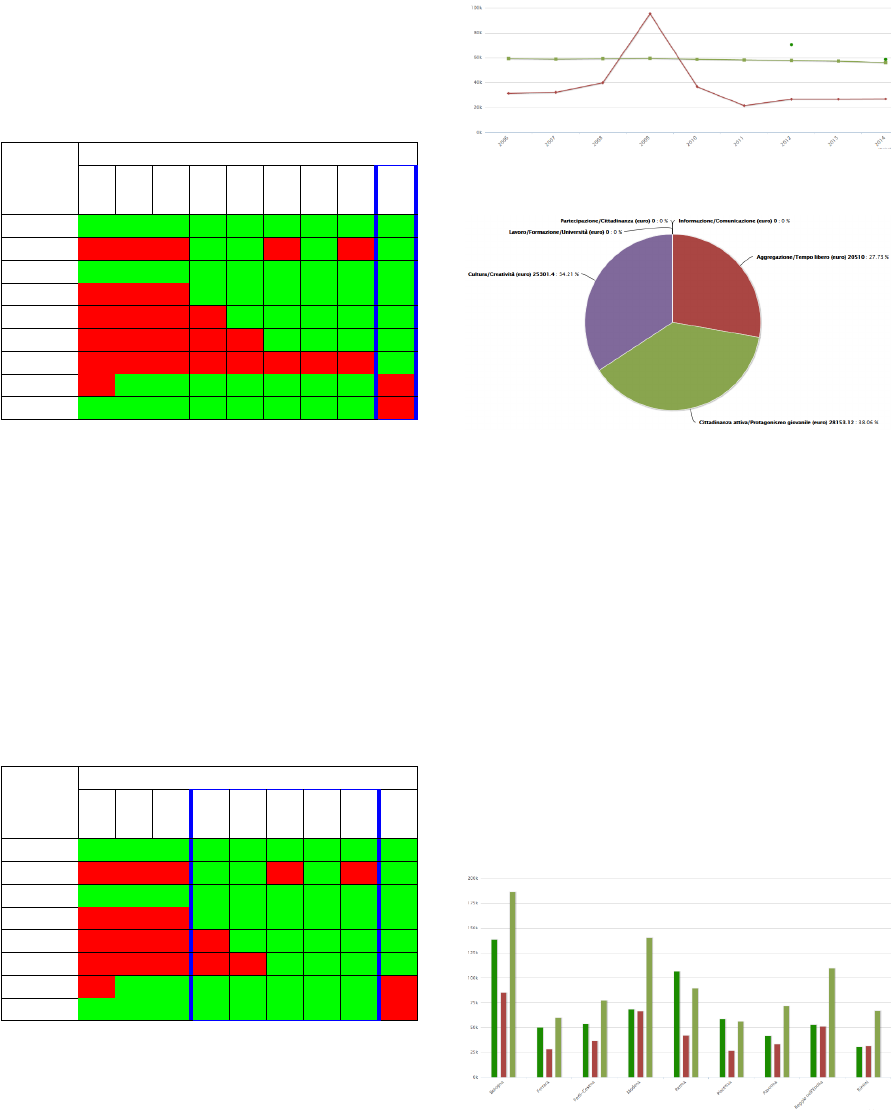
showed in Table 3. On the GS-Global, we created a
view (highlighted in blue in the Table 3) that it is used
in the MOMIS Dashboard and includes only data of
2014.
Table 3: Data coverage of the GS-Global.
Source
Years
2006
2007
2008
2009
2010
2011
2012
2013
2014
S1
S2
S3
S4
S5
S6
S7
S8
S9
4.3 GS-Projects-Informagiovani
Table 1 highlights that the Young ER Card (S7) have
data only for the 2014. Therefore, in the GS-Projects-
Informagiovani we included all sources except S7, as
showed in Table 4. On this integration, we were in-
terested to show the correlations between the data of
the Informagiovani project and the data of education
and founded projects; thus we created a view on the
period 2009 - 2013, where most of these sources have
available data.
Table 4: Data coverage of the GS-Projects-Informagiovani.
Source
Years
2006
2007
2008
2009
2010
2011
2012
2013
2014
S1
S2
S3
S4
S5
S6
S8
S9
5 DATA VISUALIZATION
We designed several charts on the MOMIS Dashboard
in order to answer at the questions provided from the
politicians of the Emilia Romagna region.
The first questions were focused on the funding
compared to the number of youths: “Are the funding
Figure 6: Fundings and youth population trends in the
province of Piacenza from 2006 to 2014.
Figure 7: Funded projects/areas in the province of Modena
on 2009.
provided for each province proportional to the num-
ber of youth?”, ‘How do they evolve over time?’
To visualize the answers of these questions, a bar
chart and a bubble chart on Google Maps were cre-
ated. These charts are activated when the user filters
the data by selecting one or more provinces and a sin-
gle year. Moreover, we created a line chart that is ac-
tivated in case the user selects one or more provinces
and more than one year; these charts show a compari-
son between the youth population and the investments
for each province.
Figure 8 shows the bar chart for the 2014 year,
here you see in dark green the fundings for the capital
spending projects (in euro), in red the fundings for the
current spending projects (in euro) and in light green
the number of youth residents.
Figure 8: A bar chart comparing fundings and youth popu-
lation.
The same result can be shown with a different vi-
sualization in a bubble chart on a map (Figure 9).
In this case, the number of youth is in light green,
Open Data for Improving Youth Policies
125
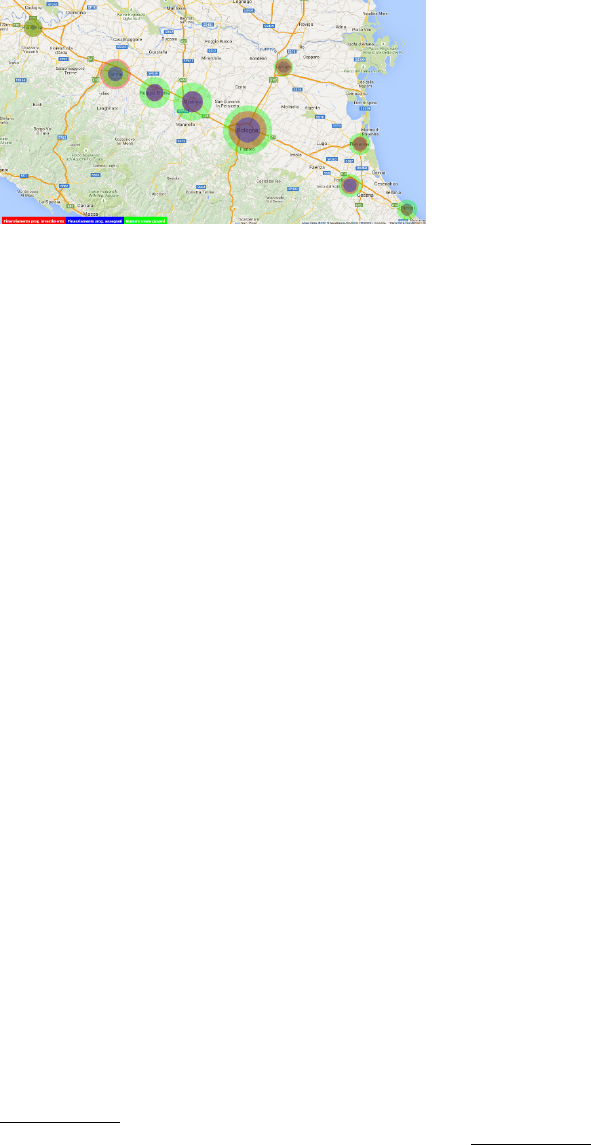
the fundings for the capital spending projects are dis-
played in red and the funding for the current spending
projects in blue. The map can be zoomed in and out.
Figure 9: A map comparing fundings and youth population.
Finally, it is possible to show over the time
how many fundings were provided in one or more
provinces in the years, and compare them to the num-
ber of youth.
For example, Figure 6 shows for the province of
Piacenza in the period 2006-2014 in light green the
number of youth resident, in dark green the founding
for capital spending projects (that were provided only
in 2012 and 2014), and in red the founding for the
current spending projects.
The fundings for projects are assigned on different
areas: education, culture, free time, etc. The politi-
cians were interested to see how the fundings were
distributed in the different areas. Thus, we devised a
pie chart that is activated when the user selects a sin-
gle province and a single year, that shows the funding
provided divided per area. Figure 7 shows the areas
that have been funded for the province of Modena on
2009.
Another question that later was arisen is: “How
many youth from each province visits the website
informagiovani.it compared to the number of resi-
dents?”.
Using statistical data from Google Analytics that
was provided by the region, we were able to create
the line chart showed in Figure 11. This chart reports,
for the 2013 year, the number of accesses from each
province in green, and the number of youth residents
in red. As it can be noted, the number of accesses
is really low compared to the number of youth, so
maybe it is possible to conclude that a more inten-
sive advertisement might increment the visits of the
website.
For comparison purposes, we evaluate Tableau
20
and Qlik
21
(cited as a leaders in the Gartner’s Magic
Quadrant for Business Intelligence and Analytics
20
http://www.tableau.com
21
http://www.qlik.com
Platforms (Sallam et al., 2015)). The Tableau Desk-
top, i.e. the tool to produce visualizations, is very in-
tuitive and the creation of new charts is very quick.
The same effectiveness appears in the Tableau reader,
i.e. the tool for anyone that consumes the visualiza-
tions. Instead, the Qlik platform requires more initial
knowledge to design the first chart.
Tableau shows to the user different tabs that con-
tain one or more charts. In each tab, some filters
that allow the user to change the data represented in
the charts can be defined. The mode of operation of
Tableau is opposite to the MOMIS dashboard. In the
MOMIS Dashboard, each tab contains only one chart,
and the charts are activated after the filters setting (e.g.
the selection of more than one year enables the line
chart).
Both Tableau and Qlik are able to generate the
same charts as the one available in the MOMIS dash-
board. In the scenario of our application, we observed
some limitations of the tools: the maps in Tableau can
not show more bubbles representing more measures
(differently from the MOMIS Dashboard see Figure
9); the pie chart can be generated on a single mea-
sure, thus the one in Figure 7 can not be generated
with Tabluea or Qlik; the line charts can not contain
series belonging to different dimensions (in this case,
the charts are rendered separately, as shown in Figure
10).
6 LINKED OPEN DATA
PUBLICATION AND
EXPLORATION
In the following, we describe the step by step LOD
publication and exploration process.
1. Select which portion of data to publish
2. Publish the dataset as Linked Open Data using
D2R Server and map the database schema to RDF
using the D2RQ Mapping Language.
3. Explore and query the dataset using the LODeX
tool.
Source Selection - The global view containing all
the integrated data (GS-Global), as well as, each of
the local sources have been selected for publication
as LOD.
Linked Open Data Publication - We used the
D2RQ Platform
22
for publishing the dataset in RDF.
The tool allows to access relational databases as
virtual, read-only RDF graphs, therefore it avoids the
replication of information into an RDF store.
22
http://d2rq.org
KEOD 2015 - 7th International Conference on Knowledge Engineering and Ontology Development
126
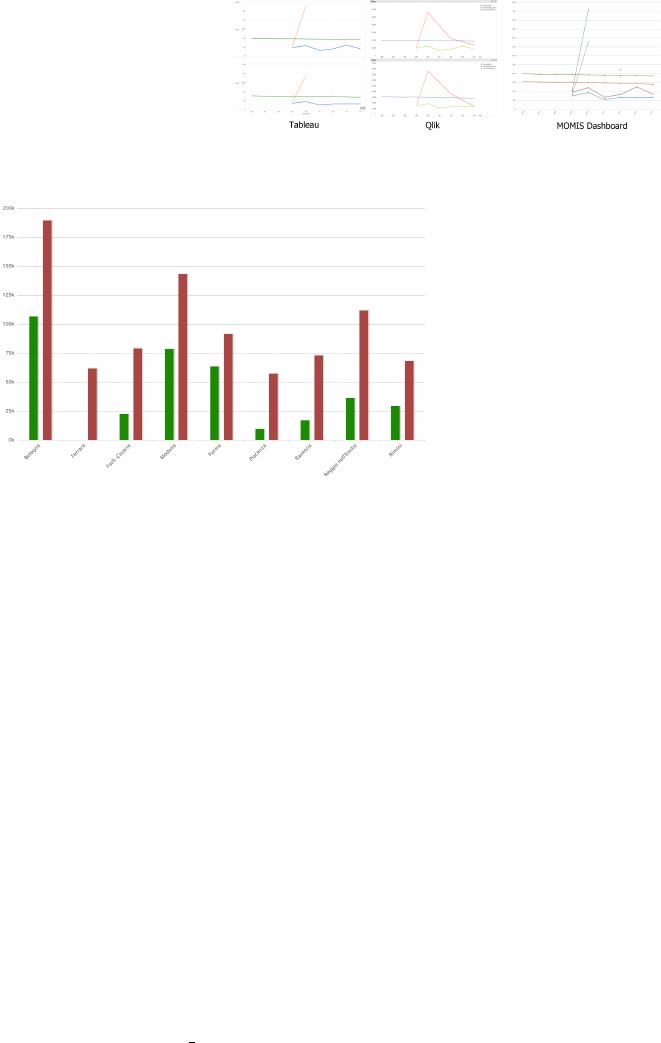
Figure 10: A comparison of line charts generated with different tools: Tableau, Qlik, MOMIS Dashboard. The charts show
the current spending projects, capital spending projects and the number of youth residents in each province during the years.
Figure 11: Number of accesses at the informagiovani.it
website (green) compared to the number of youth residents
(red) in each province.
D2RQ provides a SPARQL access to the content
of the database as Linked Data over the Web, and sev-
eral other opportunities like RDF dumps, API calls,
HTML views.
The declarative D2RQ mapping language is used
to define a set of mappings between the database
schema and the RDFS vocabulary or OWL ontology.
Another key aspect in publication of LOD is the
identification of vocabularies that can be used to de-
scribe the dataset. In our case, we recognized two
potential vocabularies: GeoNames and DBpedia.
An example of D2RQ mapping to an external vo-
cabulary is reported below:
map:Statistics_anno a d2rq:PropertyBridge;
d2rq:belongsToClassMap map:Statistics;
d2rq:property dbpedia-owl:Year;
d2rq:propertyDefinitionLabel "anno";
d2rq:column "gs_totale.anno";
d2rq:datatype xsd:integer;
.
Here the column gs totale.anno is mapped to the
property dbpedia-owl:Year;.
We also use of the D2RQ mappings to link in-
stances of the global view (GS-Global) with instances
of the local sources, as in the following example.
map:Statistics_informagiovani
a d2rq:PropertyBridge;
d2rq:belongsToClassMap map:Statistics;
d2rq:property vocab:Informagiovani;
d2rq:refersToClassMap map:Informagiovani;
d2rq:join "gs_totale.provincia =
informagiovani.provincia";
d2rq:join "gs_totale.anno =
informagiovani.anno";
.
A specific procedure is needed to connect the in-
stances of our source with instances of other sources
in the LOD cloud.
In this case, we wanted to add geographical infor-
mation to our dataset, thus we linked to the Emilia Ro-
magnas provinces defined in DBpedia and in GeoN-
ames.
We have created a table (see figure 13) contain-
ing references to instances of external sources and we
have included this table in our dataset.
By using these data, each time we refer to a
province in this table, we link the instance to the spe-
cific province in DBpedia and in GeoNames.
LOD Exploration and Querying - Once the
dataset is selected and the mappings defined, D2RQ
automatically creates a SPARQL access to the LOD
source. By using tools such as LODeX(Benedetti
et al., 2014a)(Benedetti et al., 2014b) for browsing
and querying a LOD source, we can explore a graph-
ical representation of the source and exploit a conve-
nient visual query panel to extract information from
the dataset. The user can take advantage of the
Schema Summary produced by LODeX that repre-
sents the selected source (classes, properties and other
statistical information) and by picking graphical ele-
ments out of the Schema Summary, he/she can cre-
ate a visual query. The tool also supports the user
in browsing the results and, eventually, refining the
query.
The prototype has been evaluated on the SPARQL
endpoint of the GS-Global and the visualization is
shown in Figure 12 and is available online at http://
dbgroup.unimo.it/lodex2/ok#!/schemaSummary/999.
7 CONCLUSION
We have shown the results gained during the “Open
Linked Data of the youth observatory of the Emilia-
Romagna Region” project .
Open Data for Improving Youth Policies
127
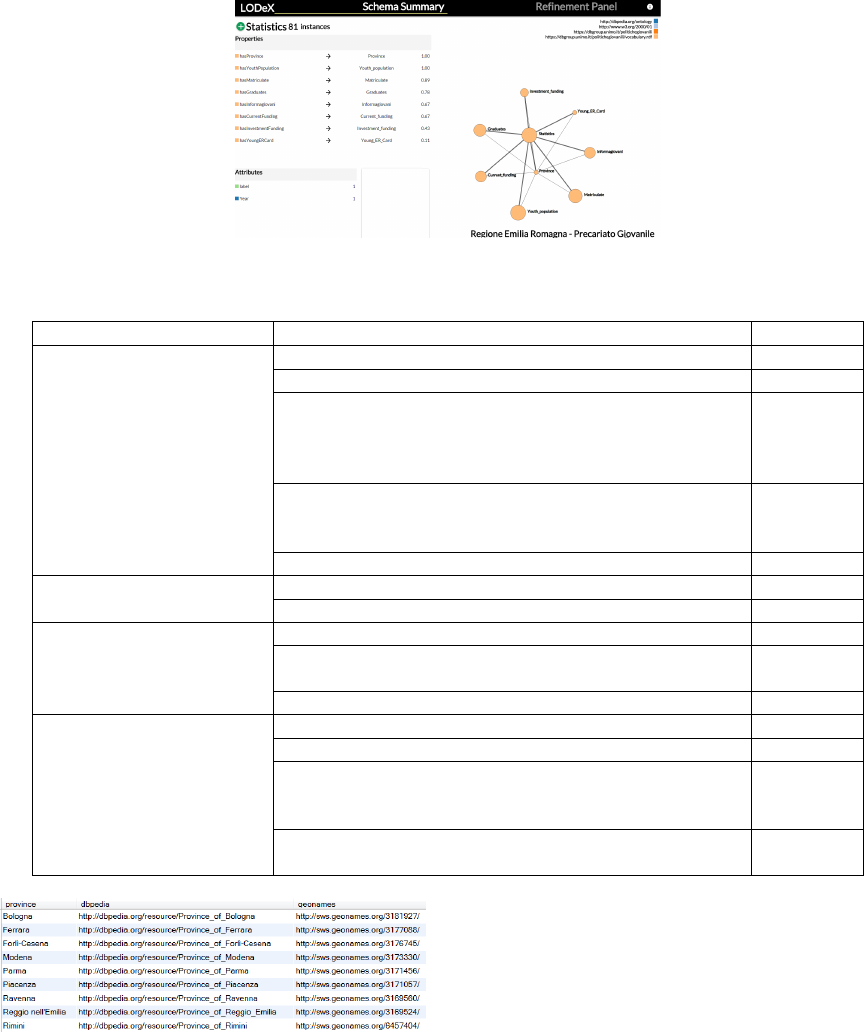
Figure 12: The visualization of the LOD youth policies dataset.
Table 5: Main issues handled during the project and their criticality (expressed through a three star rating).
Phase Operation Criticality
Data selection, extraction
and cleaning
Requirements definition of the datasets to be searched for ***
Discovery of relevant open data sources **
Investigation on how open data sources are structured and
what information they contain (most of the time the open
data sources do not provide a schema nor an high level
view of the data)
***
Discovery of the overlaps among different sources (het-
erogeneity in the format and in the granularity of the
available data might affect this task)
**
Data cleaning **
Data integration
Selection of the dimensions for the integration *
Availability of data in relation to the chosen dimensions **
Data displaying
Deciding of what data to show and to compare **
Selection of the more suitable chart formats to display the
data
**
Selection of filters to be applied on the data **
Linked Open Data publica-
tion and exploration
Build an ontology for describing the data *
Selection of tools to convert data into LOD format **
Choose whether it is convenient to publish data in a static
rdf file or to convert on the fly data located in a relational
database
*
Looking for similar instances in external datasets (e.
Geonames or DBpedia) and building links
**
Figure 13: References to instances of external sources.
This paper has exemplified how a Public Admin-
istrations can benefit from the use of Open Data and
can effectively extract new and important information
by integrating its own datasets with open data sources.
We consider our work can be helpful for future
open government projects aiming to exploit and pub-
lish open data. To outline some guidelines, we iden-
tified some issues as important factors that may seri-
ously affect the entire process of identification, con-
sumption, integration till the publication of open data.
Table 5 summarizes the main problems handled dur-
ing the project and their criticality.
ACKNOWLEDGEMENTS
This project has been realized thanks to the collabora-
tion of the Department of Culture, Youth and Policies
for the Legality of the Emilia Romagna region, the
Municipality of Modena (Italy), and the DBGROUP
of the University of Modena and Reggio Emilia.
We are thankful to Sergio Ansaloni, Paola Fran-
KEOD 2015 - 7th International Conference on Knowledge Engineering and Ontology Development
128
cia, Giulio Guerzoni, Marina Mingozzi, Fabio Poggi,
Antonio Volpone for many fruitful discussions on the
various aspects of integrating and releasing open gov-
ernment data covered in this paper.
REFERENCES
Benedetti, F., Bergamaschi, S., and Po, L. (2014a). On-
line index extraction from linked open data sources.
Linked Data for Information Extraction (LD4IE)
Workshop held at International Semantic Web Confer-
ence.
Benedetti, F., Bergamaschi, S., and Po, L. (2014b). A visual
summary for linked open data sources. International
Semantic Web Conference (Posters & Demos).
Beneventano, D., Bergamaschi, S., Guerra, F., and Vincini,
M. (2003). Synthesizing an integrated ontology. IEEE
Internet Computing, 7(5):42–51.
Bergamaschi, S., Castano, S., Vincini, M., and Beneven-
tano, D. (2001). Semantic integration of hetero-
geneous information sources. Data Knowl. Eng.,
36(3):215–249.
Bizer, C. and Cyganiak, R. (2007). D2rq-lessons learned.
In W3C Workshop on RDF Access to Relational
Databases, page 35.
Miller, G. A., Beckwith, R., Fellbaum, C., Gross, D.,
and Miller, K. (1990). Wordnet: An on-line lexi-
cal database. International Journal of Lexicography,
3:235–244.
Sahoo, S. S., Halb, W., Hellmann, S., Idehen, K., Thi-
bodeau Jr, T., Auer, S., Sequeda, J., and Ezzat, A.
(2009). A survey of current approaches for mapping
of relational databases to rdf. Technical report, W3C
RDB2RDF Incubator Group Report.
Sallam, R. L., Hostmann, B., Schlegel, K., Tapadinhas, J.,
Parenteau, J., and Oestreich, T. W. (2015). Magic
quadrant for business intelligence and analytics plat-
forms. Technical report, Gartner. Gartner Research
Note G00270380.
Tufte, E. R. and Graves-Morris, P. (1983). The visual dis-
play of quantitative information, volume 2. Graphics
press Cheshire, CT.
Open Data for Improving Youth Policies
129
