Designing the Content of a Social e-Learning Dashboard
The Study is based on Novel Key Performance Indicators
Paolo Avogadro, Silvia Calegari and Matteo Dominoni
University of Milano-Bicocca, v.le Sarca 336/14,I-20126, Milano, Italy
Keywords:
Social Learning Management System, KirckPatrick-Philips Model, Key Performance Indicators, Dashboard,
e-Learning Platform.
Abstract:
Scholastic institutions are increasing the use of social learning management systems (Social LMS) to reduce
training costs, provide just-in-time skills instruction and classroom-based training, stimulate social collabora-
tions, etc. In this paper we present a model to assess the use of a Social LMS by learners that could be applied
to learning institutions. At the beginning we adapt the Kirkpatrick-Philips model (widely used in private com-
panies) to the academic environment. Some metrics are also defined for each Kirkpatrick-Philips’s level in
order to evaluate the Social LMS. At the end we introduce modular dashboards to visualize the analytic report
obtained by the social network.
1 INTRODUCTION
The integration of social aspects in a learning environ-
ment can be defined as an exchange of information
and ideas, supplemented by interactions with a per-
sonal or professional network of users. A social learn-
ing program must provide users with immediate ac-
cess to relevant content and to seasoned experts who
can impart their wisdom (Kautz et al., 1997; Sakarya
et al., 2012; R¨ossling et al., 2008). ICT social technol-
ogy, for example, renders collaboration very natural.
The core components of this technology are: social
networks, wikis, chat rooms, forums, blogs, expert di-
rectories and expertize location, content libraries with
content ranked for relevance, shared communities of
interest, online coaching and mentoring, etc. By the
addition of the gamification element, players can also
develop and test their skills and learn complex sub-
jects involving multiple roles and relationships. In
the last decade, the goal of many researchers has been
to define a Social LMS (Learning Management Sys-
tem) in order to built a complete “learning environ-
ment” that provides a support network, as well as
the ability to collaborate, and share information to
solve problems. In addition, in the modern world
learning organizations (e.g, schools and academies)
must go beyond the disciplines of building content
for use in the classroom or online. They must pro-
vide context and pathways through which people can
learn but also improve as learners and become bet-
ter creators of content. For this reason, social learn-
ing environments have to comprise both formal and
informal learning elements in an augmented vision
of the blended learning paradigm (Osguthorpe and
Graham, 2003). While most formal training can be
done in classes or in isolation, social learning systems
may offer the ability to develop learning communities
in which groups of learners and trainers share infor-
mation and collaborate on their learning experience.
Thus, a Social LMS integrates social networking, col-
laboration and knowledge sharing capabilities, as well
as interactive elements that enable users to rate con-
tents. In this paper, we propose a model for social net-
work learning which is based on the idea that the act
of learning should be an organic process comprising
many subjects (students, teachers, specialists, fami-
lies, etc.). The students remain the most important
subjects of the e-learning environment since their de-
velopment is the final goal of the school, however the
interplay with the other subjects cannot be underes-
timated since a static world where only the students
evolve while the school or the families do not change
is clearly unrealistic. For a better insight of the pro-
cess, all the subjects need analytical tools providing
important information and automatic analysis (Buck-
ingham Shum and Ferguson, 2012; Almosallam and
Ouertani, 2014; Siemens and Baker, 2012). The infor-
mation provided is not to be intended as a replacement
of the specific capabilities of the teachers, specialists
etc. At the contrary, it is thought as an additional tool
Avogadro, P., Calegari, S. and Dominoni, M..
Designing the Content of a Social e-Learning Dashboard - The Study is based on Novel Key Performance Indicators.
In Proceedings of the 7th International Joint Conference on Knowledge Discovery, Knowledge Engineering and Knowledge Management (IC3K 2015) - Volume 3: KMIS, pages 79-89
ISBN: 978-989-758-158-8
Copyright
c
2015 by SCITEPRESS – Science and Technology Publications, Lda. All rights reserved
79
for these subjects which allows them to have a good
understanding of the success or failure of their ini-
tiatives. With this information they are able to adopt
measures which can improve the quality of the learn-
ing process. The platform must also include metrics
which demonstrate real value for the learning organi-
zation.
Learning management systems are designed to
measure the performance of a learner on assessments,
but they are less efficient at measuring the effective-
ness of content (Buckingham Shum and Ferguson,
2012; Nespereira et al., 2014). Since social learn-
ing is dependent on content generated from a variety
of sources, a good social learning solution can mea-
sure who are the most reliable content providers and
which content is not being accessed at all. As a result
one can prioritize what is most effective. The goal is
to connect users using social tools to accelerate learn-
ing.
The standard Kirkpatrick-Philips model, which is
used as a benchmark for learning assessment in orga-
nizations, can be also adopted for a Social LMS with
a different look. The Kirkpatrick-Philips model is de-
fined by 5 levels that are: Reaction, Learning, Behav-
ior, Results, and ROI. In this paper, novel key perfor-
mance indicators for each Kirkpatrick-Philips’s level
are defined in order to evaluate the student’s academic
improvements through the Social LMS. It is impor-
tant to take into account that each role is in need of
different information in order to improve. A general
model of interactions among these subjects is beyond
the scope of this paper and pertains more to the so-
cial studies, however we want to provide tools which
help to give quantitative assessments. At the moment,
this paper focuses the work on students, but we are
planning to extend our model on the other subjects.
The paper is organized as follows. Section 2
presents the revised Kirckpatrick-Philips models for
Social LMS, Section 3 defines the metrics for each
new Kirckpatrick-Philips’s level, Section 4 introduces
how the metrics can be applied to the forum and chat
room social components, Section 5 gives an insight
on how a dashboard for students can be defined that
considers the new metrics. Finally, in Section 6 some
conclusions and future works are stated.
2 THE KIRCKPATRICK-PHILIPS
MODEL FOR A SOCIAL LMS
The classic Kirkpatrick-Philips model (KP) (New-
strom, 1995; Phillips and Phillips, 2003; Kirkpatrick
and Kirkpatrick, 2010) is widely used to evaluate the
quality of a training for companies as a benchmark
for learning assessment (Tour et al., 2014). Accord-
ing to the KP there are 5 levels which are used to eval-
uate the whole learning process: Reaction, Learning,
Behavior, Results and Return on Investment (ROI),
respectively. Summarizing, Reaction is an indicator
which allows to understand how the training was re-
ceived by the participants. It deals with impressions
and tastes regarding the participants - Did they like
it? How was the environment? Was the content rele-
vant? Although a positive reaction does not guarantee
learning, a negative reaction almost certainly reduces
its possibility. Learning refers to the idea of assess-
ing how much of the information which was presented
has been understood and retained by the participants
of the training. If possible, participants take the test
or assessment before the training (pretest) and after
training (post test) to determine the amount of learn-
ing that has occurred. In a company, however, the
quality of the work after a training is expected to be
better than before, this quantity is measured in the Be-
havior level. The evaluation issue, at this level, at-
tempts to answer questions such as - Are the newly
acquired skills, knowledge, or attitude being used in
the everyday environment of the learner? How did
the performance change due to the training provided?
For many trainers this level represents the best assess-
ment of a program’s effectiveness. It is difficult to
find a correct metric to measure the Behavior and its
time evolution in a company, while in a school the
time line is more strict and this can help. A final as-
sessment on the training comprising all the parts just
mentioned is necessary, in the KP model this is usu-
ally referred to as Results. Good results are achieved
if some indicators are improved in the organization
such as the increased efficiency, decreased costs, in-
crease revenue, improved quality, etc. The ROI in-
dicator clarifies if the training was beneficial to the
company once its cost is taken into account, with the
objective that the effect should be worth the cost. Are
we achieving a reasonable return on investment? The
ROI formula (Phillips and Phillips, 2003) is calcu-
lated as ROI = (Benefit −Cost)/Cost∗ 100.
Companies use the KP model to assess the invest-
ment in organizational learning and development al-
though from the literature it emerges a clear difficulty
in measuring with suited metrics the 5 levels just de-
scribed. It is rarely possible to have data that allow to
measure the effectiveness of each level by considering
the evaluations of the tangible and intangible benefits
in relation with the results of the investment as de-
scribed in Section 1. Due to these problems, in (Tour
et al., 2014) a complementary approach for enterprise
training program management is proposed with the
intent to overcome the barriers that companies can
KMIS 2015 - 7th International Conference on Knowledge Management and Information Sharing
80
have when adopting the KP model, that are: (1) iso-
lation of the participant as a factor that has impact on
corporate results, (2) lack of standard metrics within
the adopted LMS, and (3) lack of standardized data to
have benchmark to compare the defined training func-
tions.
The difficulty in adopting the KP model is that the
information from each prior level paves the way for
the evaluation of the next level. Thus, each successive
level represents a more precise measure of the effec-
tiveness of the training program, but at the same time
requires a more rigorous and time-consuming analy-
sis. The idea is to determine which metric is more ap-
propriate to understand whether the network of learn-
ers is performing well and whether the service sup-
plied by the platform is useful for the network. The
usage of the platform is a straightforward value which
allows to understand the reception of the platform it-
self.
In this paper, we want to translate the KP model
to a scholastic environment as such some modifica-
tions are needed because of the different purposes and
means between a school and a company. For a com-
pany the aim of an internal training is to achieve a
monetary/strategic gain, while for schools the overall
growth of the learners is the final goal, and within it
an increased education is of primary importance. In
a social educational environment (as the one provided
by a Social LMS), the KP model is properly suited as
it guarantees the possibility to assess the educational
path of the learner during his/her educative session
for the whole set of levels. In an educational context,
the problems presented in (Tour et al., 2014) could be
overcome: (1) the social learning creates community
discussions forums and group-based project work en-
courage collaboration by reducing the learner’s isola-
tion, (2) for learners: tangible values are achieved by
considering standard grades, intangible values are ob-
tained, for example, by monitoring the learner’s ac-
tivities in the Social LMS as explained in Section 3
and in Section 4, and (3) the data quality can be eval-
uated with standard evaluation metrics by teachers
(e.g., tests, grades, ...), and social evaluation metrics
by peers (e.g., social grades on materials, comments,
liking, .. . ).
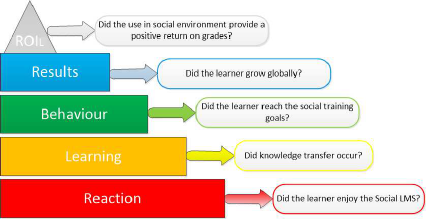
The novel interpretation of the KP model for the
educational context is defined as follows (see Figure
1):
• The Reaction: “Did the learner enjoy the So-
cial LMS?” The learner’s satisfaction can be an-
alyzed by two main techniques: explicit and im-
plicit (Claypool et al., 2001; Teevan et al., 2005).
With the explicit approach the user must explic-
itly specify his/her preferences to the system. This
Figure 1: The Kirkpatrick-Phillips model for a Social LMS.
can be achieved by filling in questionnaires and/or
by providing short textual descriptions in order to
specify the topics of interests. With the implicit
approach, the user’s preferences are automatically
gathered by monitoring the user’s actions. To this
regard, the defined techniques range from click-
through data analysis to query and log analysis,
sentiment analysis, etc. We prefer to use an im-
plicit approach, where it would be possible to es-
timate the actual activity of an engaged learner,
and use that as a target.
• Learning: “Did knowledge transfer occur?”
Learning refers to the idea of assessing how much
of the information which was presented has been
understood and retained by the learners of the
training. In a Social LMS for educational con-
text, a formal assessment can be defined by the
teacher’s judgment or by official tests before and
after the use of the system by analyzing if an im-
provement of the academic performance of the
student is occurred; an informal assessment can
be obtained by analyzing how peers and teach-
ers have evaluated the learner’s materials such as
new multimedia documents added in the Social
LMS, comments on specific subjects, messages
from chat and forum, etc.
• Behavior: “Did the learner reach the social train-
ing goals?” Nowadays most of the schools have
personalized learning programs, thus the per-
centage of completion of these programs can be
thought as a measure of how the previous knowl-
edge has changed the student’s knowledge allow-
ing her/him to take further steps forward. The
gamification of the learning programs is an im-
portant aspect which helps to keep interest in the
objectives.
The learner’s attitude can be measured by spe-
cific behavior indicators: are learners increasing
the creation and sharing of knowledge such as an-
swers, documents, media, or interactive? The us-
age of collaborative tools, the new products pro-
duced, or less desirably, the circulation of updated
Designing the Content of a Social e-Learning Dashboard - The Study is based on Novel Key Performance Indicators
81
versions of materials for subjects would be met-
rics.
• Results: “Did the learner grow globally?” This
level includes in a global statement if the learner’s
has improved his/her academic performance dur-
ing the usage of the Social LMS. The data ob-
tained from the indicators considered in the pre-
vious levels are gathered, elaborated, and then vi-
sualized in customized dashboards. The learning
analytic uses data analysis to inform the progress
related to teaching and learning. The global eval-
uation is a mush-up of data collected ranging from
formal evaluations (e.g., tests, grades, etc.) to in-
formal evaluations (e.g., social evaluations, judg-
ment of peers, etc.). The heterogeneous types of
data available allow to support more adaptive and
personalized forms of learning enabling enhanced
student performance.
• ROI: “Did the use in social environment provide
a positive return on grades?” In an educational
context, we define the ROI
L
in order to evalu-
ate whether the effort in the social interaction re-
ally affects also the scholastic performance of a
learner, L. Is it true that a better social activity has
returned better grades? Then, the ROI
L
is calcu-
lated as:
ROI
L
=
∆G
L
∆A
L
where G
L
is the average final grades (i.e., formal
proofs, tests, etc.) and A
L
is the key performance
indicator that analyses the learner’s activity from
the Results level, while the ∆ implies that we are
using a temporal difference between the current
values and the old values previously calculated.
This time quantity is needed to ensure that the ef-
fect of an increased social activity can affect also
the grades of the student for a given interval (e.g.,
weekly, monthly, bimonthly, etc.).
3 DEFINITION OF KPI FOR
SOCIAL LMS
The failure or success of a student is determined by
many factors. In the present paragraph we want to
analyze key performance indicators which take into
account various aspects of the student life associated
with the levels of the KP model presented in Section
2. The students grades are an obvious starting point,
in particular at the end of the academic year the aver-
age grade provides a good insight about the student
quality. However grades do not provide the infor-
mation regarding the general development of the stu-
dent. For example, social skills prove to be essential
in modern life; for this reason we want make quantita-
tive and qualitative assessments on them. The sources
which provide the data needed for the indicators are
the following:
• The “normal” student information (grades, ab-
sences, etc.) usually collected by the teachers, and
in this case in digital format.
• The data inserted by the students in the social net-
work (forum, chat, evaluations, comments...).
• Feedback from teachers, special instructors, fam-
ilies ...
• The multimedia material uploaded by teachers
and students (for formal and informal learning).
There are many aspects which are important for de-
termining the growth of a student and it is beyond the
scope of this paper to take all of them into account.
Since this study is devoted to social e-learning we will
concentrate on criteria dealing with the learning and
social parts of the platform. In particular, the novelty
of this paper is to try to combine the social aspect of
modern technology and learning.
The integration of social aspects in an educational
learning environment can be defined as an exchange
of information and ideas, supplemented by interac-
tions with a personal or professional network of stu-
dents. An educational social network (i.e., EduSN) is
then created in a natural way by analyzing the interac-
tions of students. The EduSN’s effectiveness can be
measured by adopting the revised KP model of Sec-
tion 2 by providing metrics for each level as reported
in this section.
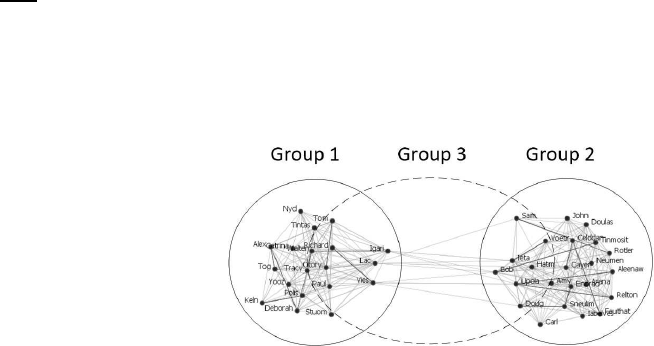
Figure 2: An example of an EduSN.
A prime model of an EduSN is given by a graph
where users are vertexes and the links among them are
the edges. In this case, we choose to restrict the net-
work to the students; in future works, we plan to cre-
ate more complex networks including teachers, par-
ents, etc. In order to represent the network we need
to establish how the students are connected. Group-
ing all the students of the same class is a simple idea
which does not take into account all the possible sce-
nario. Groups of students can be defined according
KMIS 2015 - 7th International Conference on Knowledge Management and Information Sharing
82
to several factors: classes, sharing of a same subject,
organization of flipped classrooms across classes or
institutions, sharing of a same scholastic interest, etc.
For this reason, the concept of learning groups might
be more appropriate than classes, so the definition of
the network must be flexible. The network that we
propose is an undirected graph where the edges con-
vey the strength of the relationship between two stu-
dents. With this model the visual representation of the
graph can give insight about the compactness of the
network itself. Figure 2 shows a portion of an EduSN
where three groups are defined: (1) Group 1 identifies
a class of 19 students, (2) Group 2 identifies a class
of 23 students, and (3) Group 3 identifies a virtual
class of 18 students defined by social interactions on
the same topic. Formally, EduSN is the union of non-
disjoint groups defined as EduSN =
S
g
i
G
i
, where:
• G
i
= (V,L) is a group and g is the total number of
groups presented in EduSN;
• V is a set of nodes, representing the students S;
• L is a set of links (or edges) between nodes in V.
Finally, we can define the metrics for each KP’s level
as follows:
Reaction. As indicated in Section 2, explicit and
implicit methods can be used to establish the level of
student’s satisfaction in the usage of the Social LMS.
At this level, we consider an implicit approach assum-
ing that the usage of the Social LMS is related to the
acceptance of the LMS. We define a quantity, called
connection, which is a function of two students, and
it represents the strength of the social bond between
two students in a given day. At this level, we are not
interested in the quality of the bond, but only to the
amount of information in the academic time course.
Learning. The student’s academic performance is
evaluated according to formal and informal meth-
ods. The formal approach considers the standard
evaluation obtained by grades (i.e., proof, tests, etc.),
whereas the informal one considers social aspects
based on the student’s social behavior when she/he
uses the Social LMS. In this last case, we define the
social contribution indicator - which gives an idea of
how the other participants of the network judge the
interactions of the student with the social educational
network. The social contribution of a student has to
take into account two measures: appropriateness, and
quality of the material added (by material, we also
take into account the posts on the forum and on the
chat room). Formally, the social contribution mea-
sure is defined by:
• Appropriateness: each material can be rated with
four different levels of appropriateness (material
which has no appropriateness rating counts as ap-
propriate since we expect that normal material
does not trigger the need for an appropriateness
rating). For example, posting the timetables of
the movie theater on the math forum would be
considered inappropriate, while asking a clarifi-
cation of a theorem would be appropriate. Highly
inappropriate material adds -3 point to the appro-
priateness score of the student who posted it and
also to the material itself (in such a way the teach-
ers can easily ban particularly inappropriate ma-
terial), inappropriate adds -1 points, appropriate
adds 1 point and very appropriate adds 3 points.
The average appropriateness score of a material is
always visible to the other users in order to allow
the instructors to ban any material which should
not be visible.
• Quality: The quality of all the material published
is divided in four different levels:
– the material adds wrong content (-1 points)
– the material adds no content to the discussion
(for example if the material contains only in-
formation already present in the discussion) (0
points)
– the material adds some content (a good ques-
tion is also associated to this category) (1 point)
– the material provides a complete answer to a
problem (3 points)
At every point, the sum of all the points deriving by
the appropriateness and the quality indicators of the
published material is calculated. The appropriateness
value and the quality value are transformed in a per-
centage by taking into account the best score of the
school. The material is judged by peers (other stu-
dents) and by teachers. Since we expect the ratings
from the teachers to be more experienced than the
ones of the students, teacher’s rating will weigh three
times more than that of the students.
For each learner L, to associate an overall score
with the social contribution measure, SC
L
, a linear
combination of its two indicators is finally applied:
SC
L
= α∗ App
L
+ (1− α) ∗ Q
L
(1)
where 0 ≤ α ≤ 1. When α has a value of 0, the ap-
propriateness value, App
L
, is not considered, and the
final weight is equivalent to the weight obtained by
analyzing the quality value, Q
L
. If α has a value of 1,
the quality value is ignored and only the appropriate-
ness value is considered. The importance of appro-
priateness value with respect to quality value can be
balanced by varying the value of parameter α.
Designing the Content of a Social e-Learning Dashboard - The Study is based on Novel Key Performance Indicators
83

Behavior. At this phase (see Section 2 for more
details), we take into account how the learner’s at-
titude can be measured by specific indicators: are
learners increasing the creation and sharing of knowl-
edge (such as answers, documents, media, or inter-
active)? The attitude level is measured by analyzing
the topological structure of EduSN, and by consid-
ering the informal success indicator. In the former
case, once the EduSN graph is established we can
calculate various centrality measures which allow to
determine, for example, who are the reference stu-
dents, who tend to connect participants, etc.; here, we
will focus on the betweenness centrality since it per-
fectly reflects the social feature of the Social LMS. In
the last case, informal success is associated with the
awards attributed to: (1) the student about all the in-
formal activities he/she was involved in, and (2) the
achievements by a gamification approach to track the
progresses of the student’s academic path. In the for-
mer case, the idea is to also consider extra educational
activities that are an indicator on how a student is so-
cially active in the school; for example, a student can
be a member of the: scholastic journal, soccer school
team, etc.
Results. The two KPI we use to determine the stu-
dent’s final result are: (1) the average final grade ob-
tained during the academic year to assess the formal
performance for each subject (e.g., math, history, sci-
ence, etc.), and (2) the influence factor. The influence
factor represents the student’s influence by consider-
ing his/her interactions with the EduSN’s participants,
his/her ability to drive discussions, to share materials,
to attend to extra activities, etc. The more influen-
tial you are, the higher your influence factor is. The
influence factor is a quantity we determine as the ag-
gregation of three indicators previously described:
• betweenness centrality - which is a measure of the
activity of the person in the network
• informal success - which takes into account how
active a person is in the informal context
• social contribution - which gives an idea of how
the other people of the network judge the interac-
tion of the person with the social network.
Since these quantities are measured with different in-
dicators, we first transform them in percentages, and
then we calculate the average value for having the in-
fluence factor in percentage. In an environment with
a large population we expect to have learners who ex-
cel in all of the three indicators whose scores can be
used to calculate percentages.
• Betweenness. We first group the scores of all
the students of a school in a list and we find the
highest value. At this point we can re-evaluate
the score of each learner as a percentage of the
best result. Let us consider an example for the
betweenness case, in a school where the highest
value of betweenness is 0.88, a student has a be-
tweenness equal to 0.72; this value is transformed
into 82% = 0.72/0.88 × 100.
• Informal Success. It is associated with the awards
attributed to the the student about all the informal
activities he/she was involved in. By associating a
number to each activity (for example 50 points for
being part of the soccer team who arrived second
in the school tournament, etc.) each person will
obtain a total number of points. Also in this case
we can make an ordered list of results, where the
percentage score of a single student is given by
the ratio of his/her result and the best one (times
100).
• Social Contribution. Its value is transformed in
percentage in the standard way (see Equation 1).
Then, the influence factor, IF, is calculated as the av-
erage value of betweenness, informal success and so-
cial contribution.
ROI. The ROI value is calculated, as defined in Sec-
tion 2, ROI
L
=
∆G
L
∆A
L
, where G
L
is the average final
grades (i.e., formal proofs, tests, etc.), and A
L
is the
influence factor. However, it is possible to calculate a
ROI value for each subject by analyzing its own aver-
age grade.
4 EVALUATING FORUM AND
CHAT
In this section, we analyze how the metrics defined in
Section 3 can be used to assess the use of social mod-
ules on the Social LMS. In detail, we describe how
can be formally analyzed the role of the forum and
the role of the chat room when the EduSN’s partici-
pants are interacting with them. In a Social LMS, chat
room and forum play a key role, and they are some of
the social modules most accessed by students. The
idea is thus to inter-correlate the social aspect and the
academic success by exploiting the natural tendency
of human beings (and in particular of students) to be
connected. Forum and chat room are different so-
cial elements: the forum is expected to be divided in
topics to deepen the study subjects, whereas the chat
room is intended as a more free space where infor-
mal topics can be discussed (such as sports, movies,
vacations, etc.).
KMIS 2015 - 7th International Conference on Knowledge Management and Information Sharing
84
Reaction. A connection represents how many inter-
actions between two students occur in a given time.
At the beginning, the connection C is set equal to 0,
i.e., C(a, b;n) = 0, where: a,b ∈ S, n is a time factor
(e.g., a day). In the case of the forum, each time a
person contributes to a conversation, a quantity “f” is
added to all the participants of the conversation. Let
us suppose that a student a ∈ S asks a question about
math on day 0, and a student b ∈ S replies on day 1,
then:
C
F
(a,b;1) = C
F
(a,b;1) + f
While student d ∈ S replies on day 3:
C
F
(a,d;3) = C
F
(a,d;3) + f
C
F
(a,b;3) = C
F
(d,b;3) + f
Since this graph is undirected C
F
(a,b;n) =
C
F
(b,a;n), we also want a simple graph (Butts,
2008), that is C
F
(a,a;n) = 0.
In a school environment there are also informal
interests (friendships, feelings, sports, tournaments,
etc.). These aspects are better represented by the chat
room which does not have the same kind of moder-
ation as the forum, and it allows for more freedom.
Due to the synchronous nature of the chat room there
is no obvious thread which allows to distinguish eas-
ily whether a student is talking to another, so we sug-
gest to adopt a time approach, that is, if two students
write messages in the chat room within a given time
interval (∆t), then we can consider that those stu-
dents are connected (for example because of a com-
mon interest or by personal reasons). At the begin-
ning of each day the chat connection is zero. If a, b
and d write on the chat room within ”∆t” their chat-
connections will be enhanced by a factor “c” (similar
to the case of the forum).
C
C
(a,b;1) = C
C
(a,b;1) + c
C
C
(a,d;1) = C
C
(a,d;1) + c
C
C
(d,b;1) = C
C
(d,b;1) + c
Unfortunately time distance is not a very good form
of correlation (and we plan to use better indicators in
further publications), moreover we have to take into
account that the bond between two people develops
with time. We define a quantity called total forum
(chat) connection which takes into account the his-
tory of connections. The total forum connection is a
function of two students (for all the participants of the
network) and of time, in the following definition we
omit the student dependency for simplicity, and we
keep only the time dependency starting from day 0:
K
F
0
= C
F
(0)
K
F
1
= C
F
(1) + λ
F
C
F
(0)
K
F
2
= C
F
(2) + λ
F
C
F
(1) + λ
2
F
C
F
(0)
...
K
F
n
= C
F
(n) + λ
F
K
F
n−1
In practice the total forum connection is an expo-
nentially weighed average of the connections from a
given day 0. The weights take into account the time
dependency of the interpersonal relationships.
Similarly to the forum, the total chat connection is
defined recursively based on the connection derived
from the chat room as:
K
C
n
= C
C
(n) + λ
C
K
C
n−1
Once we have the “total connection” value among two
students we can define the length of the edge in the
corresponding graph by aggregating forum and chat
room values. The length of the edge between student
a and student b E(a,b) at time n is set to be a the
inverse of the sum of the total forum and total chat
connections, and it is defined as follows:
E(a, b;n) =
1
K
F
n
(a,b) + K
C
n
(a,b)
(2)
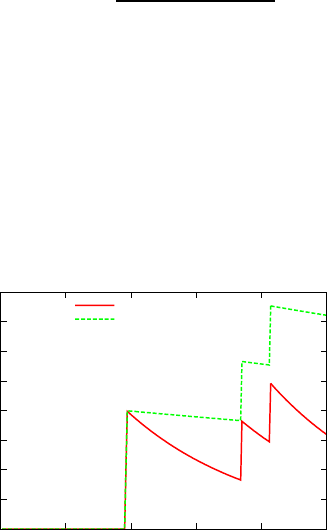
A proper choice of the parameters (λ
F
,λ
C
, f,c) has
to take into account that the connection established
via the forum is less frequent but requires more effort
than the frequent and more casual connections of the
chat room. For this reason the quantity f >> c. The
weights λ
F
and λ
C
give more importance to the most
recent interaction in respect to the old ones, as an ex-
ample we show the connection between two people in
a 200 days period with two different lambda parame-
ters: λ
F
= 0.99 and λ
F
= 0.999 (see Fig. 3).
0
0.5
1
1.5
2
2.5
3
3.5
4
0 50 100 150 200 250
Total Forum Connection
Days
λ
F
=0.99
λ
F
=0.999
Figure 3: Simulated total forum connection according to
different weights.
Designing the Content of a Social e-Learning Dashboard - The Study is based on Novel Key Performance Indicators
85

Learning. The social contribution indicator has to
be used in a different way according to the usage
of forum and/or chat room. The appropriateness is
the metric used to evaluate posts on the chat room,
whereas the quality metric is taken into account to
evaluate the posts on the forum.
In the chat room informal topics can be discussed
(such as sports, movies, vacations, etc.). For exam-
ple posting the timetables of the movie theater on the
math forum would be considered inappropriate, while
asking a clarification of a theorem would be appropri-
ate. In the case of the chat room the moderation is
limited (due to the very nature of this form of com-
munication), and thus more power is given to the stu-
dents themselves. In particular all the people access-
ing the chat room can signal if a material is particu-
larly inappropriate with a red flag which immediately
sends a warning to the teachers who can connect and
change/censor the material, and the value of inappro-
priateness of the poster increases (once a teacher con-
firms the bad quality of the content). A teacher is then
a super-user having the possibility to censor particu-
larly inappropriate content. Instead, the forum is ex-
pected to be divided in topics, and the teacher of the
related subject can judge the quality of the students
added material with the use of specific labels (i.e.,
wrong, neutral, complete, comprehensive). To each
label a point is associated as defined in Section 3. In
case of a wrong post, a teacher can ban the material
in order to guarantee a high quality level of discus-
sions. Peers can also judge the material added in the
forum sessions. In case of a wrong indication, a warn-
ing is automatically sent to a teacher who can ban the
uncorrected material.
Finally, the social contribution value is calculated
by given the following balancing of its two indicators,
i.e., SC
L
= 0.4∗ App
L
+ 0.6∗ Q
L
with α = 0.4. In this
case, a greater importance is given to the quality in-
dicator as the information from the forum are consid-
ered most significant than the ones obtained from the
chat room where the information is only evaluated by
the appropriateness indicator. This difference is given
by the importance of the formal role of a forum with
respect to the informal role of a chat room. In addi-
tion, the posts in a forum are less frequent than the
ones of a chat room: a different score can reduce the
possibility or overestimate the quantity of interactions
obtained by the use of the chat room.
Behavior. Once the EduSN’s graph is established
we can calculate various centrality measures such
(e.g., the betweenness as described in Section 3)
which allow to determine for example who are the
reference students, who tend to connect people, etc.
A non-secondary aspect of the graph representation is
that we can have an idea of how a compact a group
is. For example a graph where students share a lot
of edges and these edges are short is expected to tell
us that strong relationships have been established in
the group. Collaboration is thus expected to be more
present than in a group with looser bonds; this in turn
has an impact on social learning (Bandura, 1963). A
measure of this quantity is the sum of all the total con-
nections between the students of a group, divided by
the number of students of the group.
comp =
1
(
∑
i∈group
)
∑
i< j∈group
K
F
n
(i, j) + K
C
n
(i, j)
(3)
A similar quantity can be obtained for the single
student, but in this case it is enough to sum the total
connections of a student to his/her ”alters“ (we will
refer to this quantity as the single compactness). We
emphasize that with this approach the graph associ-
ated to social network is based solely on the amount
of interactions without taking into account its quality.
Results. For each student, the forum and chat room
are overall evaluated by the influence score indicator
that is calculated as the average values of: (1) the sin-
gle compactness value (see Equation 3, and (2) the so-
cial contribution value as calculated in the Learning
level. At the moment, the informal success indicator
for the chat room module, is not analyzed as a seman-
tic approach has to be considered in order to under-
stand if posts of the chat room are related to topics on
extra activities such as sports, theater, etc.
ROI. The ROI is then calculated as defined in Sec-
tion 3 by subsuming to have the average final grades
of the student’s academic performance.
5 DASHBOARD
A dashboard representation is used to control the sta-
tus of a learning process over a series of reports since
the former has a strong visual and descriptive impact.
Furthermore, evaluations have shown the importance
of a dashboard when it is used by learners to get in-
sight about their performances (Santos et al., 2012;
Corrin and de Barba, 2015). Within a dashboard one
can group a series of analytic tools in a single page
and obtain a general overview of the desired study
case (Santos et al., 2012). As described in (Verbert
et al., 2014), learning dashboards are classified into
three basic classes that are: (1) dashboards to support
the traditional face-to-face lectures, (2) dashboards to
KMIS 2015 - 7th International Conference on Knowledge Management and Information Sharing
86
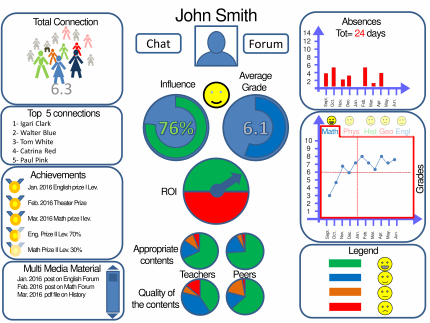
Figure 4: Student’s dashboard.
support face-to-face group work and classroom or-
chestration, and (3) dashboards to support blended or
online-learning settings. Our work refers to learning
dashboard classified in the third group.
For a correct interpretation of the information of
a dashboard, both a synchronous and a diachronous
approach should be considered. In detail, how a KPI
performs in respect with the others at a given time
is a synchronous approach to understanding informa-
tion. Let us consider a case of a student who has
good grades in English. Is this student also a good
communicator (i.e., he/she also has a very good so-
cial network) or not? In the former case, it means
that good language skills are not only confined to the
academic environment but also to the “real world”,
while sometimes people do not develop good inter-
disciplinary abilities.
One has to take into account that within a dash-
board representation not only the time evolution of
the indicators is automatically updated but it is one
of its most important aspects. A diachronous ap-
proach to informationallows a person accessing to the
dashboard to grasp a more deep understanding of in-
formation. Knowing that student’s grades are at the
minimum sufficient level in a subject does not tell us
whether this person is doing a good job by improving
form very low grades or is in a difficult period drop-
ping from very high performances.
The dashboard of this project is to be thought as
modular. This means that we can associate to each
different KPI a different module which can be in-
terfaced with the dashboard. This approach allows
for great flexibility. In fact, the data representation
has to take into account the background of each per-
son accessing it and a modular approach to the dash-
board allows for simple re-ordination of the data in
this sense. Students and teachers require many KPIs,
some of them are common and some of them are dif-
ferent leading to dashboards differences. For exam-
ple, the graph representation of the social network is
more important for the teachers, who need to under-
stand better the connections within groups. By using
this graph it is immediate to have an idea of how the
students are active on the network, if there are sub-
groups and how the groups are compact. This tool is
fundamental since it gives to the instructor a global
overview which is sometimes difficult without quan-
titative evaluations. On the other hand, providing the
same tool to students might lead to unnecessary com-
petition and unnatural modification of the network it-
self. The students’ dashboard is thought to give a gen-
eral overview to the student about his/her current sta-
tus of achievements. We will focus on it in Figure 4 as
an example. At the center of the dashboard there are
two main indicators (see Section 3), that are the influ-
ence factor and the average grade. The smiley, which
can have 4 possible results, gives a general idea of
the student status. At the top center of the dashboard
there is a picture of the student and his name, at its
sides there are two buttons, one to access to the chat
room and one to access to the forum. The absence
days (divided by month and total) are reported at the
top right of the dashboard. Right below it there is the
indicator of the grades, where a label can be clicked
to access each single subject. Multiple labels can be
clicked (unclicked) at the same time in order to have
comparative overview on subjects over time. On top
of the subject name there is a smiley which reports
how the student likes the subject, which can been ob-
tained, for example, with a sentiment analysis of the
comments of the students on the forum and chat room.
At the bottom center there are the degrees of appropri-
ateness and quality of the material posted by the stu-
dent on the social network, these include the posts on
the forum, the multimedia material attached, the com-
ments on the chat.The assessments are divided by the
students (peers) and teachers. At the top left of the
dashboard there is in indicator of the total connec-
tion (see Section 3), this indicator is a box containing
many small images of people and the actual value of
total connection. The number of people not shaded
increases proportionally with the value of the connec-
tion. Below the indicator of the total connection there
is the list of the top 5 connection people. Below the
top 5 connections there are the medals which include
both formal and informal activities. These awards are
assigned by the teachers. At the very bottom left we
list the material published by the student and by click-
ing over it the student can access it and its ratings.
Although the dashboard here introduced is not yet
functional it is a guideline for the implementation
phase. The prototype aspect is a crucial preliminary
Designing the Content of a Social e-Learning Dashboard - The Study is based on Novel Key Performance Indicators
87
step in user interface design to obtain an immedi-
ate feedback with the goal to minimize costs in the
software development (Santos et al., 2012). This has
to take into account that our goal is to create inter-
faceable modules which allow to personalize the final
dashboards according to the relevantneeds of the con-
sidered LMS. In this respect our proposal is centered
around the modules rather than a single instance of
dashboard.
6 CONCLUSIONS
In this paper, we have introduced the structure of a
platform for social e-learning. This model is a mod-
ified version of the KP model. In the standard KP
model the evaluation of the learning procedure in a
company is divided in levels which take into account
the different aspects of a training, these levels are usu-
ally called: reaction, learning, behavior, results and
ROI. The modifications that we introduced take into
account the differences between a school and a com-
pany and we added a strong emphasis on the ICT so-
cial aspect. The proposed platform allows students,
teachers, parents, etc. to be connected together, to
add material and in general to interact. This generates
information which can be used to make assessments
and to help adjusting the training in order to obtain
better academic performances. An important aspect is
dedicated to the creation of an EduSN represented by
a graph where the nodes are associated with the stu-
dents and the links with the strength of the interaction
between the students. The model of this paper is to
create a graph depending only on the amount of inter-
action between people without considering the quality
and directionality of the information transmitted. The
graph created with this procedure is time dependent
and takes into account the evolution of the social in-
teractions of a school. This realization allows to have
quantitative evaluations of some aspects of the school
life which usually are considered only at a qualita-
tive/intuitive level, such as the reference people or
the presence of sub-groups. This work can be seen
as a first step in the direction of a quantification of
the complex structures which naturally arise in social
learning environments; thus, going beyond the eval-
uation of single students. A complete model should
include the social structures of all the different play-
ers in the learning environment (e.g., students, teach-
ers, special instructors, families, etc.), and the effect
of the interaction among the scholastic structures on
the final outcome of the learning process.
This interplay between the bottom-up (from the
student to the school) and top down visions (from the
social structures revolving around the learning pro-
cess to the student) are not thought to be limited to
a single scholastic institution but can naturally be ap-
plied to include different schools in a town, region
etc.; thus, providing useful metrics to manage the
knowledge of schools at a more general level. For ex-
ample, the evaluation of how compact are the school
networks in a region in respect to another one com-
pared with the respective performances, can provide
deep understandings of the problems and excellences
of the learning process.
The KPIs that we proposed range from the nor-
mal metrics usually employed in a school (grades, ab-
sences, etc.) to evaluations which take into account
the social aspect of the student’s life (e.g., central-
ity measures, connection, compactness of the graph).
Once the information is analyzed it is presented to
the main actors of the learning procedure by means of
modular dashboards. These dashboards are designed
to convey the relevant information and to be flexible
to adjust to the changes which can naturally occur in a
scholastic environment. As an example, we presented
the dashboard associated with the students where both
formal and informal aspects of the learning environ-
ment are taken into account.
A natural development of this work is the imple-
mentation and analysis of more sophisticated forms of
connection among the students (taking into account
the directionality and quality of the interaction) and
other players. At a more general level, this work
paves the way to a quantitative analysis of the inter-
action of the different social structures involved in the
learning process and their effect on the success of the
scholastic system.
REFERENCES
Almosallam, E. and Ouertani, H. (2014). Learning analyt-
ics: definitions, applications and related fields. In Her-
awan, T., Deris, M. M., and Abawajy, J., editors, Pro-
ceedings of the First International Conference on Ad-
vanced Data and Information Engineering (DaEng-
2013), volume 285 of Lecture Notes in Electrical En-
gineering, pages 721–730. Springer Singapore.
Bandura, A. (1963). Social learning and personality devel-
opment. Holt, Rinehart, and Winston, London.
Buckingham Shum, S. and Ferguson, R. (2012). Social
learning analytics. Ed. Tech. & Society.
Butts, C. T. (2008). Social network analysis: A method-
ological introduction. Asian Journal of Social Psycol-
ogy.
Claypool, M., Brown, D., Le, P., and Waseda, M. (2001).
Inferring user interest. IEEE Internet Computing,
5:32–39.
KMIS 2015 - 7th International Conference on Knowledge Management and Information Sharing
88
Corrin, L. and de Barba, P. (2015). How do students inter-
pret feedback delivered via dashboards? In Proceed-
ings of the Fifth International Conference on Learning
Analytics And Knowledge, LAK ’15, pages 430–431,
New York, NY, USA. ACM.
Kautz, H., Selman, B., and Shah, M. (1997). Referral web:
Combining socialnetworks and collaborative filtering.
Commun. ACM, 40(3):63–65.
Kirkpatrick, D. L. and Kirkpatrick, J. D. (2010).
Evaluating training programs : the four levels.
ReadHowYouWant.com ; Berrett-Koehler Publishers,
[Sydney, NSW, Australia]; San Francisco, CA.
Nespereira, C. G., Dai, K., Redondo, R. P. D., and Vilas,
A. F. (2014). Is the lms access frequency a sign of
students’ success in face-to-face higher education? In
Proceedings of the Second International Conference
on Technological Ecosystems for Enhancing Multicul-
turality, TEEM ’14, pages 283–290, New York, NY,
USA. ACM.
Newstrom, J. W. (1995). Evaluating training programs: The
four levels, by donald l. kirkpatrick. (1994). Human
Resource Development Quarterly, 6(3):317–320.
Osguthorpe, R. T. and Graham, C. R. (2003). Blended
learning environments: Definitions and directions.
Quarterly Review of Distance Education, 4(3):227–
233.
Phillips, J. J. and Phillips, P. P. (2003). Using action plans to
measure roi. Performance Improvement, 42(1):24–33.
R¨ossling, G., Joy, M., Moreno, A., Radenski, A., Malmi,
L., Kerren, A., Naps, T., Ross, R. J., Clancy, M.,
Korhonen, A., Oechsle, R., and Iturbide, J. A. V.
(2008). Enhancing learning management systems to
better support computer science education. SIGCSE
Bull., 40(4):142–166.
Sakarya, S., Bodur, M., Yildirim-ktem, ., and Selekler-
Gksen, N. (2012). Social alliances: Business and so-
cial enterprise collaboration for social transformation.
Journal of Business Research, 65(12):1710–1720.
Santos, J. L., Govaerts, S., Verbert, K., and Duval, E.
(2012). Goal-oriented visualizations of activity track-
ing: A case study with engineering students. In
Proceedings of the 2Nd International Conference on
Learning Analytics and Knowledge, LAK ’12, pages
143–152, New York, NY, USA. ACM.
Siemens, G. and Baker, R. S. J. d. (2012). Learning ana-
lytics and educational data mining: Towards commu-
nication and collaboration. In Proceedings of the 2Nd
International Conference on Learning Analytics and
Knowledge, LAK ’12, pages 252–254, New York, NY,
USA. ACM.
Teevan, J., Dumais, S. T., and Horvitz, E. (2005). Person-
alizing search via automated analysis of interests and
activities. In Proceedings of the 28th annual inter-
national ACM SIGIR conference on Research and de-
velopment in information retrieval, SIGIR ’05, pages
449–456, New York, NY, USA. ACM.
Tour, F., Ameur, E., and Dalkir, K. (2014). Am2o -
an efficient approach for managing training in enter-
prise. In Proceedings of the International Conference
on Knowledge Management and Information Sharing,
pages 405–412.
Verbert, K., Govaerts, S., Duval, E., Santos, J. L., Assche,
F., Parra, G., and Klerkx, J. (2014). Learning dash-
boards: An overview and future research opportuni-
ties. Personal Ubiquitous Comput., 18(6):1499–1514.
Designing the Content of a Social e-Learning Dashboard - The Study is based on Novel Key Performance Indicators
89
