Hysteresis in the Perception of Visual Unity
Confirmation of a Neural Network Model Prediction
Ian Bright
1
and Raymond Pavloski
2
1
Departments of Psychology and Mathematics, Indiana University of Pennsylvania,
1020 Oakland Avenue, 15701, Indiana, PA, U.S.A.
2
Department of Psychology, Indiana University of Pennsylvania,
1020 Oakland Avenue, 15701, Indiana, PA, U.S.A.
Keywords: Hard Problem, Neurotechnology, Qualia, Recurrent Neural Network, Tolerance Space, Topological Vision,
Visual Object Unity.
Abstract: In response to a simulated retinal image of an object, the recurrent input to a richly connected artificial
neural network organizes into a connected open set (COS) of ionic conductance values, which models the
continuity and unity of a visual object. As the density of light dots on a dark background increases and then
decreases, a COS appears at a density that is higher than that at which it disappears (hysteresis). This
experiment tested the hypothesis that humans will show hysteresis similar to that of the simulation. In
addition, the effect of dot lightness on the perception of a unified visual object was also tested.
1 INTRODUCTION
It has been suggested by the work of Chen (2005)
and Zhang (2005) that the perceived unity of a visual
object is a primitive of the visual system and is
organized in terms of topological properties. While
there is strong experimental data to support this view
of the early visual system, an explanation of how
neural networks process and sort topological
features remains elusive (Pomerantz, 2003). This is
an important problem: understanding how the brain
organizes and separates visual objects would open
new possibilities in the field of neurotechnology
(e.g., a neural prosthesis that restores vision for a
stroke victim with damage to a portion of V1.)
The topological approach to perception advanced
by Chen (2005) has been implemented in work on
computational vision. In this approach, a tolerance is
defined as a range within the image within which
variations are ignored for the subsequent purpose of
computing connectivity (Huang, Huang, Tan & Tao,
2010). While this work demonstrates how the global
property of connectivity can be computed from
discrete elements, it does not address the issue of the
perception of connected elements as visual unity.
This latter issue can be investigated by
determining if there exist natural sources of
tolerance to small differences between the ionic
conductances produced by closely positioned
neurons in a recurrent neural network (RNN). Using
this approach, Pavloski (2015) constructed a RNN
consisting of a 33 x 33 lattice of excitatory neurons
interconnected with an 11 x 11 lattice of inhibitory
neurons for stability. The excitatory neurons were
stimulated by a 33 x 33 lattice of simulated retina
cells. Results showed that a connected open set
(COS) of ionic conductance vectors quickly emerges
from the input of a simulated object image.
Furthermore, COSs mimic several visual phenomena
including just noticeable differences, grouping by
proximity, human V1 fMRI data for real and
apparent motion, and object constancy over rotation
and changes of size and orientation of an image.
Dynamical effects of sequential presentations of
stimuli are well documented (e.g., Tuller, Case,
Ding and Kelso, 1994), and Pavloski (2015) tested
the RNN using sequential presentations of visual
images to determine those image parameters at
which a COS first appears and subsequently
disappears. The images used consist of 140 one-
pixel spots. One hundred of the spots are
repositioned randomly within the 33 x 33 pixel
image area on each iteration (update of all network
neurons). The remaining 40 spots are positioned
randomly within a square window the sides of which
are reduced from a length of 33 pixels to a length of
seven over the first 31 iterations; the sides increase
Bright, I. and Pavloski, R..
Hysteresis in the Perception of Visual Unity - Confirmation of a Neural Network Model Prediction.
In Proceedings of the 3rd International Congress on Neurotechnology, Electronics and Informatics (NEUROTECHNIX 2015), pages 49-53
ISBN: 978-989-758-161-8
Copyright
c
2015 by SCITEPRESS – Science and Technology Publications, Lda. All rights reserved
49
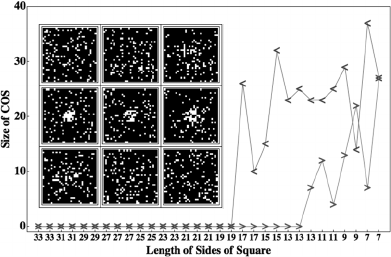
over the remaining 30 iterations to the original
length of 33. The inset in Figure 1 shows images
from iterations 1, 10, 20 (top row), 30, 31, 32
(middle row), and 42, 52, and 61 (bottom row).
Hysteresis is present; a COS first appears when the
additional dots are enclosed in a square with sides of
length 13 during initial decreases in window size
(→)
and disappears only when the sides are subsequently
increased (←) to a length of 19.
Figure 1: Examples of retinal images presented to the
RNN (left) and the number of conductance vectors in the
COS are plotted against the length of the sides of the
smaller window (Pavloski, 2015).
This result motivates the present studies, which
tested the hypothesis that human participants would
demonstrate hysteresis in the perception of object
unity when observing visual images similar to those
used in the above simulation.
2 EXPERIMENT 1
In an initial attempt to test the predictions of
Pavloski’s (2015) neural network, a pilot study was
conducted to determine parameters at which
hysteresis could be expected to occur in human
participants.
2.1 Background
It has been demonstrated by Poltoraski and Tong
(2014) that hysteresis occurs in the perception of
scenes and objects. For example, when shown a
series of pictures of a living room, participants who
were shown a close up of a table first and then
shown images that gradually zoomed out considered
more of the pictures to be of the table, rather than a
living room, when compared to those who began
with a broader picture of the living room and
gradually zoomed in.
Hysteresis has also been demonstrated in the
auditory system. In a series of experiments
conducted by Tuller, Case, Ding, and Kelso (1994),
participants were presented with a male utterance of
a /s/ sound followed by a silent gap lasting between
0 and 76 ms (increased in increments of 4 ms) and
an electronically generated /ay/ sound for which the
first formant had an onset frequency of either 230
Hz (biased toward the perception of stay) or 430 Hz
(biased toward the perception of say). Tuller et al.
used these two types of stimuli so that participants
could not simply count stimuli in order to report
their perceptions of either say or stay. At a shorter
silent gap it was found that participants heard the
word say, whereas participants heard the word stay
when a longer gap was present. During ordered
presentations, Tuller et al. found that perception of
the word stay occurred at a far longer silence gap
than the gap at which it disappeared. As expected,
the 230 Hz /ay/ first formant onset frequency was
found to be more likely to lead to the perception of
the word stay than was the 430 Hz first formant
onset frequency.
2.2 Method
Five undergraduate participants volunteered to take
part in the experiment. All participants had normal
or corrected to normal vision. Participants were
placed in a booth constructed to block out
extraneous light and viewed images (created using
Mathematica Version 9) projected onto a screen.
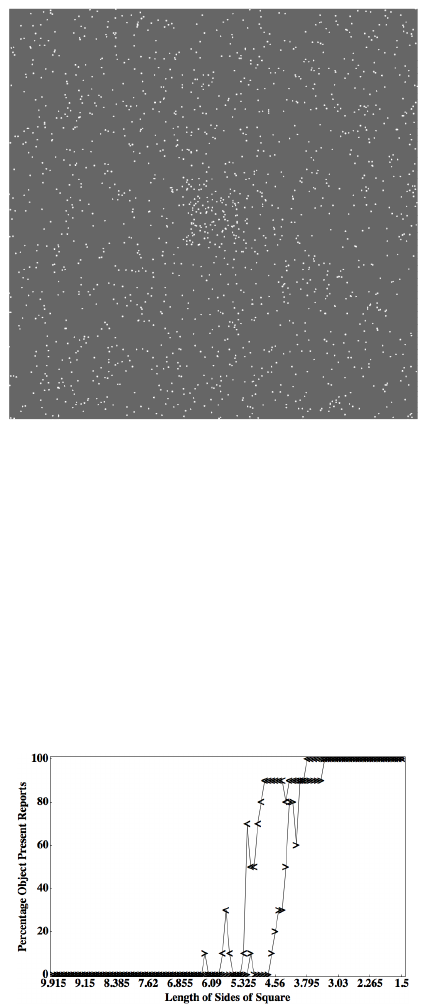
Each image consisted of 1500 dots of gray level
0.335 randomly placed on a gray level 0.1, 10x10
square. An additional 100 gray level 0.335 dots were
randomly positioned within an area the size of which
changed from one image to the next. The length of
each individual dot was .2 percent of the width of the
video screen. A sample image is shown in Figure 2.
Participants took part in two trials consisting of
four runs of images (i.e. increasing, decreasing, and
random change in area containing the additional 100
dots). The sequence of the runs in each trial was
randomly assigned with the constraint that each
ordered run would be followed by a random run and
vice-versa. Each run in the trials contained the same
100 images.
Images were displayed for 500 ms, and were
immediately replaced by a plain white screen.
Participants were instructed verbally respond yes if a
unified object was perceived and respond no if no
unified object was perceived. The next image would
not appear until a response was recorded. Timing
and recording of answers was handled by E-Prime
software. In between the two trials, participants were
NEUROTECHNIX 2015 - International Congress on Neurotechnology, Electronics and Informatics
50
given up to a five-minute break.
Figure 2: An example of a high density/low area image is
shown. Contrast is enhanced for ease of viewing.
2.3 Results
A one-way within-subjects analysis of variance was
performed on the data. As shown in Figure 3,
hysteresis was clearly present. As expected, the
order in which the images were presented was found
to be significant F(1,4) = 109.394, p < .01. The
decreasing density trials were more likely to lead to
the experience of a unified object than the increasing
density trials.
Figure 3: A graph of the number of times each image was
reported to contain an object during the runs.
2.4 Discussion
The results of the pilot study were consistent with
the prediction of the neural network with respect to
the presence of hysteresis. In looking at Figure 3, it
is easy to see that in the middle of the runs
participants were less likely to see a unified object as
the density increased when compared to the
decreasing density runs. This is in comparison to the
high and low densities, where the two runs
demonstrated no difference.
3 EXPERIMENT 2
Building on the results of Experiment 1, a more
robust study was performed to determine if the
perception of a unified object is characterized by
hysteresis in human participants.
3.1 Changes from Experiment 1 and
Rationale for Changes
While having subjects report their response verbally
was successful in minimizing errors, it did have its
drawbacks. Participants frequently reported fatigue
from having to give hundreds of verbal responses.
Additionally, having trials consist of 400 images
also resulted in fatigue. Participants would
sometimes take unscheduled breaks during the
experiment by delaying a response as an attempt to
recover.
In an attempt to decrease fatigue, a wireless
keyboard was used to allow the participants to input
their responses. The highest and lowest dot densities
were also moved closer together, as the original
maximum and minimum demonstrated no
difference. In addition, the change in density
between images was increased to get the number of
images contained in each run down to 20. This
decreased the number of images in each trial to 80.
The number of trials were increased to 10, however
resulting in the same number of total images shown.
Participants were given a two-minute break between
each pair of trials also to decrease fatigue.
Another frequently reported issue was directed
towards the white screen that flashed following the
presentation of each image. Participants often
complained that the bright light of the image caused
discomfort for those who were inside the otherwise
completely darkened booth. In an attempt to
decrease this discomfort a dark gray image was
presented between each pair of images.
The second experiment also included the use of a
second independent variable that was manipulated
by Tuller et al. (1994), but not employed in our pilot
research. As noted above, the first formant of the
electronically generated /ay/ sound used by Tuller et
al. had a first formant onset frequency of either 230
Hz (biased toward the perception of stay) or 430 Hz
Hysteresis in the Perception of Visual Unity - Confirmation of a Neural Network Model Prediction
51
(biased toward the perception of say). Tuller et al.
used these two types of stimuli so that participants
could not simply count stimuli in order to report
their perceptions of either say or stay. In order to
include this manipulation in our second experiment,
the gray level of the additional 100 dots was set
either to the gray level of the 1500 background dots
(0.335) or to 0.375. It was anticipated that this dot
brightness manipulation would produce a significant
effect in reports of a unified visual object, with the
higher gray level dots being more likely to be
perceived as unified.
3.2 Method
Nine undergraduate participants volunteered to take
part in the experiment. All participants had normal
or corrected to normal vision. Participants were
placed in a booth constructed to block out
extraneous light and viewed images (created using
Mathematica Version 10) projected onto a screen.
Each image consisted of 1500 dots of gray level
0.335 randomly placed on a gray level 0.1, 10x10
square. An additional 100 dots of either gray level
0.335 or 0.375 were randomly positioned within an
area the size of which changed from one image to
the next. The length of each individual dot was .2
percent of the width of the video screen.
Participants took part in 10 trials consisting of
four runs of images (i.e. increasing area, decreasing
area, and random area). The sequence of the runs in
each trial was randomly assigned with the constraint
that each ordered run would be followed by a
random run and vice-versa. Each run in the trials
contained the same 20 images. Five of the trials
consisted of dots that were brighter than the other
five.
Images were displayed for 500 ms, and were
immediately replaced by a plain gray level 0.1
image. Participants were instructed to press one key
if a unified object was perceived and a second key if
no unified object was perceived. The next image
would not appear until a response was recorded.
Timing and recording of answers was handled by E-
Prime Software. Following each trial, participants
were given up to a two-minute break.
3.3 Results
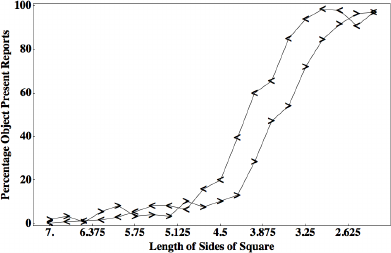
The results of this experiment are shown in Figure 4.
A two-way within-subjects analysis of variance was
performed on the data. The order in which the
images were presented was found to be significant at
F(1,8) = 13.5467, p < .01. The decreasing density
trials were more
likely to lead to the experience of
an image than the increasing image. Dot brightness
did not produce a significant effect.
Figure 4: This graph plots the estimated probability that an
image was reported to contain an object during increasing
and decreasing runs across both levels of brightness.
4 DISCUSSION AND FUTURE
RESEARCH
While the results of the study were consistent with
the predictions of the neural network with respect to
the presence of hysteresis, the hysteresis was not as
strong as that found in the pilot study. A possible
explanation for this may be the fewer number of
images that were used in the individual runs when
compared to the RNN. Along the same lines, it is
also possible that the increased change in density
between the images may have contributed to the
decreased hysteresis. Additionally the brightness did
not play a significant role in changing the perception
of the images. It is possible that the change in
brightness levels was not large enough to cause any
difference in reports of a unified object. Further tests
will need to be performed to determine what role
brightness may play in the perception of a unified
object.
Looking ahead, further experiments will be run
to continue testing the predictions of the RNN. By
decreasing the change in the area of the dot square
between images as well as changing the low and
high points of the area, it is predicted that hysteresis
will increase. In addition to manipulating the area
the square of dots occurs, experiments in
manipulating the density of the dots with a fixed
area will also be performed. Lastly, different
presentation methods, such as the use of virtual
reality headsets will be utilized in an attempt to
further generalize the results.
NEUROTECHNIX 2015 - International Congress on Neurotechnology, Electronics and Informatics
52
REFERENCES
Chen, L. (2005). The topological approach to perceptual.
organization. Visual Cognition, 12(4), 553-637.
Huang, Y., Huang, K., Tan, T., & Tao, D. (2010). A novel
visual organization based on topological perception.
Computer Vision – ACCV 2009. Lecture Notes in
Computer Science, Volume 5994, 180-189.
Pavloski, R. (2015). Toward sentient neurotechnology:
Visual object unity may be structured by and constrain
neural interactions. Neurotechnix 2015.
Poleratski, S. & Tong, F. (2014) Hysteresis in the
Dynamic Perception of Scenes and Objects. Journal of
Experimental Psychology: General, 143(5), 1875–
1892.
Pomerantz, J. R. (2003). Wholes, holes, and basic features
in vision. Trends in Cognitive Sciences, 7(11), 471-
473.
Tuller, B., Case, P., Ding, M., & Kelso, J.A.S. (1994). The
nonlinear dynamics of speech categorization. Journal
of Experimental Psychology: Human Perception and
Performance, 20(1), 3-16.
Zhang, J. (2005). Object oneness: The essence of the
topological approach to perception. Visual Cognition,
12(4), 683-690.
Hysteresis in the Perception of Visual Unity - Confirmation of a Neural Network Model Prediction
53
