Analysis of Thermal Comfort for Cycling Sport: A Case Study for
Rio de Janeiro Olympic Games
Alessandro Pezzoli
1
and Roberto Bellasio
2
1
Interuniversity Department of Regional and Urban Studies and Planning,
Politecnico di Torino and Università di Torino, Torino, Italy
2
Enviroware, Concorezzo, Italy
Keywords: Thermal Comfort, Weather, Computer Analysis, Cycling, Sport Performance.
Abstract: As well known the meteorological and the environmental parameters (as wind, air temperature, rain,
humidity, altitude, location, etc…) affect strongly the sport performance. Considering the recent literature
on this topic, it is evident how the evaluation of the thermal comfort in the athletes is a crucial subject that
has to be studied. In fact the thermal comfort of the athletes is not only linked with the sport performance
but also with the safety of the athletes themselves. For these reasons in this research it is presented an
innovative methodology to evaluate the thermal comfort of cycling athletes at the next Rio de Janeiro
Olympic Games. This analysis is carried out for the Rio de Janeiro area considering the two venues for the
cycling sport and for the two disciplines (Time Trial and Road Race). The meteorological data of two
stations representative of the racing areas have been collected for a period of 20 years. They have been
analyzed to produce the wind roses and to calculate two thermal indices: Predicted Mean Vote (PMV) and
Physiological Equivalent Temperature (PET). The results of this research show the importance of the
climatological analysis for optimizing the training and nutrition plans of the athletes.
1 INTRODUCTION
As shown in a previous paper (Pezzoli et al., 2015),
the assessment of bio-climatological conditions and
of thermal comfort in endurance sports, particularly
in road cycling, is essential not only for a proper
planning of the training program and the nutritional
plan, but also for a better evaluation of the racing
strategy or for the correct development and choice of
the materials.
Among the meteorological variables that
strongly influence the sport activity the most
important ones are temperature, wind, precipitation,
fog, atmospheric pressure and relative humidity.
In fact Brocherie et al. (2014) suggest how an
integration of the combination of all relevant
multidisciplinary data (i.e. thermal physiology,
mathematical modelling, occupational medicine,
biometeorology) would generate better application
in an ecological sport science setting with potential
impact on heat stress guideline management.
A deeper review about the emerging
environmental and weather challenges in outdoor
sports was held by Brocherie et al. (2015). The
Authors show how the Universal Thermal Climate
Index, also indicated by the abbreviation UTCI
(Jendritsky et al., 2002), promises to be, in the next
future, useful for the sport practitioners.
In fact the the operational UTCI procedure,
classified into ten categories of thermal stress
ranging from “extreme cold stress” to “extreme heat
stress” (Brode et al., 2012), appears useful. It
promises to assess the outdoor sport participants’
physiological responses to humidity and radiative
loads in hot environments, as well as to wind in the
cold.
Nevertheless Blazejczyk et al. (2012) illustrated
how, in a comparison between UTCI and other
bioclimatic indices, values most similar to those of
UTCI were found for indices derived from human
heat balance models as Physiological Equivalent
Temperature (PET). Similarly to the UTCI, PET also
is related to the equivalent temperature. The
differences between the specific values of these two
indeces result from the various structures of heat
balance models and different definitions of reference
conditions.
However Pezzoli et al. (2012) and Brocherie and
Millet (2015) show how also the Predicted Mean
Pezzoli, A. and Bellasio, R..
Analysis of Thermal Comfort for Cycling Sport: A Case Study for Rio de Janeiro Olympic Games.
In Proceedings of the 3rd International Congress on Sport Sciences Research and Technology Support (icSPORTS 2015), pages 281-289
ISBN: 978-989-758-159-5
Copyright
c
2015 by SCITEPRESS – Science and Technology Publications, Lda. All rights reserved
281
Vote (PMV) can be used to characterize the thermal
comfort in sport activities (respectively for cycling
and tennis).
As shown by Brocherie and Millet (2015) the
WBGT is indicated by numerous leading sports
federations (e.g., Fédération Internationale de
Football Association [FIFA], International
Association of Athletics Federations [IAAF],
International Tennis Federation [ITF]) as the index
to be used to evaluate the thermal comfort during the
sports activities. It is important to remember that this
empirical index is computed from the reading of the
dry-bulb temperature and two derived measures: the
natural wet-bulb temperature and the black-globe
temperature.
Moreover the same Authors, based on previous
researches, denoted that incorporating newly
available bioclimatic indices such as PMV instead of
WBGT would considerably improve sport-specific
heat stress modeling and current guidelines.
The main goal of this paper is to present an
innovative methodology to evaluate the thermal
comfort of the athletes considering PET and PMV
indices for cycling sport. The analysis will be carried
out for the Rio de Janeiro area considering the two
venues for the cycling sport and for the two
disciplines (Time Trial and Road Race).
This analysis will be developed considering the
men’s races. The developed statistical analysis will
demonstrate how it is possible to characterize the
thermal conditions of an athlete involved in a race.
Finally this analysis can be used to develop the
strategy’s assessment of the race.
2 MATERIAL AND METHODS
2.1 Research Design
The research is developed analyzing:
The geographical data of the race area with a
particular focus on the tracks. For this analysis
Google Earth is used as Open Access map
system, as well as the free information available
on Internet;
The meteorological data (wind direction, wind
speed, air temperature, relative humidity, cloud
coverage). This computer supported analysis has
been performed using the WindRose PRO3
software (Enviroware, 2015);
The PET and the PMV thermal comfort indices.
This part of research is also computer-supported
through the RayMan software (Matzarakis et al.
2007, 2010).
2.2 Material
2.2.1 Geographical Data
To analyze the geographical data, the first step is
searching the tracks that will be used for the two
disciplines (Time Trial and Road Race) during Rio
de Janeiro 2016 Olympic Games.
This information is provided by Union Cycliste
International – International Cycling Union (UCI,
2015). In the UCI web-page it is possible to find the
tracks for the two disciplines.
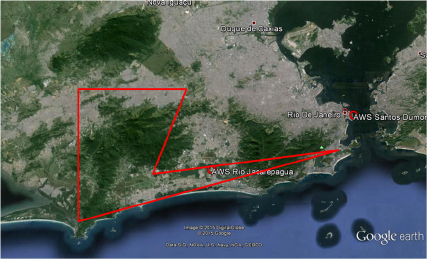
Then the tracks are georeferenced using Google
Earth as Open Access map system (Figure 1).
2.2.2 Meteorological Data
The meteorological variables, needed for the
analysis described in this study, are wind direction,
wind speed, air temperature and relative humidity.
The meteorological observations at surface have
been obtained from the Jacarepagua and Santos
Dumont weather stations, whose locations are shown
in Figure 1. The distance between the two stations is
about 22 km.
Weather data have been collected for the time
period 1994-2014 (20 years). The meteorological
data have been analysed filtering out all the values
that were not measured in August, because the
Olympic Games will be held in Rio de Janeiro
between 5
th
and 21
st
August 2016.
Figure 1: Positions of the two meteorological stations. In
the red box the zone of competence for the road races is
indicated.
2.2.3 The WindRose PRO3 Software
A wind rose is a chart which gives a view of how
wind speed and wind direction are distributed at a
particular location over a specific period of time.
This representation allows summarizing in a single
plot a large quantity of data; therefore it is a very
WPPDSports 2015 - Special Session/Symposium on Weather, Position and Performance data in Outdoor Sports
282

useful tool.
The wind roses presented in this work have been
produced with the WindRose PRO3 software
(Enviroware, 2015).
A time filter option allows analysing the wind
data and produce wind roses only for particular
years, months, days of the week or hours of the day.
It is also possible to produce wind roses only for day
or night hours, which are determined by the software
itself starting from the geographical position and the
time zone of the meteorological station. Monthly,
hourly and three-hourly wind roses are automatically
created by the software.
The WindRose PRO3 software has been used in
many sectors: meteorology, architecture, air quality,
oceanography, veterinary medicine, veterinary
epidemiology, wind energy, climate, aquatic botany
and agriculture. It has also been used for the analysis
of sport performances (Pezzoli et al., 2013; Pezzoli
and Bellasio, 2014).
2.2.4 The RayMan Software
The RayMan software (Matzarakis et al. 2007, 2010)
is widely employed in bioclimatological studies
applied to tourism activities and sport practices.
Such software combines many heat transfer models
with the heat sensation perceived in the human body.
It generates universal scales of thermal sensation,
which have large application in the outdoor sports
like road cycling (Matzarakis et al. 1999;
Brandenburg et al., 2007; Pezzoli et al., 2012). The
input variables needed by the RayMan software are:
Date, hour and location (longitude and latitude,
altitude and time zone);
Environmental and meteorological data like air
temperature (°C), pressure (hPa), relative
humidity (%), wind speed (m/s) and cloud
covering (octas);
Personal data about the subject (weight, height,
age and sex);
The heat transfer resistance of the clothing,
according with UNI EN ISO 9920/2004 and
the internal heat production (W), consequential
to the physical activity of the subject.
The outputs of the model are the two
bioclimatological indices (PMV and PET) which
provide the thermal perception and the grade of
physiological stress, as reported in Table 1.
The PMV predicts the normalized value of the
thermal comfort of a large group of people exposed
to similar environmental conditions, while the PET
has detailed thermo-physiological basis taking into
account the energy balance of the human body in
relationship with climatic conditions.
Table 1: Thermal sensations according to PMV and PET
values.
PMV PET [°C]
Thermal
perception
Grade of
physiological
stress
< -3.5 < 4 Very cold
Extreme cold stress
-3.5 - -2.5 4 - 8 Cold Strong cold stress
-2.5 - -1.5 8 - 13 Cool
Moderate cold
stress
-1.5 - -0.5 13 - 18 Slightly cool
Slight cold stress
-0.5 – 0.5 18 - 23 Comfortable
No thermal stress
0.5 – 1.5 23 - 29
Slightly
warm
Slight heat stress
1.5 – 2.5 29 - 35 Warm
Moderate heat
stress
2.5 – 3.5 35 - 41 Hot
Strong heat stress
> 3.5 > 41 Very hot
Extreme heat stress
2.3 Methods
2.3.1 The Evaluation of Meteorological
Conditions for Cycling Sport
As well described by Pezzoli et al. (2012) the
cycling sport is strongly influenced by the
meteorological variables. The wind direction, as
well as the wind speed, strongly influences the
performance in the cycling sport.
A correct climatological analysis, taking into
account this meteorological variable (wind), can be
fruitfully used by the coaches and the athletes to:
Decide the training program (physical and
mental);
Decide about the training site;
Decide about the nutrition planning;
Develop the material.
For what concerns the analysis of the wind direction,
it is decided to analyse the “True Wind Direction”
(TWD) failing to take into account the apparent
wind generated by the speed of the bicycle. The
TWD is measured in degrees considering the
Geographical North. The wind roses (Section 3.2)
are drawn considering a wind direction range of 30°.
Of course it is evident that also the air
temperature and the relative humidity influence the
performance in the cycling sport. In fact, as
mentioned before, the thermal comfort indices are
function of these two meteorological variables.
The typical day of each meteorological variable
has been evaluated by using the WindRose PRO3
Analysis of Thermal Comfort for Cycling Sport: A Case Study for Rio de Janeiro Olympic Games
283
software. The hourly average wind direction, hourly
average wind speed, hourly average air temperature
and hourly average relative humidity as well as the
hourly standard deviation for all of these
meteorological variables are calculated in the typical
day.
Finally the rain, evaluated in term of cloud
coverage, is analysed and used as input in the
RayMan model for the evaluation of the PET and
PMV thermal indices.
2.3.2 The Evaluation of Thermal Comfort
Conditions for Cycling Sport
The analysis of the thermal comfort was carried out
considering the men’s category.
The thermal comfort indices (PET and PMV) are
evaluated for a target of athletes that represents an
average professional “climbing and trialist” cyclist’s
categories (age: 27, height: 1,75m, weight: 65kg as
suggested by Lucia et al., 2000).
It was decided to calculate the thermal comfort
indices for each hour for a time interval included
between 09.00LT ÷ 16.00LT. The input, for what
concerns the meteorological variables, are the
average of the meteorological variables corrected
using the standard deviation.
Moreover the indices are calculated for two
different conditions: restore and effort period. The
internal heat production (W) is considered equal to
80W for the restore period and equal to 300W for
the effort period (Pezzoli et al., 2012).
The heat transfer resistance of the clothing is
considered equal to 0.6clo (corresponding to a light
gym suit with a t-shirt) for the restore period and
equal to 0.3clo (corresponding to a t-shirt and short
pants) for the effort period.
3 RESULTS AND DISCUSSION
3.1 Analysis of the Venues for Cycling
Sports in Rio de Janeiro 2016
Olympic Games
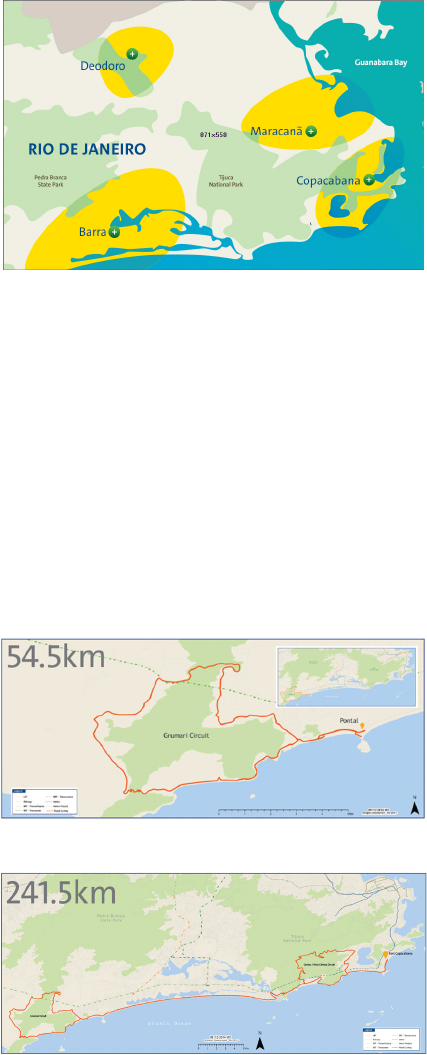
The venues for cycling sports are localized in two
areas of Rio de Janeiro named Barra (Time Trial) and
Copacabana (Road Race) as illustrated in Figure 2.
A more detailed geographical representation of
the two different circuits is provided by UCI. Figure
3 illustrates the circuit of the Time Trial, for a total
length of 54.5 km, while Figure 4 represents the
circuit of the Road Race, for a total length of 241.5
km.
Figure 2: Location of the two areas for cycling sports in
Rio de Janeiro (courtesy: Rio 2016 Organising
Committee).
Comparing Figure 3 and Figure 4 with Figure 1 it is
possible to observe that the selected weather stations
are representative of both the circuits. Specifically
the weather station of Santos Dumont is the
reference for Copacabana area and the weather
station of Jacarepagua is representative for Barra
area.
It is also evident how the Time Trial race will be
carried out in Barra region, while the Road Race will
be held both in Copacabana (start and arrival) and in
Barra region.
Figure 3: Time Trial circuit (courtesy: UCI).
Figure 4: Road Race circuit (courtesy: UCI).
3.2 Analysis of Meteorological
Conditions in Rio de Janeiro in
August
The wind roses are shown in Figure 5a, 5b, 5c, 5d
and Figure 6a, 6b, 6c, 6d, respectively for the
WPPDSports 2015 - Special Session/Symposium on Weather, Position and Performance data in Outdoor Sports
284
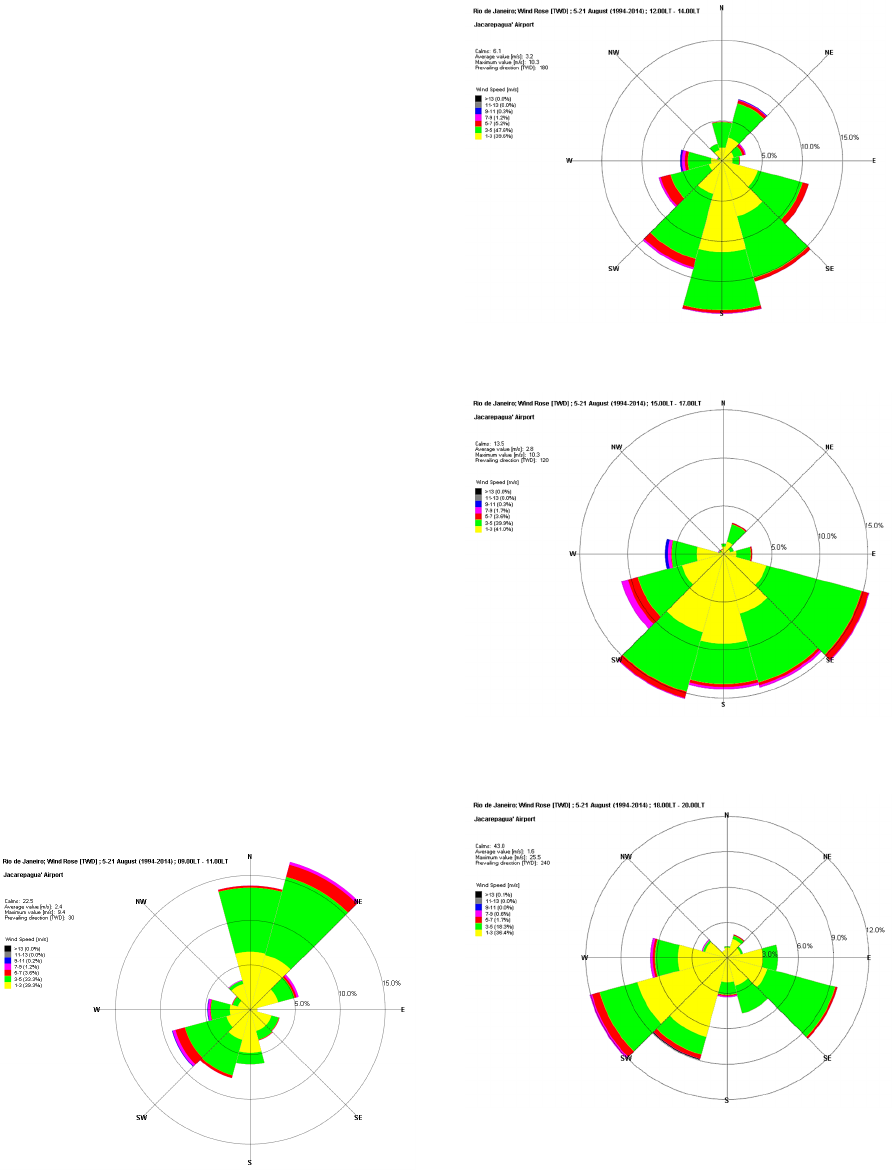
stations Jacarepagua and Santos Dumont. For each
station the wind roses have been produced for the
period 5-21 August and for four time intervals of the
day: 09.00LT ÷ 11.00LT, 12.00LT ÷ 14.00LT,
15.00LT ÷ 17.00LT and 18.00LT ÷ 20.00LT.
At the Jacarepagua station the prevailing wind
comes from the north eastern sector in the time
interval 09.00LT ÷ 11.00LT, from the southern
sector in the time periods 12.00LT ÷ 14.00LT and
15.00LT ÷ 17.00LT, and from the south western
sector in the time interval 18.00LT ÷ 20.00LT. In all
the time intervals wind speed from 1m/s to 3m/s
interests about 40% of the observations, while wind
speed greater than 5m/s interests about 5% ÷ 7% of
the observations, with the exception of the time
period 18.00LT ÷ 20.00LT where it is 2.3%. This
last time interval is also characterized by a high
value of calms (43%).
At the Santos Dumont station the prevailing
wind comes from the northern sector in the time
interval 09.00LT ÷ 11.00LT, and from the southern
sector in the remaining time intervals.
In the first time interval wind speeds from 1m/s
to 3m/s interest about 44% of the observations, in
the second and fourth time intervals they interest
about 25% of the observations, while in the third
time interval they interest about the 10% of the
observations. The third time interval is also
characterized by the higher percentage of wind
speeds greater than 5m/s (more than 30%) and by
the lower presence of calms (3.5%).
Considering the positions of the weather stations
(Figure 1), the pattern described by the wind roses is
typical of the breeze regimes, with wind blowing
from land to sea in the first hours of the morning,
and in the opposite direction during the afternoon.
Figure 5a: Wind roses of the Jacarepagua station. Time
interval: 09.00LT ÷ 11.00LT.
Figure 5b: Wind roses of the Jacarepagua station. Time
interval: 12.00LT ÷ 14.00LT.
Figure 5c: Wind roses of the Jacarepagua station. Time
interval: 15.00LT ÷ 17.00LT.
Figure 5d: Wind roses of the Jacarepagua station. Time
interval: 18.00LT ÷ 20.00LT.
Analysis of Thermal Comfort for Cycling Sport: A Case Study for Rio de Janeiro Olympic Games
285
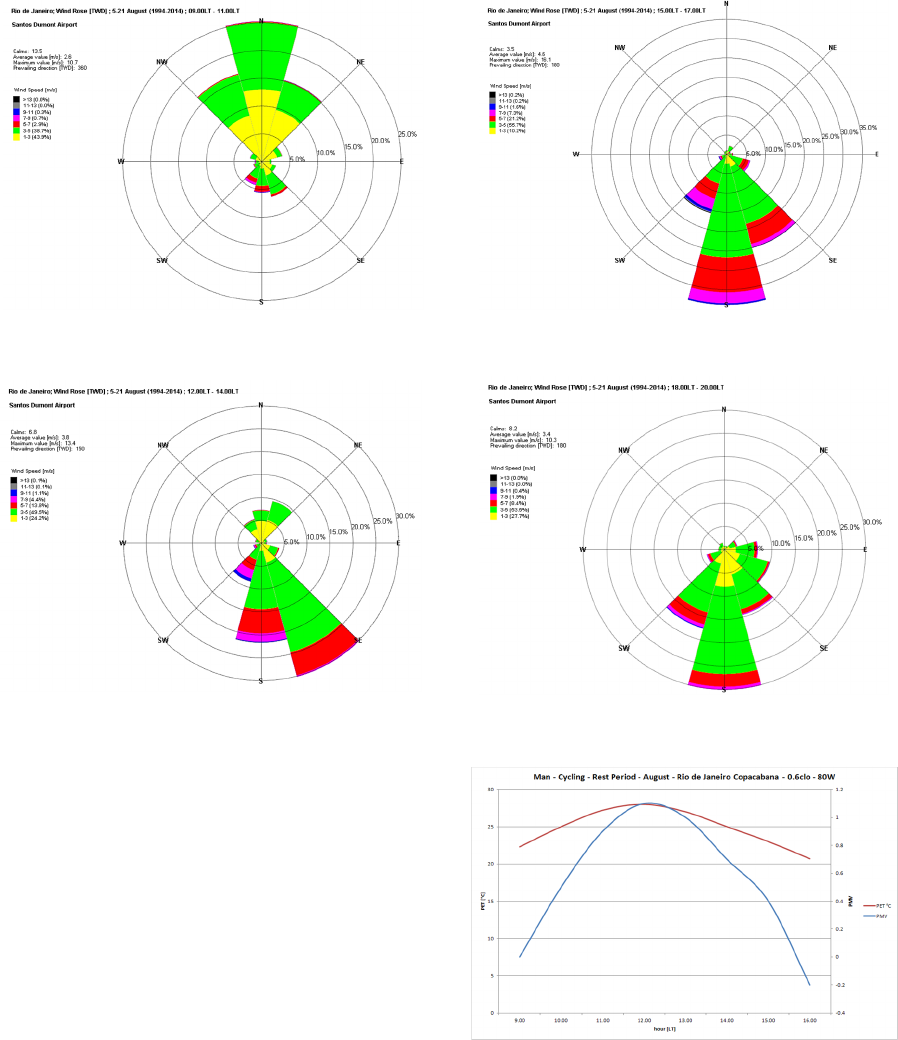
Figure 6a: Wind roses of the Santos Dumont station. Time
interval: 09.00LT ÷ 11.00LT.
Figure 6b: Wind roses of the Santos Dumont station. Time
interval: 12.00LT ÷ 14.00LT.
3.3 Analysis of Thermal Comfort in
Rio de Janeiro in August for the
Athletes of Cycling Sports
To analyze the thermal comfort in Rio de Janeiro the
two tables, presented by Blazejczyk et al. (2012) and
Brocherie and Millet (2015), are the reference.
These tables show the heat-stress indices’
temperature limits in reference to thermal sensation,
alert description and recommended sporting activity.
Table 2 summarizes the above mentioned tables.
Figure 7 and Figure 8 illustrate the PET and PMV in
the restore period for Copacabana and Barra areas
(Section 2.3.2).
Observing Figure 7 and Figure 8, it is possible to
note that around 12.00LT the thermal indices reach
high values (PET = 27 ÷ 31°C ; PMV = 1.1 ÷ 1.7)
for both the areas. It is also important to note that in
Copacabana the values of the thermal comfort
indices are lower than those obtained in the Barra
area.
Figure 6c: Wind roses of the Santos Dumont station. Time
interval: 15.00LT ÷ 17.00LT.
Figure 6d: Wind roses of the Santos Dumont station. Time
interval: 18.00LT ÷ 20.00LT.
Figure 7: PET and PMV thermal indices in the restore
period for Rio de Janeiro Copacabana area.
The maximum values of PET and PMV observed in
Figure 7 and Figure 8 correspond to a warm thermal
sensation and an alert description, as recommended
for sporting activity for WBGT, equal to “caution”.
WPPDSports 2015 - Special Session/Symposium on Weather, Position and Performance data in Outdoor Sports
286
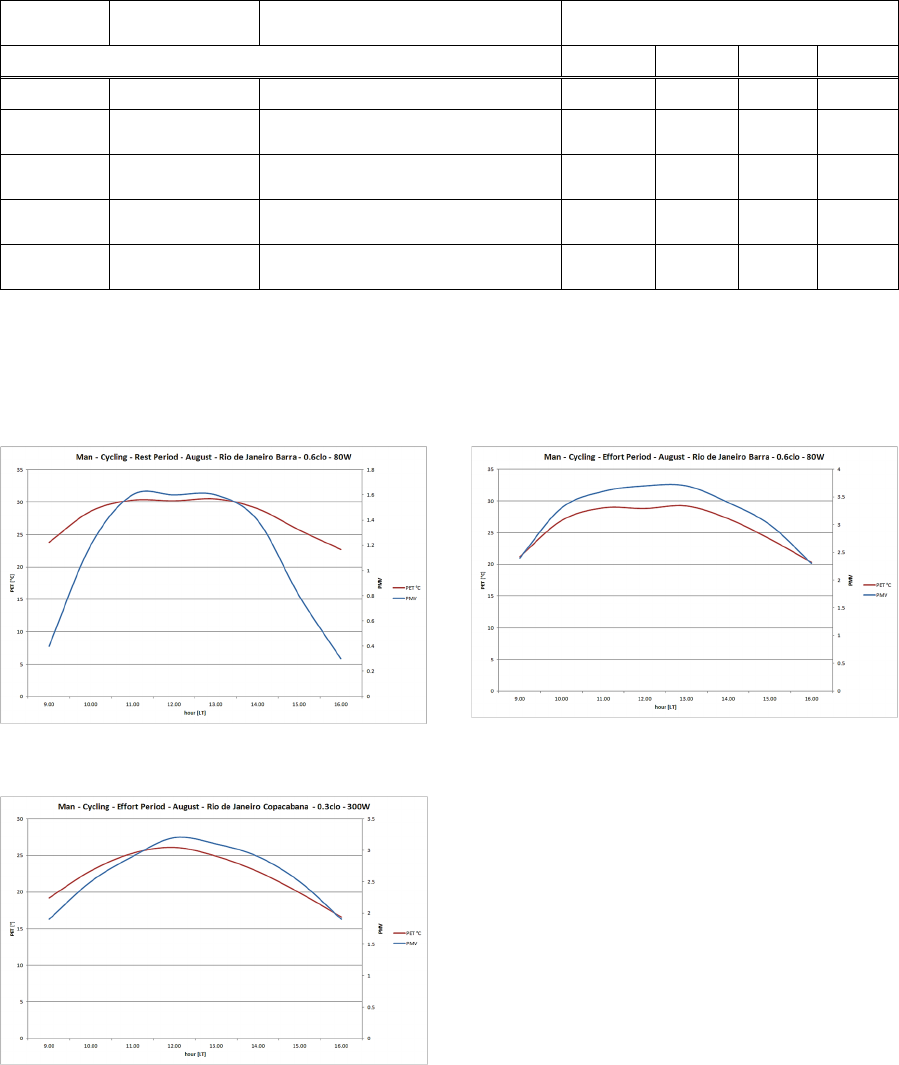
Table 2: Selected heat—stress indices’, temperature limits [°C] in reference to thermal sensations, alert description and
recommended sporting activity. Modification of the tables of Blazejczyk et al. (2012) and of Brocherie and Millet (2015).
Thermal
sensation
Alert description
a
Reccomended sporting activity
a
Index
WBGT[°C] PET [°C] PMV UTCI[°C]
Neutral Generally safe Unlimited/normal activity
<18 18 ÷ 23 -0.5 ÷ 0.5 9 ÷ 26
Warm Caution Increase exercise-to-rest ratio. Decrease
intensity and total duration of activity
18 ÷ 24
d
23 ÷ 35 0.5 ÷ 2.5 26 ÷ 32
Hot Extreme caution Activity of unfit, unacclimatized, high-
risk
b,c
subjects should be curtailed
24 ÷ 28 35 ÷ 41 2.5 ÷ 3.5 32 ÷ 38
Very hot Danger Activity for all except well acclimatized
should be stopped
28 ÷ 30 >41 >3.5 38 ÷ 46
Sweltering Extreme danger Cancel or stop all practice and
competition
>30
e
>46
a
Alert description/recommended sport activity for WBGT
b
While wearing shorts, t-shirt, ankle socks and sneakers
c
Internal heat production exceeds heat loss and core body temperature rises continuously without a plateau
d
Threshold (WBGT = 21°C) recommended by marathon organization in northern latitutdes
e
Threshold (WBGT > 30°C) recommended by most sporting governing bodies (i.e.: American College of Sport Medicine
[ACSM], International Tennis Federation [ITF], Women’s Tennis Association [WTA] and Fédération Internationale de Football
Association [FIFA])
Figure 8: PET and PMV thermal indices in the restore
period for Rio de Janeiro Barra area.
Figure 9: PET and PMV thermal indices in the effort
period for Rio de Janeiro Copacabana area.
In the early morning, as well as in the afternoon,
the indices show a comfortable situation from a
thermal comfort point of view.
Figure 10: PET and PMV thermal indices in the effort
period for Rio de Janeiro Barra area.
The values obtained in this analysis show that, in
the restore period, the clothing suites are to be
changed during the day moving from light gym suit
with a t-shirt to t-shirt and short pants.
Finally, the PET and the PMV values in the
effort period for Copacabana and Barra areas
(Section 2.3.2) are shown in Figure 9 and Figure 10.
Also for the effort period, the maximum values
of the PET and the PMV are confirmed between
12.00LT ÷ 13.00LT (PET = 27 ÷ 30°C; PMV = 3.2
÷ 3.7).
It is possible to note as the PET values during the
effort period are similar to the PET values during the
restore period. These results are function of a correct
choice of clothing that the athletes have to use
during the race and the restore period (Section
2.3.2).
Analysis of Thermal Comfort for Cycling Sport: A Case Study for Rio de Janeiro Olympic Games
287
However the PMV values in the effort period are
higher than the PMV values of the restore period.
Generally it is possible to observe as the maximum
values of the PET and PMV indices correspond to a
“caution – extreme caution” alert description
recommended for sporting activity for WBGT.
The same recommendations show that, in these
conditions, it is important to increase the exercise-
to-rest ratio as well as to decrease the intensity and
the total duration of activity. In the same time it is
very important that the athletes are well acclimatized
and that they prepare a correct plan and strategy for
nutrition and hydration (pre-event, event, post-
event).
4 CONCLUSIONS
The analysis of the thermal comfort of the athletes
during the next Rio de Janeiro Olympic Games,
made with an innovative methodology, is presented
in this research. The calculations have been carried
out for the men's category of the cycling sport. The
meteorological data of a 20-year long period have
been collected for two monitoring stations that are
representative for the race areas (Time Trial and
Road Race). The data of the months of August have
been analyzed in order to create the wind roses and
the typical days of the main variables. Two thermal
comfort indices (PET and PMV) have then been
calculated considering also the clothing type and the
power generated during the exercise. They have
been determined for the time period 09-16 LT and
for the resting and effort phases of both races.
It is important to note how the presented
methodology can be generalized to other sport as
well as to other venues. In fact the presented
RayMan model takes into account the personal data
about the subject (weight, height, age and sex) as
well as the internal heat production (W)
consequential to her/his physical activity.
Then it will be possible to change these reference
data to adapt the methodology and the model to the
analysed sport.
Finally, in the future, it will be interesting to
quantify the thermal comfort of the athletes
measuring directly the skin’s temperature and the
skin’s humidity of the athletes (Pezzoli et al., 2012).
This innovation in the research will help to quantify
correctly the thermal comfort and to improve the
alert description and the recommended sporting
activity (Table 2).
For these reasons, the procedure described in this
study gives useful information about the most
suitable clothing type for affording the race. The
results are also useful for defining pre, during and
post-race nutrition and hydration plans.
REFERENCES
Blazejczyk, K., Epstein, Y., Jendritzky, G., Staiger, H.,
Tinz, B., 2012. Comparison of UTCI to selected
thermal indices. Int. J. Biometeorol., 56:515-535.
Brandenburg, C., Matzarakis, A., Arnberger, A., 2007.
Weather and cycling – a first approach to the effects of
weather conditions on cycling. Meteorological
Applications, 14:61-67.
Brocherie, F., Girard, O., Millet, G.P., 2015. Emerging
environmental and weather challenges in outdoor
sports. In Climate – Special Issue “Climate Impacts on
Health”, Pezzoli, A., Editor. MDPI: Basel,
Switzerland, 3:492-521.
Brocherie, F., Girard, O., Pezzoli, A., Millet, G.P., 2014.
Outdoor exercise performance in ambient heat: time to
overcome challenging factors? Int. J. Hyperthermia,
30(8):547-549.
Brocherie, F., Millet, G.P., 2015. Is the Wet-Bulbe Globe
Temperature (WBGT) Index relevant for exercise in
the heat? Sports Med., DOI 10.1007/s40279-015-
0386-8.
Brode, P., Fiala, D., Blazejczyk, K., Holmer, I.,
Jendritzky, G., Kampmann, B., Tinz, B., Havenith, G.,
2012. Deriving the operational procedure for the
Universal Thermal Climate Index (UTCI). Int. J.
Biometeorol., 56:481-494.
Enviroware, 2015. Available online: http://www.enviro
ware.com/portfolio/windrose-pro3/ (accessed on 13
September 2015).
Lucia, A., Joyos, H., Chicarro, J.L., 2000. Physiological
response to professional road cycling: climber vs. time
trialist. Int. J. Sports Med., 21-7:505-512.
Jendritsky, G., Maarouf, G., Fiala, D., Staiger, H., 2002.
An up-date on the development of a universal thermal
climate index. In Proceedings of the 15
th
Conference
on Biometeorology/Aerobiology and 16
th
International
Congress of Biometeorology, Kansas City, MO, USA,
27 October – 1 November 2002.
Matzarakis, A., Mayer, H., Iziomon, M.G., 1999.
Application of a universal thermal index:
physiological equivalent temperature. Int J.
Biometeorol., 43:76-84.
Matzarakis, A., Rutz, F., Mayer, H., 2007. Modelling
Radiation fluxes in simple and complex environments
– Application of the RayMan model. Int J
Biometeorol., 51:323-334.
Matzarakis, A., Rutz, F., Mayer, H., 2010. Modelling
Radiation fluxes in simple and complex environments:
basics of the RayMan model. Int J Biometeorol.,
54:131-139.
Pezzoli, A., Baldacci, A., Cama, A., Faina, M., Dalla
Vedova, D., Besi, M., Vercelli, G., Boscolo, A.,
Moncalero, M., Cristofori, E., Dalessandro,, M.,
WPPDSports 2015 - Special Session/Symposium on Weather, Position and Performance data in Outdoor Sports
288
2013. Wind-wave interactions in enclosed basins: The
impact on the sport of rowing. In Sport Physics,
Clanet, C., Editor. Ecole Polytechnique de Paris: Paris,
France, 139–151.
Pezzoli, A., Bellasio, R., 2014. Analysis of Wind Data for
Sports Performance Design: A Case Study for Sailing
Sports. Sports. 2(4):99-130.
Pezzoli, A., Cristofori, E., Gozzini, B., Marchisio, M.,
Padoan J., 2012. Analysis of the thermal comfort in
cycling athletes. Procedia Engineering, 34:433-438.
Pezzoli, A., Cristofori, E., Moncalero, M., Giacometto, F.,
Boscolo, A., Bellasio, R., Padoan, J., 2015. Effect of
the environment on the sport performance: computer
supported training – A case study for the cycling
sports. In Sport Science Research and Technology
Support, Cabri, J., Pezarat Correia, P., Barreiros, J.,
Editors. Springer: London, UK, 1-16.
Rio de Janeiro Olympic Games Organizing Committee.
Available on-line: http://www.rio2016.com/mapa-de-
instalacoes (accessed on 20 September 2015).
UCI, 2015. Available on-line: http://www.uci.ch/
road/ucievents/2016-road-olympic-games/196852016/
(accessed on 19 September 2015).
Analysis of Thermal Comfort for Cycling Sport: A Case Study for Rio de Janeiro Olympic Games
289
