
InterCriteria Software Design: Graphic Interpretation
within the Intuitionistic Fuzzy Triangle
Deyan Mavrov
1
, Irina Radeva
2
, Krassimir Atanassov
3
, Lyubka Doukovska
2
and Ivan Kalaykov
4
1
Prof. Dr. Asen Zlatarov University
1 Prof. Yakimov Blvd., 8010 Burgas, Bulgaria
dg@mavrov.eu
2
Institute of Information and Communication Technologies, Bulgarian Academy of Sciences
Acad. G. Bonchev str., bl. 2, 1113 Sofia, Bulgaria
iradeva@iit.bas.bg, doukovska@iit.bas.bg
3
Institute of Biophysics and Biomedical Engineering, Bulgarian Academy of Sciences
Acad. G. Bonchev str., bl. 105, 1113 Sofia, Bulgaria
krat@bas.bg
4
Örebro University, School of Science and Technology
SE-701 82 Örebro, Sweden
ivan.kalaykov@oru.se
Keywords: InterCriteria Analysis, Software design, Software implementation, Intuitionistic fuzzy sets, Index matrix.
Abstract: The InterCriteria Analysis (ICA) method offers an interesting new way for pairwise comparison of criteria
among a set of criteria, against which a set of objects have been evaluated. This has been designed as a
completely data driven method, which requires real data to practically see effect of its application.
A specialized software application has been developed, which requires as input one two-dimensional array
of data of the evaluation of the set of m objects against the set of n criteria, and after processing returns as
output two n×n tables, the first of which contains the membership parts, and the second – the non-
membership parts of the intuitionistic fuzzy pairs that define the degrees of correlation between any two
criteria in the set of criteria. Having presented the implementation of the basic ICA algorithm in (Mavrov,
2015), we present here a recently developed additional feature for graphical interpretation of the results of
ICA, plotted as points in the Intuitionistic Fuzzy Interpretational Triangle, which reflects in the software
application the new theoretical developments of the ICA approach, as discussed in (Atanassova, 2015).
1 INTRODUCTION
The novel InterCriteria Analysis (ICA) method was
proposed in (Atanassov, et al, 2014) and
significantly developed in a series of publications,
including (Atanassova, et al, 2014a, 2014b, 2014c),
(Atanassova, 2014) and others in (InterCriteria
Research Portal, 2015).
Along with its theoretical development and
search of testing datasets for approbation and app-
lication of the approach, intensive work has started
on the software implementation of the ICA. In
(Atanassova, 2015) the basic algorithm’s implem-
entation has been presented, and here we continue
with presentation of a new phase of development of
the ICA software, using functionalities for graphic
output and human-machine interaction with the ICA
results.
The ICA offers an interesting new way for
comparison of the individual criteria among a set of
criteria, against which a set of objects have been
evaluated. This has been designed as a completely
data driven method, which requires real data to
practically see effect of its application. The algo-
rithm, and the software application, require as input
one two-dimensional array of data of the
279
Mavrov D., Radeva I., T. Atanassov K., Doukovska L. and Kalaykov I.
InterCriteria Software Design - Graphic Interpretation within the Intuitionistic Fuzzy Triangle.
DOI: 10.5220/0005888202790283
In Proceedings of the Fifth International Symposium on Business Modeling and Software Design (BMSD 2015), pages 279-283
ISBN: 978-989-758-111-3
Copyright
c
2015 by SCITEPRESS – Science and Technology Publications, Lda. All rights reserved
evaluations, or measuring, of a set of m objects
against a set of n criteria. As a result of application
of the algorithm, we expect a new table, n×n, which
contains intuitionistic fuzzy pairs that define for
each pair of criteria the degree of membership and
non-membership of the IF correlation between the
two criteria in the pair of criteria. In our implement-
ation, for the needs of more handy operation, the
result is returned in the form of two output n×n
tables, the first of which contains only the member-
ship parts, and the second one – only the non-
membership parts of these Intuitionistic fuzzy pairs.
2 LANGUAGE AND LIBRARIES
For reader’s convenience, here we will again, after
(Mavrov, 2015), present the basic prerequisites for
the software application: the programming language
and the libraries that have been employed in the
process of development.
The application is developed using the C++ pro-
gramming language. The development environment
is Microsoft Windows. For compiler, the standard
programme CL.exe from the Visual C++ 2012 has
been used, without using the Visual Studio graphic
environment.
Based on previous experience, the Qt library was
chosen for the application’s graphical interface. Qt
offers classes, which help building the on-screen
graphic objects, as well as classes for non-graphic
objects like (strings, database connections, etc.).
Each Qt class object can interact with the rest
objects, using a system of signals and slots, and
sending a signal from one object can be connected to
another object’s slot. The Qt library is cross-
platform library, which works with a variety of
operating systems and compilers, and in case that
only the standard Qt classes are used, an application
designed under Windows, can get compiled under
Linux with almost no changes. Moreover, the Qt
project includes a C++ program development
environment, Qt Creator. It offers a visual editor for
design of windows, which significantly facilitates
the use of the graphic interface.
The remaining important details of the basic
software implementation, like format of the input
data, the design of the main module of the program,
basic functionalities like reading of the input data,
processing of these data and calculation of the IF
values, as well as the output of the result, have been
discussed in details in (Mavrov, 2015) and will not
be repeated here.
3 MODULE FOR ICA RESULTS’
GRAPHIC VISUALIZATION
The Qt library allows working with two dimensional
graphics, by using the classes QGraphicsView
and QGraphicsScene. They allow on screen
visualization of various forms and shapes, using
lines, circles and other objects. For this aim, in a
new class for window, called IFS_Triangle, an
object from the new class IFS_GraphicsView is
being imported, which inherits QGraphicsView.
Creating own inheriting class for the graphic
window, allows higher flexibility in drawing the
objects. The graphic window opens after clicking on
the ‘Graphic’ button.
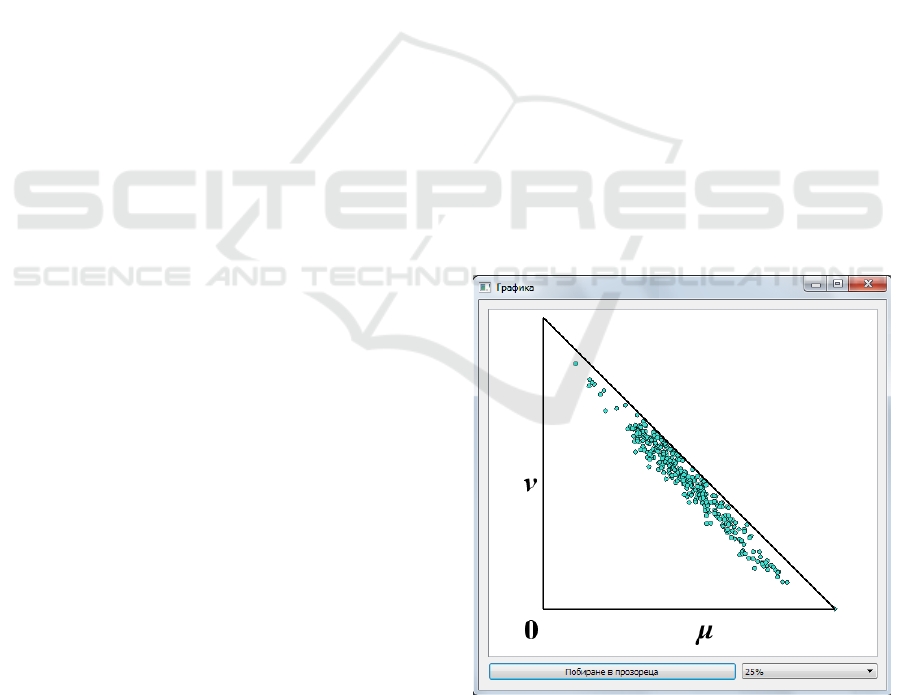
The visualization of the results obtained after
applying the ICA algorithm over input data, requires
us to use the intuitionistic fuzzy triangle, see
(Atanassov, 1989), (Atanassov, 1999), (Atanassov,
2012). It is a triangle from the Euclidean place, with
vertices (0, 0), (1, 0) and (0, 1), where the
intuitionistic fuzzy membership part μ is plotted
along the abscissa, and the non-membership part ν –
is plotted along the ordinate. Thus, the maximal
value for each of these variables is 1, with the
classical ‘Truth’ being plotted into the (1, 0) point,
and the classical ‘Falsity’ being plotted into the (0,
1) point, while the (0, 0) point stands for the
complete Uncertainty.
Figure 1: Graphics of the points, staying for the
intuitionistic fuzzy pairs of InterCriteria consonances.
Fifth International Symposium on Business Modeling and Software Design
280
The triangle (see Figure 1) is being rendered
using the embedded class QGraphicsPolygonItem,
which is intended for plotting polygons. There are
also classes for visualization of points, but in
expected cases of multiple points (which will
significantly load the memory), the points are
directly drawn onto the background of the graphic
window. The duplicating points are removed in
advance, for the aim of improving the performance.
The drawing itself is controlled by the class of the
central window, since there are the input and output
data stored.
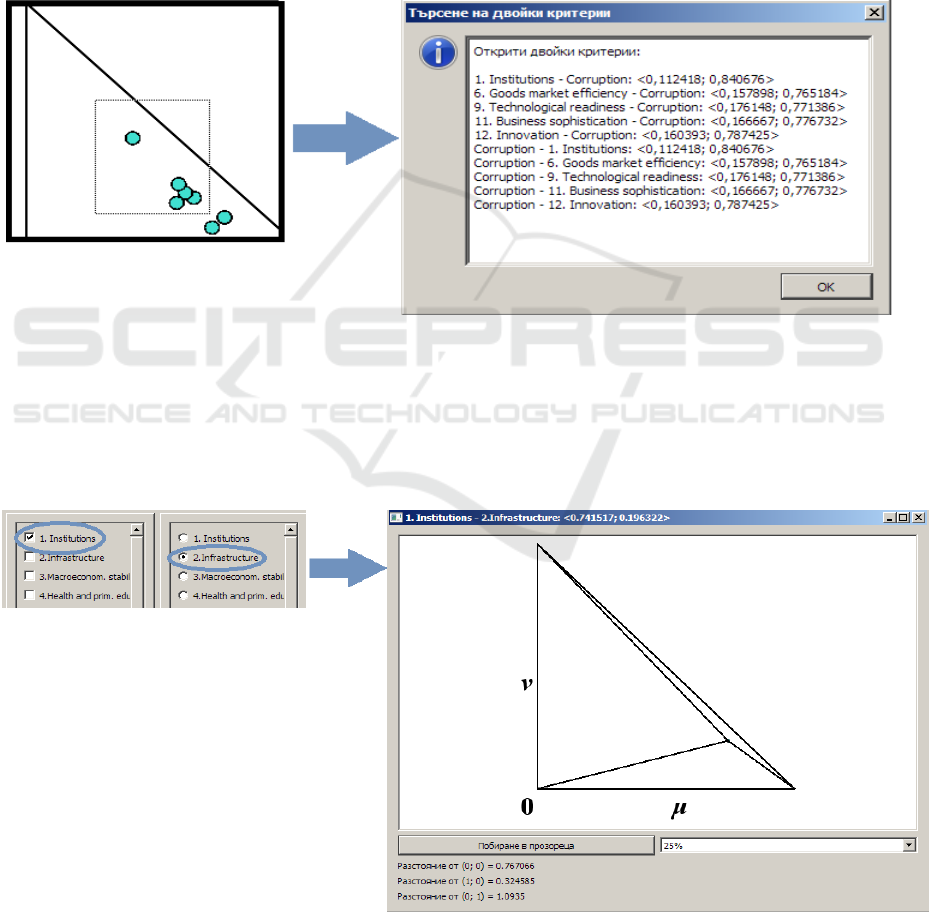
The graphic window permits scaling. Moreover,
if we want to check which pairs of criteria form a
given point, or a given area of points from the IF
triangle, we can drag with the mouse a rectangular
area around the desired points, as shown in Figure 2.
After this selection has been made, a pop-up
window appears with the names of the detected
points, i.e. pairs of criteria, as well as the values of
their coordinates, the IF membership and non-
membership factors.
Figure 2: Search for pairs of criteria, using the graphic visualization of the ICA results.
On the other hand, it can be sometimes useful to
draw the lines that connect a point in the IF triangle,
with the triangle’s vertices, together with calculation
the distances of that point from the three vertices.
This option is activated with the button ‘Distance
from vertices’, as presented in Figure 3.
Figure 3: Rendering a point and its distances from the three vertices of the IF triangle.
InterCriteria Software Design: Graphic Interpretation within the Intuitionistic Fuzzy Triangle
281
For this aim, it is necessary to pre-select two
criteria, whose InterCriteria consonance, in the form
of an IF pair, will determine the coordinates of the
point. The utilized graphic window here is the same,
with additional lines connecting the point with the
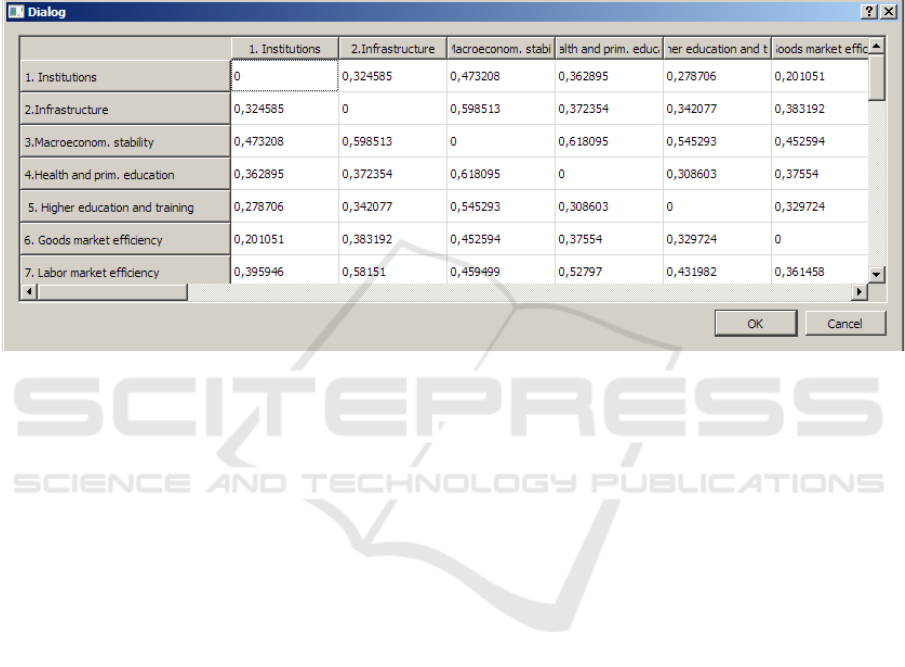
vertices, and the calculated distances. If this view
does not give enough information, the program
includes options that provide an overview of all
distances from all InterCriteria points to the
triangle’s vertices, as presented in tables related to
each vertex. These tables are opened via a separate
window using the buttons ‘Distance from [vertex
coordinates]’ in the main window. To save time, the
values here are calculated in real time only for the
visible cells from the table. The table of distances
from (1, 0) is illustrated in Figure 4.
Figure 4: Distances of all points from the vertex (1, 0) of the triangle.
4 CONCLUSION
The aim of this paper is to describe the software
design and implementation of one important aspect
of the theory of ICA which has been recently
developed theoretically (Atanassova, 2015), and was
shown to provide an alternative, and in some
situations better analysis of the results of the ICA.
Discussing the software implementation of the
ICA approach is considered by our team important,
because this allows reproducibility of the results,
obtained with the ICA method.
If necessary, other functionalities are also
possible, among which selection of consonance
thresholds, in order to sieve the criteria that are in
highest positive consonance with each other. In the
present form, the application can be successfully
used for analysis of new data, for detecting known
correlations, and discovery of new, previously
unknown correlations and knowledge.
ACKNOWLEDGEMENTS
The research work reported in the paper is partly
supported by the project AComIn “Advanced
Computing for Innovation”, Grant № 316087,
funded by the FP7 Capacity Programme (Research
Potential of Convergence Regions) and partly
supported under the Project № DFNI-I-02-5/2014.
REFERENCES
Atanassov, K. (1989). Geometrical interpretations of the
elements of the intuitionistic fuzzy objects. Pre-print
IM-MFAIS-1-89, Sofia.
Atanassov, K. (1999). Intuitionistic Fuzzy Sets: Theory
and Applications. Physica-Verlag, Heidelberg.
Atanassov, K. (2012). On Intuitionistic Fuzzy Sets
Theory. Springer, Berlin.
Atanassov K, D. Mavrov, V. Atanassova (2014).
InterCriteria decision making. A new approach for
multicriteria decision making, based on index matrices
and intuitionistic fuzzy sets. In: Issues in Intuitionistic
Fuzzy Sets and Generalized Nets, vol. 11, pp. 1–8.
Fifth International Symposium on Business Modeling and Software Design
282

Atanassova V., L. Doukovska, K. Atanassov and D.
Mavrov (2014a). InterCriteria Decision Making
Approach to EU Member States Competitiveness
Analysis. Proc. of 4th International Symposium on
Business Modeling and Software Design, 24–26 June,
Luxembourg, pp. 289–294.
Atanassova, V., L. Doukovska, D. Mavrov, K. Atanassov
(2014b). InterCriteria Decision Making Approach to
EU Member States Competitiveness Analysis:
Temporal and Threshold Analysis. P. Angelov et al.
(eds.), Intelligent Systems’2014, Advances in
Intelligent Systems and Computing, vol. 322, pp. 95–
106.
Atanassova, V., L. Doukovska, D. Karastoyanov, F.
Capkovic (2014c). InterCriteria Decision Making
Approach to EU Member States Competitiveness
Analysis: Trend Analysis. P. Angelov et al. (eds.),
Intelligent Systems’2014, In: Advances in Intelligent
Systems and Computing, vol. 322, pp. 107–115.
Atanassova V., D. Mavrov, L. Doukovska and K.
Atanassov (2014). Discussion on the threshold values
in the InterCriteria Decision Making approach. Notes
on Intuitionistic Fuzzy Sets, vol. 20, №2, pp. 94–99.
Atanassova, V., I. Vardeva (2014). Sum- and average-
based approach to criteria shortlisting in the
InterCriteria Analysis. Notes on Intuitionistic Fuzzy
Sets, vol. 20, 2014, № 4, pp. 41–46.
Atanassova V. (2015). Interpretation in the Intuitionistic
Fuzzy Triangle of the Results, Obtained by the
InterCriteria Analysis, IFSA-EUSFLAT 2015, Gijon,
Spain. (submitted).
InterCriteria Research Portal (2015). http://www.
intercriteria.net/publications.
Mavrov, D. (2015). Software for InterCriteria Analysis:
Implementation of the Main Algorithm. Proc. of 19
th
International Conference on Intuitionistic Fuzzy Sets.
Notes on Intuitionistic Fuzzy Sets, vol. 21 (accepted).
InterCriteria Software Design: Graphic Interpretation within the Intuitionistic Fuzzy Triangle
283
