
Route Recommendation Algorithm for Railway Transit Travelers
based on Classification of Personal Characteristics
Yan Hong and Du Xiaoping
Software College of Beihang University, Beijing 100191, China
Keywords: Urban Railway Traffic, Route Selection, Traveler Classification.
Abstract: With the rapid development of urban rail transit network, traveler’s route decision become more difficult to
make and travelers’ route preferences vary with their characteristics. This study proposed a route recom-
mendation algorithm with the least generalized travel cost based on the classification of traveler’s personal
characteristic. The generalized travel cost model was established with the consideration of LOS variables
(e.g. in-vehicle time, transfer time, number of transfers, in-vehicle traveler density, etc) and then a traveler
classifier was constructed based on the K- nearest neighbor algorithm by machine learning how travelers’
characteristics affect their route choice intentions, thus the optimal route with the least generalized cost for
each type of travelers being generated. Finally, the model and algorithm were verified to be valid with the
data from Beijing subway network.
1 INTRODUCTION
As the rail transit network has formed in more and
more cities and the seamless transfer operation mode
is adopted, travelers will have multiple route choices
between a pair of OD (origin to destination). The
traditional route selection algorithm couldn’t meet
different route preferences of different travelers with
different characteristics. In recent years many schol-
ars have studied on the problem of traveler’s route
selection problem in urban rail transit network, such
as Zhang designed the route planning algorithm
based on the MNL (Multinomial Logit) model
(Zhang Y S, Yao Y, 2013), Zhao Nan
studied the
multi route selection problem of Shenzhen rail transit
based on the normal distribution model (ZHAO Nan,
LI Chao, 2012) and Liu
constructed a personalized
route planning algorithm for rail transit travelers
combined with travelers’ attributes based on the
MNL model (Liu Sha-sha, Yao En-jian, Zhang
Yong-sheng, 2014). However none of these studies
focused on how travelers’ attributes affect their route
choice intention. So this paper extended the method
of existing route planning algorithm by combining
with the construction of a traveler classifier based on
the K nearest neighbor algorithm, which at the same
time reconstructed the generalized travel cost model
taking into consideration the factors of pass-ups,
transfer time and in-vehicle traveler density.
2 GENERALIZED TRAVEL COST
MODEL FOR SUBWAY TRAV-
ELERS
Under the condition of seamless transfer, the route
selection problem in urban rail transit network is a
decision making problem from behavioral science. In
order to simulate the traveler’s selection behavior,
we can define a generalized travel cost for each route
(Si Bing-feng, Mao Bao-hua, Liu Zhi-li, 2007),
which take into consideration all the factors
concluded when a traveler select a route. The
Modeling process of the generalized travel cost is as
follows.
Suppose that Fare is the generalized travel cost of
a route between the OD pair, n stands for the transfer
station, N represents the transfer times and i
represents the section between two sites on the route.
Fare can be made up of two parts, the basic time T
and the extra cost E.
Fare = T + E
(1)
The basic time T includes the in-vehicle time
in veh
t
−
and the transfer time
trans
t
. Transfer time
120
120
Xiaoping D. and Hong Y.
Route Recommendation Algorithm for Railway Transit Travelers based on Classification of Personal Characteristics.
DOI: 10.5220/0006020201200125
In Proceedings of the Information Science and Management Engineering III (ISME 2015), pages 120-125
ISBN: 978-989-758-163-2
Copyright
c
2015 by SCITEPRESS – Science and Technology Publications, Lda. All rights reserved

consists of transfer-walking time
n
e
and platform-
waiting time
n
w
, as follows.
in veh trans
T t t
−
= +
(2)
(
)
trans n n
n
t e w
= +
∑
(3)
In formula (3), e
n
stands for the transfer-walking
time in transfer station n and w
n
represents the
platform-waiting time, which is related to the
average departure interval Tn and the average
number of pass-ups j
n
.
(
)
1 2
n n n
w j T
= + ⋅
(4)
The extra cost is generated by transfer and
congestion. Suppose that e
trans
and e
comf
represent
the cost from transfer and congestion, as follow.
trans conmf
E e e
= +
(5)
The transfer will generate extra cost for it takes
physical energy so that travelers have the fear to do
it. According to the result of the questionnaire of
traveler’s trip characteristics in urban rail transit,
which was part of the 2014 rail transit passenger
flow investigation project, different travelers have
different expect to the reduced travel time of
increasing a transfer. The one who pursues faster
expects less, quite proportion of them would choose
the option of “5 minutes”, meaning that they’d rather
sacrifice the comfort to save time. At the meanwhile
the one who pursues a minimum of transfers or most
comfort in vehicle would choose the longer time
such as “10 minutes”. So the transfer cost can be
expressed as follow:
trans
e N
α
= ⋅
(6)
The parameter
α
indicates the expected reduced
time when a traveler increases a transfer.
Congestion in vehicle will also generate extra
cost. According to the research, the comfort level in
vehicle can be determined by the density of standing
travelers
, which can be divided as follows:
Comfort standard: 0-3.5 people/m
2
. Passengers
can move freely feeling comfortable and satisfied.
Moreover there is a great chance to have a seat
during the trip.
Congestion standard: 3.5-7.5 people/m
2
. The
congestion generates some cost.
Excess capacity standard: 7.5 people/m
2
and
above. Passengers will feel obviously crowded.
Standing passengers will breakthrough into the
seating area so that seating passengers will also feel
inconvenience. Congestion now generates larger
cost.
Now suppose
ρ
represents the density of
standing travelers and the unit is people/m
2
. Mi
stands for the extra cost caused by congestion during
interval i. Congestion cost
comf
e
can be expressed
as follows.
comf i
i
e M
=
∑
(7)
0; 3.5
;3.5 6.5
; 6.5
i
M
ρ
β ρ
ω ρ
<
= ≤ <
≥
(8)
In the formula above
β
and
ω
respectively
represents the cost in congestion standard and excess
capacity standard during interval i.
3 CLASSIFICATION OF TRAV-
ELERS’ ROUTE CHOICE IN-
TENTION
In this section, we first classified the traveler’s route
choice intention into 3 types, based on which the
parameters of generalized travel cost model were
defined. Then by using the method of machine
learning, we studied how to classify the travelers'
route choice intention according to the travelers'
attributes. Finally the steps of classify algorithm of
the travelers were given based on the K nearest
neighbor algorithm.
This paper deeply analyzed the questionnaire of
traveler’s trip characteristics in urban rail transit.
The questionnaire contents include travelers’
attributes, trip characteristics and route choice
intention. About the route choice intention 3 options
were set: “shortest time”, “transfer least” and “most
comfortable in-vehicle”, respondents were asked to
sort the weight of the 3 factors when making a route
decision. In the real situation travelers often don’t
take only a single factor as a comprehensive
consideration, so we made statistics by two priority
factors considered by travelers: 34% gave priority to
the factors of time and transfer, among those many
had a medium or a short trip distance or in purpose
of commuting; 15% gave priority to the factors of
transfer and comfort, most of them were not in
purpose of commuting or they are elder people; 12%
gave priority to the factors of time and comfort, most
Route Recommendation Algorithm for Railway Transit Travelers based on Classification of Personal Characteristics
121
Route Recommendation Algorithm for Railway Transit Travelers based on Classification of Personal Characteristics
121
of them were in purpose of commuting and had a
longer trip distance. So the three categories were got
and for each type of travelers we defined the
parameter values of the generalized cost model
based on the questionnaire, results are in table 1.
Table 1: Generalized travel cost model parameter values of
3 categories of travellers.
Category
Priorities
α
β
ω
A time; transfer 5 0 0
B transfer; comfort
10 0.5 1
C time; comfort 0 1 2
Two types of traveler characters affect their route
choice intention: travelers’ own attributes and trip
characteristics. Travelers’ own attributes include
age, gender, and personality and so on. Personality
factor are more random so it is excluded from the
study. Travelers’ trip characteristics include travel
distance and purpose. Then we need to construct a
classifier to input the traveler’s characteristics and
output the type of traveler’s route choice intention.
The input characteristics of this paper are: age,
gender, travel purpose and travel distance.
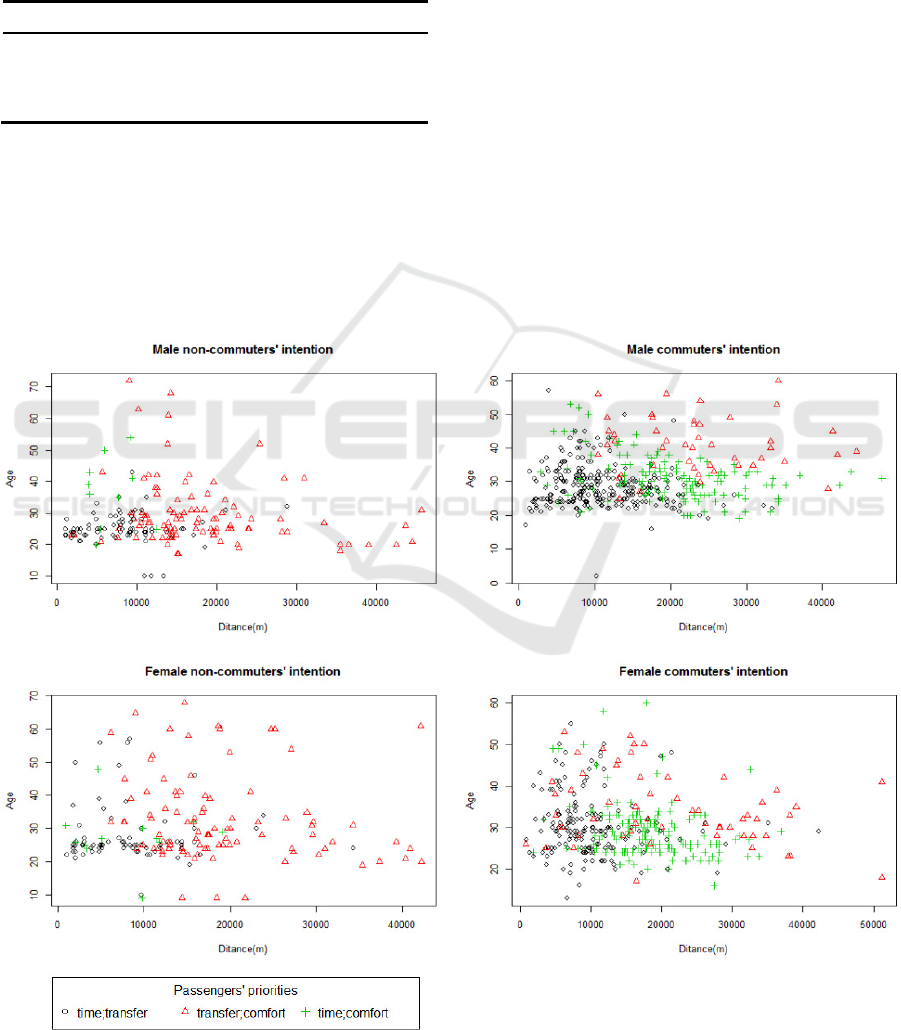
Considering different travelers with different
gender have different feelings about the distance and
comfort and the sample under different travel
purpose are obviously different, so we divided the
sample into four parts: male non-commuters, male
commuters, female non-commuters and female
commuters. Sample distributions are as figure 1.
From the figure above something can be seen,
such as the elderly female tend to choose more
comfortable route, while young man would pursue
faster route, far distance would make travelers
choose more comfortable route and commuters
would choose a route in a shorter time.
Considering age and distance are continuous
variables, KNN algorithm was used respectively for
the four sample sets to construct the classifier. KNN
algorithm works as follows: There is a training
sample set, and the relationship between each record
Figure 1: Travellers’ priorities in different sample sets.
ISME 2015 - Information Science and Management Engineering III
122
ISME 2015 - International Conference on Information System and Management Engineering
122

and its category label is known. Input new data with
no labels, compare the characteristics of each new
record with the data in the sample set, then the
algorithm extracts the new data’s category labels
according to the most similar data (nearest neighbor)
in the sample set. Generally speaking we only select
first k records most similar to the new record from
the sample set and k is usually an integer less than
20. Finally choose the most common category label
of the k similar records as the new record’s category
label.
In this paper, 90% of the existing data was used
as the training sample and the remaining 10% was
used as test the accuracy of the classifier. K was
valued 10. There will be some random error in the
classifier for the travelers’ route choice intention is
also influenced by the personalities and some
random factors. The final test results are shown in
Table 2, the error rate is within 20% in the four
sample sets so the classifier is considered valid.
Table 2: Test results of all kinds of samples.
No. Sample type Sample size Error rate
1 Male non-commuters 197 0.179
2 Male commuters 443 0.192
3 Female non-commuters
179 0.188
4 Female commuters 378 0.199
Thus traveler classification algorithm is as
follows:
Step 1 Input the age, gender, travel purpose and
distance of a traveler;
Step 2 Judge the training set type according to
travelers’ travel purpose and gender;
Step 3 Calculate the distance between the new
data point and the training data points in dimensions
of age and travel distance.
Step 4 Sort the distance by ascending order and
select the first 10;
Step 5 Confirm the categories of the 10 travelers’
route choice intention and return the final category
with the highest frequency.
4 PERSONALIZED ROUTE REC-
OMMENDATION ALGORITHM
Usually when travelers travel by rail transit they
don’t consider all the paths between the OD, instead
they only consider a part of them, which we call
effective path set. So the difficulty is to find the
effective path set. This paper searched the effective
path set based on the depth first traversal algorithm
and the basic idea is as follows: look for a path
connected from the OD which meets the constraints
based on the traversal algorithm; record the path if it
meets the conditions or go back to the father nodes
to traverse again if it doesn’t; repeat the trial of
selection and return until you find all the effective
paths.
In the establishment of effective path set, based
on the principle of least generalized travel cost, the
personalized route recommendation algorithm
proceeds as follows:
Step 1 Input the information of an OD and a
traveler’s age, gender, travel purpose and departure
time;
Step 2 Calculate the shortest distance and search
the effective path set between the OD.
Step 3 Input to the traveler classifier with
traveler’s attributes and trip characteristics and the
traveler’s category label will be output;
Step 4 According to the traveler’s category,
combined with the real-time traffic congestion data;
calculate the generalized travel cost of each effective
path.
Step 5 Select the one with the least cost in the
effective path set as the optimal route for the
traveler.
5 THE EXAMPLE ANALYSIS
In order to test the validity of the model and
algorithm, this paper selected the “Zhichun Road
Station to Songjiazhuang Station” as the OD pair
from the rail transit network in Beijing. Taking into
account that the degree of crowdedness varies with
the times of the day, this study chose the off peak
periods and the evening peak periods to analyze.
According to the algorithm there are 5 effective
paths:
Zhichun Road Station - No. 10 Line
(clockwise) - Songjiazhuang Station;
Zhichun Road Station - No. 10 Line
(counterclockwise) - Songjiazhuang Station;
Zhichun Road Station- No. 10 Line -
Huixinxijie Nankou Station - No. 5 Line -
Songjiazhuang Station;
Zhichun Road Station - No. 13 Line -
Xizhimen Station - No. Line 4 - Jiaomen West
Station - No. 10 Line - Songjiazhuang Station;
Route Recommendation Algorithm for Railway Transit Travelers based on Classification of Personal Characteristics
123
Route Recommendation Algorithm for Railway Transit Travelers based on Classification of Personal Characteristics
123
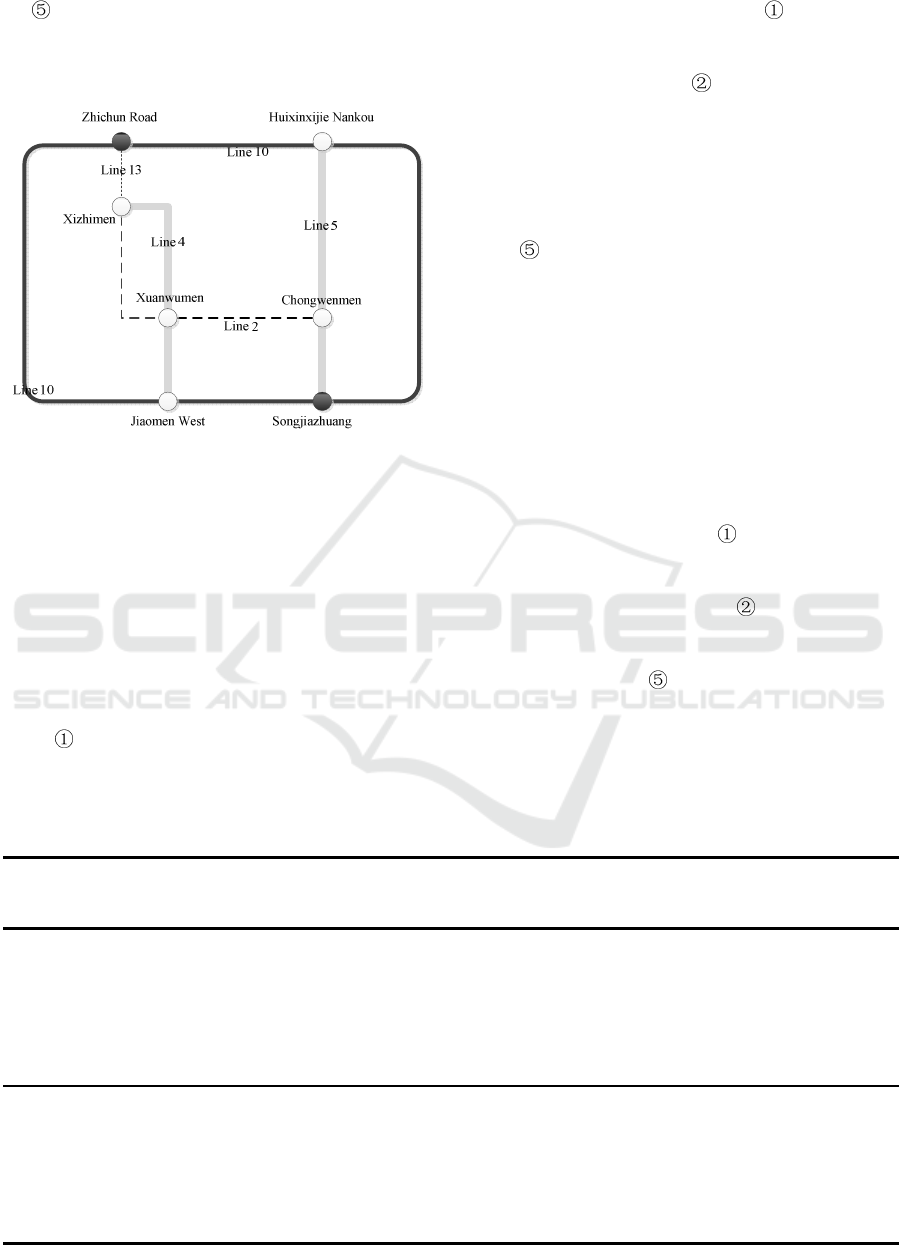
Zhichun Road Station - No. 13 Line -
Xizhimen Station - No. 2 Line - Chongwenmen
Station - No. 5 Line - Songjiazhuang Station.
The network is shown in Figure 2.
Figure 2: Part of the Beijing rail transit network.
For easily express, the three types of generalized
travel cost model are numbered with letters: A,
giving priority to time and transfer factor; B, giving
priority to transfer and comfort factor; C, giving
priority to time and comfort factor. Table 3 shows
the basic data and Table 4 shows the results
calculated of the three type’s model in the two
periods and five routes.
It can be seen that in the evening peak period the
optimal route of all the three traveler categories is
route , this is because in the evening peak all
metro lines are crowded and line 5 and line 4 are
particularly serious, so no transfer and relatively
light congestion makes path the most
reasonable. In the off peak hours, the best choice for
B type travelers (giving priority to transfer and
comfort factor) is route , for in this moment
vehicles in this direction of line 10 have lower
passenger density than other lines and passengers
have a great chance to have seats, so it is a good
choice for people who pursue a comfortable travel.
In the off peak period, the optimal route of the C
type traveler (giving priority to time and comfort) is
path , on which the sites are fewest and the
passenger density is low, so it is a good choice for
people who is in a hurry and doesn’t like feeling
crowded.
The OD pair Songjiazhuang Station to Zhichun
Road Station and a group of random information of
travelers were put into the algorithm and the results
are shown in Table 5. The distance of this OD is
quite far, so the algorithm is humanized for travelers
to consider the factors of transfer and comfort. It can
be seen that when travelers are not commuters the
algorithm classify them as type B (giving priority to
transfer and comfort), path which is none of
transfer and relatively faster and less of congestion is
recommended to them in the evening peak periods
while in the off peak hours path which is none of
transfer and congestion is recommended. When
travelers in the off peak time and in purpose of
commuting, the path which is the shortest with a
high probability to have seats is recommended. The
result varies with individuals and times, which shows
the humanization and rationality of the algorithm.
Table 3: Basic data of 5 effective paths in different times.
Period
Route
No.
Distance[km]
Transfer
times
Sites on
route
In-vehicle
time[min]
Transfer
time[min]
Average density in-
vehicle[people/m
2
]
Off peak
hours
1 25389 0 22 50.6 0 3.74
2 28174 0 23 52.9 0 2.8
3 21562 1 20 45 1.75 4.25
4 21108 2 17 41 7.25 4.17
5 19925 2 15 38 9 3.21
Evening
peak hours
1 25389 0 22 50.6 0 4.35
2 28174 0 23 52.9 0 4.25
3 21562 1 20 45 15 5.83
4 21108 2 17 41 11.5 6.02
5 19925 2 15 38 15 3.75
ISME 2015 - Information Science and Management Engineering III
124
ISME 2015 - International Conference on Information System and Management Engineering
124
Table 4: Calculated costs of the three traveler types based on Table 3.
Period
Route
No.
T
trans
e
conmf
e
Fare
A B C A B C A B C
Off
peak
hours
1 50.6 0 0 0 0 11 22 50.6 61.6 72.6
2 52.9 0 0 0 0 2 4 52.9 54.9 56.9
3 46.75 5 10 0 0 10 20 51.75 66.75 66.75
4 48.25 10 20 0 0 8.5 17 58.25 76.75 65.25
5 47 10 20 0 0 4 8 57 71 55
Evening
peak
hours
1 50.6 0 0 0 0 11 22 50.6 61.6 72.6
2 52.9 0 0 0 0 11.5 23 52.9 64.4 75.9
3 60 5 10 0 0 17 34 65 87 94
4 52.5 10 20 0 0 14 28 62.5 86.5 80.5
5 53 10 20 0 0 10 20 63 83 73
Table 5: Calculated results based on randomized traveler information.
Period No. Gender Age Commuters or not Traveler category Optimal route
Off peak hours
1
female 26 no B 2
2
male 45 no B 2
3
male 28 yes C 5
Evening peak hours
4
male 23 yes C 1
5
female 35 no B 1
6 SUMMARY
This paper firstly defined the generalized travel cost
model considering the factors of crowded degree at
different times, transfer and pass-ups and so on.
Then Based on the research on the influence of the
travelers' characteristics on their route choice
intentions, the traveler classifier was constructed.
The classifier tested effective according to the
questionnaire data. On the basis of above, a route
recommendation algorithm for different types of
travelers was put forward. Through case analysis, the
method was proved to be reasonable.
REFERENCES
Zhang Y S, Yao Y. A route planning algorithm based on
subway traveler routes choice behavior analysis[C].
Proceedings of the Second International Conference
on Transportation Information and Safety. Wuhan,
China: American Society of Civil Engineers, 2013:
1972-1978.
ZHAO Nan, LI Chao. Research on Multi-route Selection
of Urban Rail Transit[J]. China Academy of Railway
Sciences, 2012(10): 72-76.
Liu Sha-sha, Yao En-jian, Zhang Yong-sheng. Personal-
ized Route Planning Algorithm for Urban Rail Transit
Travelers[J]. Journal of Transportation System Engi-
neering and Information Technology, 2014(5): 100-
104+132.
Si Bing-feng, Mao Bao-hua, Liu Zhi-li. Traveler Flow As-
signment Model and Algorithm for Urban Railway
Traffic Network under the Condition of Seamless
Transfer[J]. Journal of The China Railway Society,
2007(6): 12-18.
Route Recommendation Algorithm for Railway Transit Travelers based on Classification of Personal Characteristics
125
Route Recommendation Algorithm for Railway Transit Travelers based on Classification of Personal Characteristics
125
