
Research on Oil Flow Embodied in Export Trade of China
Keqiang Guo and Baosheng Zhang
School of Business Administration, China University of Petroleum, Fuxue Road 18, Changping, 102249 Beijing, China
guokeqiang@aliyun.com, bshshysh@cup.edu.cn
Keywords: Embodied Oil Flow, Export Trade, Input-Output Model, Structure Decomposition Analysis, China.
Abstract: In the past 20 years, China “leaked out” a large number of oil through exporting different kinds of products.
The amount and the pathway of oil flow embodied in China’s export trade are calculated by using the Input
Output Model and the Structure Decomposition Analysis. The total exported embodied oil has grown from
5 206 × 10
4
ton in 1997 to 15 547 × 10
4
ton in 2010, which account for a large percent of China’s domestic
oil consumption. The export scale effect is always the major part of positive promotion, while the
technology effect is the major part of negative influence. The export structure has lesser impacts, comparing
with the other two effects. The scale effect of Manufacture of equipment is the largest source for the
increment of exported embodied oil.
1 INTRODUCTION
After the accession to the World Trade Organization
(WTO), China’s integration with the global
economy has contributed to sustained growth in
international trade. Both its exports and imports
have grown faster during the past dozen years, while
China’s trade surplus increased dramatically.
Although this trend was affected by the international
financial crisis, the Chinese government has made
some plans recently to promote the economic
prosperity, including “the Silk Road Economic Belt
and the 21st-Century Maritime Silk Road” and
“Made in China 2025”, and so forth. Under these
background, China’s export trade will keep on
developing predictably. On one hand, the huge trade
surplus has brought China a great amount of foreign
exchange reserve; on the other hand, it also cost
China significant volumes of oil (X. Tang, B. Zhang,
L. Feng,2012), because all goods and services
produced in an economy are directly and/or
indirectly associated with oil use (G. Machado, R.
Schaeffer, and E. Worrell, 2001)
The debate on the impacts of international trade
on energy flow is not new. Many researchers have
studied the embodied energy imports or exports for a
number of countries and regions, such as, China, the
United Kingdom, and the United States, and so on.
These studies show that there are a lot of energy
flow embodied in the international trade, which is
not often considered and still not sufficiently clear.
China’s oil supply highly dependent on import,
and the gap between its consumption and production
has been increasing quickly. At the same time, with
the continued growth of international trade, China
are “leaking” a large number of oil through
exporting different kinds of products. It is significant
and urgent to answer the questions including, but are
not limited to: How many embodied oil are
exported? Which export sectors are most oil-
consuming? What is the major driving force factors
of the increase for the embodied oil export? The
aims of this paper focus on calculating the amount
and the pathway of oil flow embodied in China’s
export trade by using the Input Output Model and
the Structure Decomposition Analysis. The study
hopefully offer consultations for the development
and management of China’s international trade.
2 METHODOLOGY AND DATA
2.1 Basic Input Output Model
The Input-Output Analysis was firstly developed by
Leontief in the 1930s, which has been widely used
for analyzing the economic relationship of linkages
between different sectors. The basic Input Output
Model can be expressed as equation (1):
1
XAXY IAY
(1)
443
Zhang B. and Guo K.
Research on Oil Flow Embodied in Export Trade of China.
DOI: 10.5220/0006028204430447
In Proceedings of the Information Science and Management Engineering III (ISME 2015), pages 443-447
ISBN: 978-989-758-163-2
Copyright
c
2015 by SCITEPRESS – Science and Technology Publications, Lda. All rights reserved
443

Where, X and Y represent exogenous and
endogenous accounts respectively, I is identity
matrix, and A is the technical coefficient matrix that
can be expressed as equation (2):
ij
nn
Aa
(2)
Where, i = (1, n); j = (1, n); n is the count of sectors
in an economy system; a
ij
is the technical
coefficient, also called as direct consumption
coefficient, which can be expressed as equation (3):
ij
ij
j
x
a
x
(3)
Where, x
ij
is marked as sector j’s use of products
from sector i; and x
j
is marked as the total output of
sector j. The matrix (I-A)
-1
is often called Leontief
Inverse Matrix.
Another important conception in the basic Input
Output Model is complete consumption coefficient,
denoted by b
ij
, which measures how much direct and
indirect output from sector i will be used in sector j’s
one unit worth of value of final output. It can be
expressed as equation (4):
()
ij ij ik kj
k
ba ba
(4)
Where, k means the middle sector. If the complete
consumption coefficient matrix is set as B, i.e. B = (
b
ij
)
n×n
, the equation (4) can be solved and transferred
to equation (5):
1
()BIA I
(5)
2.2 Exported Embodied Oil Model
Based on the basic Input Output Model, the model
for calculating oil flow embodied in international
trade can be established as equation (6):
1
n
ii
i
E
OeoV
(6)
Where, EO is the amount of embodied oil in
international trade; eo
i
is the amount of embodied oil
in one unit worth of value of product i, i.e. embodied
oil intensity; V
i
is the total value of product i in
import or export trade.
Before calculation the technical coefficient
matrix A should be modified to eliminate the
influence of the processing and manufacturing trade,
for example, some products are made by imported
semi-finished products and be exported again after
assembled. Firstly, A can be distinguished to two
parts: the imported middle products part A
m
and the
domestic middle products part A
d
, i.e. A = A
m
+ A
d
.
Secondly, the import coefficient matrix M are set to
establish equation (7):
()
m
d
AMA
A
IMA
(7)
Where, M is a diagonal matrix that can measures the
dependence of sector i on the imported middle
products, and the element of the diagonal matrix,
marked as m
ii
, can be expressed as equation (8):
/( )
ii i i i i
mimXimex
(8)
Where, X
i
is total output value of sector i, im
i
is the
total import value of sector i and ex
i
is the total
export value of sector i. It is assumed in this analysis
that the share of imported products in every sector
are same. Finally, the model of calculating exported
oil flow embodied in international trade can be
expressed as equation (9):
1
1
()
n
d
ex i i
i
EO eo I A ex
(9)
2.3 Structure Decomposition Analysis
Based on the exported embodied oil model, the
structure decomposition analysis can be continued:
firstly, set t
i
= eo
i
(I – A
d
)
-1
, which is complete oil
consumption of sector i; secondly, set s
i
= ex
i
/ EX,
where ex
i
is the total export value of sector i as
mentioned above, EX is the total export value of the
country, and, so, s
i
is the share of sector i’s export
value on the total export of the country. Then, the
exported embodied oil of sector i can be transferred
to equation (10):
exi i i
EO t s EX
(10)
The amount of exported embodied oil are divided by
this equation into three parts: the complete oil
consumption coefficient, the structure of export and
the scale of export, which are called the technology
effect, the structure effect and the scale effect. The
change of the exported embodied oil from time t1 to
time t2 can be expressed as equation (11):
21
22 2 11 1
tt
tt t tt t
exi exi exi i i i i
EO EO EO t s EX t s EX
(11)
Equation (11) can be solved by using the
Logarithmic Mean Divisia Index (LMDI) method.
The solution are shown as equation (12):
ISME 2015 - Information Science and Management Engineering III
444
ISME 2015 - International Conference on Information System and Management Engineering
444

21
21
21
21
21 2 1
21
21
21
(, )ln(/)
(,)ln(/)
(, )ln( /)
(,)( )/ln(
tt
tt
tt
tt
tt t t t
eff eff eff
exi exi exi i i
eff t t
i exi exi i i
eff t t
i exi exi i i
eff t t
exi exi
exi exi exi exi exi
EO EO EO t s EX
t L EO EO t t
sLEOEO ss
EX L EO EO EX EX
LEO EO EO EO EO
21
/)
t
exi
E
O
(12)
Where,
eff
i
t ,
eff
i
s and
eff
EX mean the influence
effects of the change from technology, the structure
of export and the scale of export.
2.4 Data
The oil consumption and the total output value of
every industries, the technical coefficient matrix A
between all industries and the import and export
value of every industries are need to calculate the
embodied oil flow. The data above are available
from China’s statistical yearbooks and China’s Input
Output tables (1997, 2002 and 2007 are original
tables, 2000, 2005 and 2010 are extended tables)
that both released by the National Bureau of
Statistics of China. Classification of industries are
different between the two data sources, so it should
be modified for consistency. Fifteen industry sectors
are used in this study, as shown in Table 1.
Table 1: Modified Industry Sectors of China.
N
O. Industry Sector
1 Agriculture
2 Mining
3 Manufacture of food, beverages and tobacco
4
Manufacture of textile, wearing apparel, footwear, caps,
leather, fur, feather and related products
5 Other Manufacture
6 Production and supply of power, heat and water
7 Processing of petroleum
8 Chemical industry
9 Manufacture of non-metallic mineral products
10 Manufacture of metal products
11 Manufacture of equipment
12 Construction
13 Transportation, Postal, Telecommunication services
14 Wholesale and retail trades, Hotels and catering services
15 Real estate, Banking and insurance and other services
3 RESULTS AND ANALYSIS
3.1 Amount of Exported Embodied Oil
According to the model built above and annual data,
the amount of oil embodied in China’s export trade
of every industry sectors are calculated as shown in
Table 2. The total consumption of oil in China (DC,
Domestic Consumption) and the proportion of
exported embodied oil on DC are also displayed.
Table 2: Exported embodied oil and the share on domestic
consumption of sectors. The No. from 1 to 15 represent 15
industry sectors mentioned in Table 1. Unit: 10
4
Ton.
No. 1997 2000 2002 2005 2007 2010
1 49 745 62 49 41 48
2 237 242 234 199 111 72
3 93 111 114 144 141 155
4 508 6214 954 1197 1422 1389
5 243 226 428 590 591 649
6 16 0 13 13 11 10
7 712 525 784 1539 1196 1180
8 674 844 1232 1592 2011 2352
9 101 125 138 202 234 319
10 416 556 639 1030 1506 1084
11 1119 1704 2674 4142 4499 5389
12 8 9 36 38 62 131
13 249 275 652 1049 1212 1146
14 245 282 316 609 396 465
15 537 569 600 858 1061 1158
Total 5206 6164 8877 13250 14493 15547
DC 17367 21232 22541 30086 34032 42875
Share 30% 29% 39% 44% 43% 36%
Two sectors, No. 11 (Manufacture of equipment)
and No. 8 (Chemical industry), are the first and
second largest sources of exported embodied oil. In
2010, the amount of exported embodied oil of the
two sectors account for about 50% in total. There is
a clear increase trend of exported embodied oil for
the sector of Manufacture of equipment, and the
total increase rate between 1997 and 2010 is 382%,
which is larger than any other sectors.
It also can be seen from Table 2 that both the
total domestic consumption of oil and exported
embodied oil have massive growth from 1997 to
2010. The growth rate of exported embodied oil is
199%, which is larger than that of domestic
consumption (147%). In recent years, the percentage
of exported embodied oil is around 40%, which
means there are about 40% of China’s oil
consumption per year are contributed to other
countries through international trade. But the trend
has revealed a clear decline trend after 2005.
3.2 Influence Factors of Embodied Oil
Influence factors of the increase for exported
embodied oil are analyzed by using the Structure
Decomposition Analysis method. The results of the
analysis on embodied oil between 1997-2000, 2000-
2002, 2002-2005, 2005-2007 and 2007-2010 are
displayed in Figure 1-5.
Research on Oil Flow Embodied in Export Trade of China
445
Research on Oil Flow Embodied in Export Trade of China
445
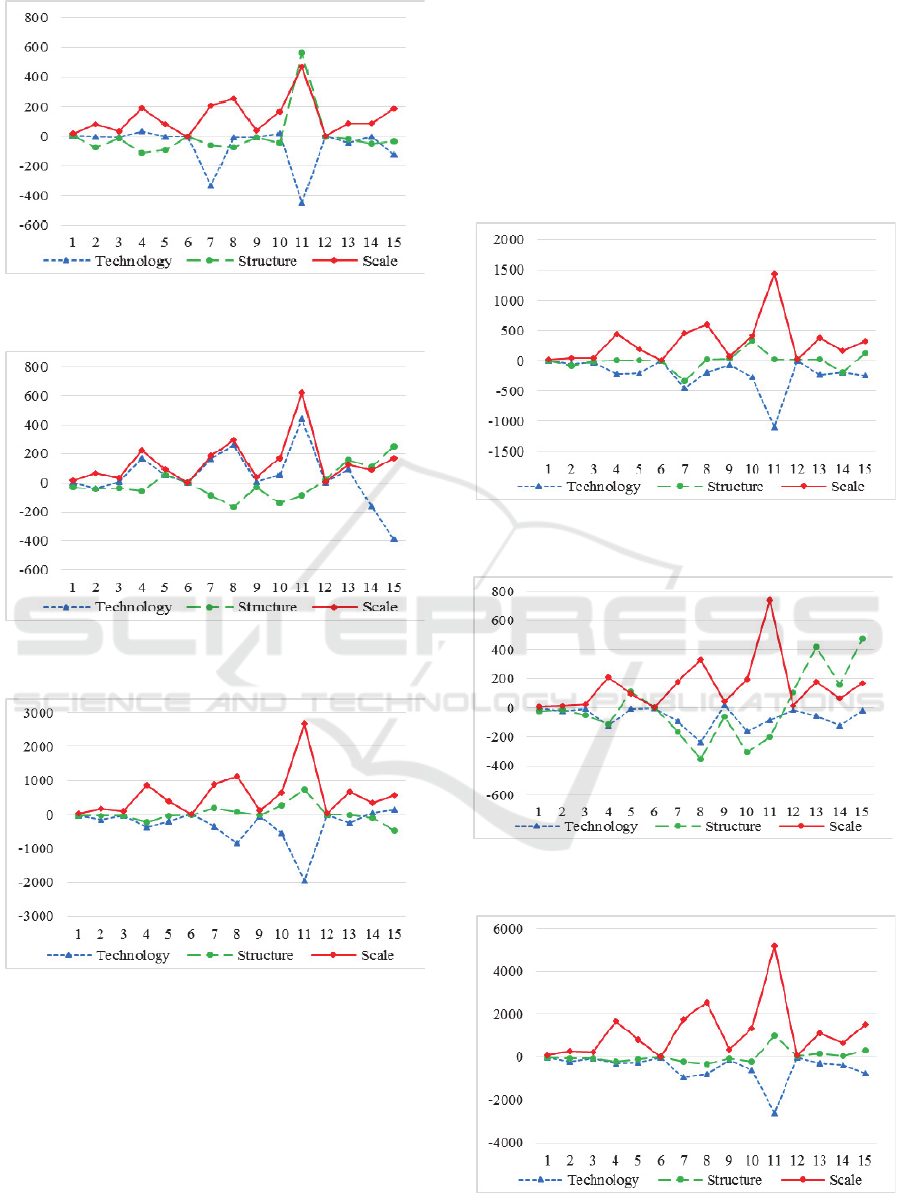
Figure 1: Influence factors of the change on exported
embodied oil between 1997 and 2000. Unit: 10
4
Ton.
Figure 2: Influence factors of the change on exported
embodied oil between 2000 and 2002. Unit: 10
4
Ton.
Figure 3: Influence factors of the change on exported
embodied oil between 2002 and 2005. Unit: 10
4
Ton.
The change on the amount of embodied oil in
international trade are derived from combined action
of three effects. It can be seen from Figure 1-5 that
the export scale effect is always the major part of
positive promotion, while the technology effect is
the major part of negative influence. The only
exception of the technology effect appeared at the
change from 2000 to 2002. The export structure has
lesser impacts, comparing with the other two effects.
The industry sectors of No.1 Agriculture, No.3
Manufacture of food, beverages and tobacco, No. 6
Production and supply of power, heat and water, No.
9 Manufacture of non-metallic mineral products and
No. 12 Construction export pretty small amount of
oil embodied in international trade. The reason is all
of these sectors are low energy consuming or have
very small value of exports because their own
industrial characteristics.
Figure 4: Influence factors of the change on exported
embodied oil between.2005 and 2007. Unit: 10
4
Ton.
Figure 5: Influence factors of the change on exported
embodied oil between 2007 and 2010. Unit: 10
4
Ton.
Figure 6: Influence factors of the change on exported
embodied oil between 1997 and 2010. Unit: 10
4
Ton.
ISME 2015 - Information Science and Management Engineering III
446
ISME 2015 - International Conference on Information System and Management Engineering
446

The total Influence factors of the change on
exported embodied oil between 1997 and 2010 are
also calculated, as shown in Figure 6. The scale
effect of Manufacture of equipment is the largest
source for the increment of exported embodied oil,
even its technology effect also is the largest. Which
is in line with the result in Table 2.
4 CONCLUSIONS
The amount and the pathway of oil flow embodied
in China’s export trade are calculated by using the
Input Output Model, the Structure Decomposition
Analysis and China’s annual data (1997-2010).
The results show that, in the past 20 years,
Manufacture of equipment and Chemical industry
are the first and second largest sources of exported
embodied oil. The total exported embodied oil has
grown from 5 206 × 10
4
ton in 1997 to 15 547 × 10
4
ton in 2010, which account for a large percent of
China’s domestic oil consumption. The export scale
effect is always the major part of positive promotion,
while the technology effect is the major part of
negative influence. The export structure has lesser
impacts, comparing with the other two effects. The
scale effect of Manufacture of equipment is the
largest source for the increment of exported
embodied oil.
The oil flow embodied in international trade and
its influence factors should be considered during the
development and management in the future.
ACKNOWLEDGEMENTS
The authors would like to give many thanks to the
National Social Science Foundation of China (No.
13&ZD159) for sponsoring this research.
REFERENCES
X. Tang, B. Zhang, L. Feng, “Net oil exports embodied in
China’s international trade: An input–output analysis,”
Energy, vol. 48, no. 1, pp. 464–471, Dec. 2012.
G. Machado, R. Schaeffer, and E. Worrell, “Energy and
carbon embodied in the international trade of Brazil:
an input–output approach,” Ecol. Econ., vol. 39, no. 3,
pp. 409–424, Dec. 2001.
Research on Oil Flow Embodied in Export Trade of China
447
Research on Oil Flow Embodied in Export Trade of China
447
