
Algorithm of Attack Graph Generation based on Attack Cost of
CVSS
Shaoqiang Wang, Dan Shao and Jianan Wu
College of Computer Science and Technology, Changchun University, Changchun 130022, China
wsqem@qq.com
Keywords: Attack Graph, Attack Cost, CVSS.
Abstract: Attack graph is the network state abstract generated by mathematical analysis. Attack model can help
structurally describing and effectively analyzing the course of attack, and attack graph can clearly analyze
the attack paths the attacker may take. The analysis of attack graph has wide applications in intrusion
detection and network attack warning. In this paper, a algorithm of attack graph generation based on attack
cost of CVSS is designed. In the algorithm, attack costs of CVSS are analyzed, the method of time
correction and controlling the graph size are adopted. The best attack paths can be effectively doped out and
the graph size can be controlled. Experiment validates its veracity and validity.
1 INTRODUCTION
With the rapid development of network technology,
social and personal dependence on the Internet is
also growing. The Internet technology revolution has
brought enormous benefits to people. But at the
same time, hacking, viruses, Trojans and other
network security issues are also emerging, these
brought huge economic losses to society, institutions
and individuals. Research and development of
network security technology has become more
important. Hackers are usually attack to the network
system around vulnerabilities. Security
vulnerabilities are entrance of a computer operating
system or other applications, hardware, software,
they can be exploited by attackers. Security
vulnerabilities are defects in specific implementation
or system security policies, an attacker can access or
damage system in the absence of authorized system.
More serious is the possible existence of a link
between these vulnerabilities could become a
springboard to attack after another vulnerability
exploit a vulnerability attack. To find out the
relationship between these vulnerabilities, a very
effective method is to use a network attack graph
technique that hackers use exploits network
simulation process, to reach the ultimate goal to
identify attack paths, and these attack paths are
expressed in the form of graphs.
2 ATTACK GRAPH
GENERATION METHOD
Attack graph can be divided into two types that is
state attack graphs and attribute attack graphs. In
state attack graph, each node represents a safe state.
Attack state comprise of a series of security
attributes, such as host name, permissions,
vulnerabilities, services, the side indicates the
changes of security status. In attribute attack graph,
each node represents a security attributes, directed
edges represent dependencies between attributes.
The first attack graph presented by the
Cunningham, he considers the network from a
variety of components, the components are
connected by a physical or logical way. Directed
edge in the attack graph represents the cost to pay,
the attacker get "returns" by attacking the network
components. In the attack graph method of Swiler,
the network topology information is also taken into
account in the safety analysis. Ritchey proposed
method using model checker, this method can
automatically generate attack graph. But the model
contains all of the state can easily lead to the state
explosion problem, not suited to large-scale
networks. To this end, Ammann proposed network
attacks monotony assumption, it can simplifies
attack graphs by limiting attack graph generation
process. Tao Zhang put forward that build a safer
state model by analyzing the host, link relationships
471
Wu J., Wang S. and Shao D.
Algorithm of Attack Graph Generation based on Attack Cost of CVSS.
DOI: 10.5220/0006028804710476
In Proceedings of the Information Science and Management Engineering III (ISME 2015), pages 471-476
ISBN: 978-989-758-163-2
Copyright
c
2015 by SCITEPRESS – Science and Technology Publications, Lda. All rights reserved
471
and attack signatures, then generate the attack path
method by a forward search, breadth-first and depth
limit. Kyle Ingols proposed a method of network
attack graph generating based on multi preconditions,
with the increase of network scale attack graph is
approximately linear increase. DapengMan proposed
breadth-first search algorithm to generate a global
attack graph, it reduces the complexity of attack
graphs by limiting success probability of attacks step
and attack paths. Liling Juan proposed state
transition attack model based on the cost of analysis
and control of the depth. In the algorithm, attack
costs are analyzed, and the method of controlling the
graph size is adopted. Jianghu He proposed a attack
graph generation method based on vulnerability
associated with cost-based attack. This method takes
into account the correlation issue between the
vulnerability binding. Fangfang Zhao proposes a
related algorithm based on privilege escalation, and
designs an effective tool to generate attack graphs.
This tool describes network attack model in database
language, which including three attributes that is
host description, network connectivity and exploit
rule, and stores network configurations and host
information into database automatically.
3 THE ALGORITHM OF
ATTACK GRAPH
GENERATION BASED ON
ATTACK COST OF CVSS
3.1 Evaluation Index of CVSS
The Common Vulnerability Scoring System (CVSS)
is an open framework for communicating the
characteristics and severity of software
vulnerabilities. It was developed by NIAC and
Maintained by FIRST (an Forum of Incident
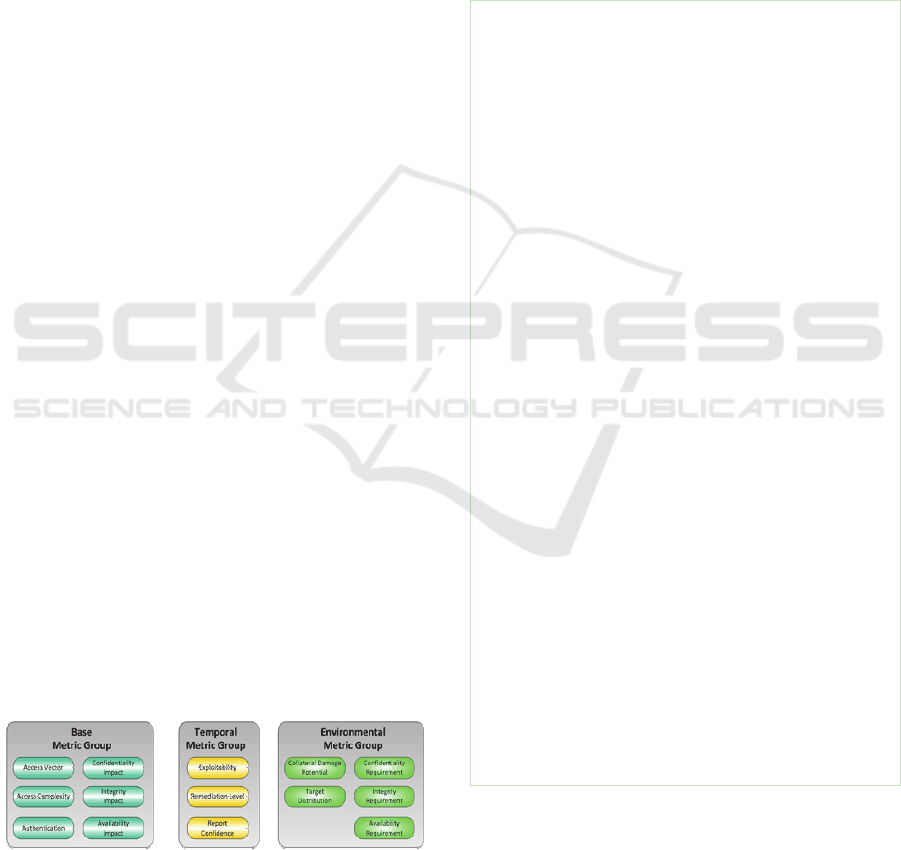
Response and Security Teams). CVSS consists of
three metric groups: Base, Temporal, and
Environmental, as shown in Figure 1.
Figure 1: CVSS Metric Groups.
The Base group represents the intrinsic and
fundamental characteristics of a vulnerability that
are constant over time and user environments. The
Base metrics produce a score ranging from 0 to 10,
which can then be modified by scoring the Temporal
and Environmental metrics. The Base Metric
includes Exploitability and Impact. Exploitability
describes the degree of difficulty vulnerability being
exploited, it includes Access Vector, Access
Complexity, and Authentication metrics. Impact
describes the dangers of the vulnerability, it includes
three indicators: Confidentiality, Integrity and
Availability. The base equation is the foundation of
CVSS scoring. The base equation is:
BaseScore =
round_to_1_decimal(((0.6*Impact)+(0.4*Exploitability)-
1.5)*f(Impact))
Impact = 10.41*(1-(1-ConfImpact)*(1-IntegImpact)*(1-
AvailImpact))
Exploitability = 20*
AccessVector*AccessComplexity*Authentication
f(impact)= 0 if Impact=0, 1.176 otherwise
AccessVector = case AccessVector of
requires local access: 0.395
adjacent network accessible: 0.646
network accessible: 1.0
AccessComplexity = case AccessComplexity of
high: 0.35
medium: 0.61
low: 0.71
Authentication = case Authentication of
requires multiple instances of authentication:
0.45
requires single instance of authentication: 0.56
requires no authentication: 0.704
ConfImpact = case ConfidentialityImpact of
none: 0.0
partial: 0.275
complete: 0.660
IntegImpact = case IntegrityImpact of
none: 0.0
partial: 0.275
complete: 0.660
AvailImpact = case AvailabilityImpact of
none: 0.0
partial: 0.275
complete: 0.660
The Temporal group reflects the characteristics of a
vulnerability that change over time, it includes three
times evaluation index: Exploitability, Remediation
Level and Report Confidence. The temporal
equation is:
ISME 2015 - Information Science and Management Engineering III
472
ISME 2015 - International Conference on Information System and Management Engineering
472

TemporalScore =
round_to_1_decimal(BaseScore*Exploitability
*RemediationLevel*ReportConfidence)
Exploitability = case Exploitability of
unproven: 0.85
proof-of-concept: 0.9
functional: 0.95
high: 1.00
not defined: 1.00
RemediationLevel = case RemediationLevel of
official-fix: 0.87
temporary-fix: 0.90
workaround: 0.95
unavailable: 1.00
not defined: 1.00
ReportConfidence = case ReportConfidence of
unconfirmed: 0.90
uncorroborated: 0.95
confirmed: 1.00
not defined: 1.00
The Environmental group represents the
characteristics of a vulnerability that are relevant and
unique to a particular user's environment. Different
environments can have an immense bearing on the
risk that a vulnerability poses to an organization and
its stakeholders. The CVSS environmental metric
group captures the characteristics of a vulnerability
that are associated with a user's IT environment.
Since environmental metrics are optional they each
include a metric value that has no effect on the score.
The environmental equation is:
EnvironmentalScore =
round_to_1_decimal((AdjustedTemporal+
(10-
AdjustedTemporal)*CollateralDamagePotential)*TargetDistri
bution)
AdjustedTemporal = TemporalScore recomputed with the
BaseScores Impact sub-equation replaced with the
AdjustedImpact equation
AdjustedImpact = min(10,10.41*(1-(1-
ConfImpact*ConfReq)*(1-IntegImpact*IntegReq)
*(1-AvailImpact*AvailReq)))
CollateralDamagePotential = case CollateralDamagePotential
of
none: 0
low: 0.1
low-medium: 0.3
medium-high: 0.4
high: 0.5
not defined: 0
TargetDistribution = case TargetDistribution of
none: 0
low: 0.25
medium: 0.75
high: 1.00
not defined: 1.00
ConfReq = case ConfReq of
low: 0.5
medium: 1.0
high: 1.51
not defined: 1.0
IntegReq = case IntegReq of
low: 0.5
medium: 1.0
high: 1.51
not defined: 1.0
AvailReq = case AvailReq of
low: 0.5
medium: 1.0
high: 1.51
not defined: 1.0
3.2 Algorithm Principle
From cvss evaluation index we can draw a
conclusion: exploit attack cost of vulnerability is
correlated with Exploitability metrics and Temporal
metrics, attack cost is inversely proportion to
Exploitability and Temporal. After the appropriate
changes of cvss’ computational formula,
vulnerability attack cost is calculated as:
P= 100/(Exploitability*
TemporalScore)=
round_to_1_decimal (100 / (20*
AccessVector * AccessComplexity
* Authentication * Exploitability
* Remediation Level * Report
Confidence))
(1)
The CVSS vulnerability scoring system design
considered the threat score over time and the status
of the deployment, but does not take into account
users repair vulnerability as time changes. After the
vulnerability was disclosed, because users continue
to repair vulnerabilities, vulnerabilities in the system
are fewer and fewer as time goes on. The possibility
of vulnerabilities being used is reduced, and attack
difficulty (cost) will increase. So here we need to
consider the time factor to introducing time
correction coefficient r. Reference
RemediationLevel metric of CVSS and statistics
usual practice of users bug fixes, Design correction
coefficient r as shown in Table 1, and Correction
formula (1) get formula (2).
Algorithm of Attack Graph Generation based on Attack Cost of CVSS
473
Algorithm of Attack Graph Generation based on Attack Cost of CVSS
473

Table 1: Time correction factor.
Vulnerability published Correction coefficient r
1 month 0.75
3 month 0.80
6 month 0.85
1 year 0.90
3 year 0.95
3 year or more 0.99
P=100/(Exploitability* TemporalScore)=
round_to_1_decimal (100 / ((20*
AccessVector * AccessComplexity *
Authentication) * (Exploitability *
Remediation Level * Report
Confidence))) * r
(2)
Attack cost path to reach the targets is:
n)i(1 Cost
1
n
i
Pi
(i is the depth of the
current node attack paths, n is the total depth of
attack paths).
This algorithm intends to take forward a breadth-
first search method, starting from the position of the
attacker simulation attack path, and select the
optimal path of attacks based on node vulnerability
to attack. In order to avoid the attack graph scale is
too large, we should be to limit on the depth of the
path. Algorithmic language is described below:
Algorithmic: Attackgraph_generate
Input: Attack_depth, init_state
output: Attackgraph
Begin:
Queue State_queue=new Queue;
State_queue <-EnQueue(init_state);
While(State_queue.IsEmpty())
{
Ncurrent<- dequeue(State_queue);
if(Ncurrent!= Ngoal && Ncurrent.depth < Attack_depth)
{
for each vul in Ncurrent.vuls
{
if(A.preconditions=true)
{
Nss.depth=Ncurrent.depth+1;
Nss.cost=Ncurrent.cost+P;
Graph.Addedge(Ncurrent,Nss);
State_queue <- EnQueue(Nss);
}
}
}
}
4 SIMULATION EXPERIMENT
Construction of network experimental environment
is shown in figure 2, The network have four hosts,
that is H1, H2, H3, H4, these hosts are connected to
the router and separated the external network by a
firewall. H1, H2, H4 is Windows hosts, H3 is linux
hosts.
Figure 2: The network environment.
The attacker in the outside network have root
privileges of H0. H1 hosts opened the IIS service.
H2 hosts opened the HTTP service. H3 hosts opened
the SMTP service and FTP service. H4 hosts opened
the Telnet service. Firewall is only allowed the host
in outside network access IIS service on the H1.
There is no limit to the network host between visits.
The attackers’ goal is to hosts H4, he want to gain
root access to the H4. The use of the previously
defined compute nodes exploit cost formula (2)
sorted out on behalf of host vulnerability and value
as shown in Table 2.
Table 2: Vulnerabilities cost.
hosts Service Vulnerability ID Cost
H1 IIS CVE-2014-4078 21.1
H2 HTTP CVE-2015-2441 10.8
H3 SMTP CVE-2009-4565 12.6
H3 FTP CVE-2005-3524 10.8
H4 TELNET CVE-2009-1930 12.3
Utilizing the design of the algorithm, Set the
maximum attack depth of 4, the attack graph is
shown in Figure 3.
ISME 2015 - Information Science and Management Engineering III
474
ISME 2015 - International Conference on Information System and Management Engineering
474
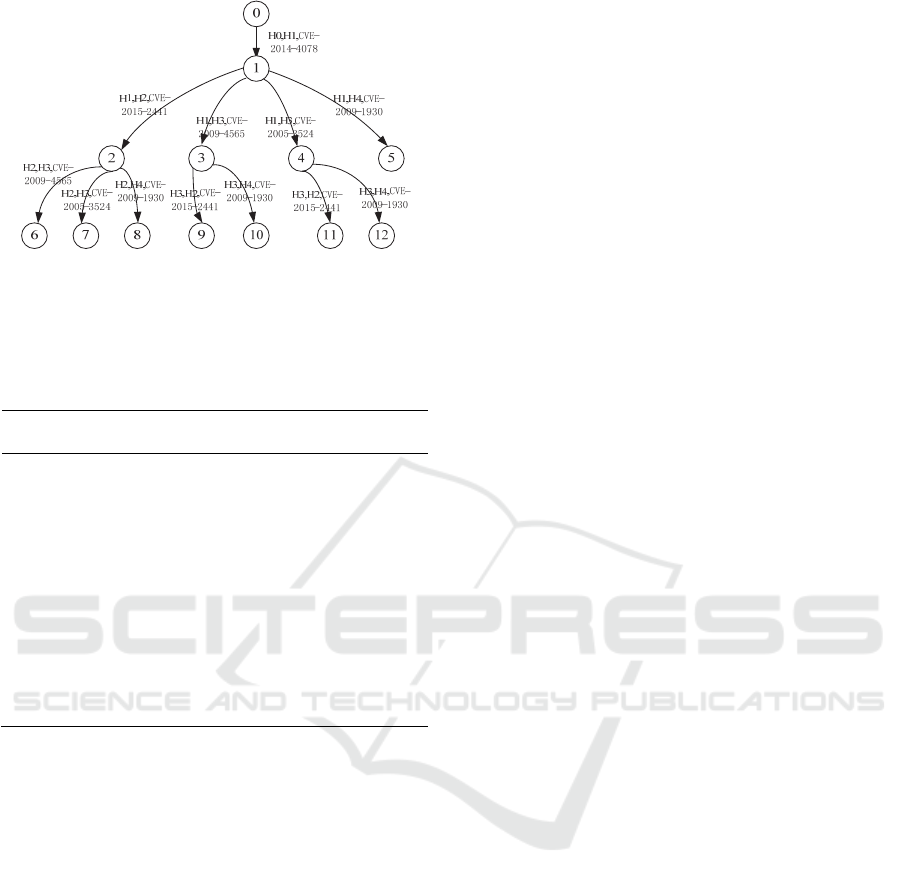
Figure 3: The attack graph.
It is concluded that the path and price as shown
in Table 3.
Table 3: Attack path cost.
Serial
number
Path Cost
1
( H0,H1, CVE-2014-4078 )
(H1,H2, CVE-2015-2441)
(H2,H4, CVE-2009-1930)
44.2
2
(H0,H1, CVE-2014-4078)
(H1,H3, CVE-2009-4565)
(H3,H4, CVE-2009-1930)
46
3
(H0,H1, CVE-2014-4078)
(H1,H3, CVE-2005-3524)
(H3,H4, CVE-2009-1930)
44.2
4
(H0,H1, CVE-2014-4078)
(H1,H4, CVE-2009-1930)
33.4
By Table 3 we know that the cost of path(H0,H1,
CVE-2014-4078 )
(H1,H4, CVE-2009-1930) is
the minimum cost. There are the lowest cost attack
from this path. The administrator may give
preference to fix vulnerabilities accordingly to
improve network security.
5 CONCLUSIONS
Today, modeling of network attack has been the
focus of attention. The attack graph technique has
the capacity to automatically discover the unknown
system vulnerabilities and the relationship between
vulnerabilities, it is currently a hot subject of
research. This paper gives a brief description of the
CVSS, and chooses the appropriate evaluation of
vulnerability to count attack cost. A network attack
model based on attack cost of CVSS and breadth-
first forward exploration is designed. In the
algorithm, the method of time correction and
controlling the graph size are adopted. The
experiment result shows that the best attack paths
can be effectively doped out, simplify the attack
graph generation, and improve the efficiency of
network penetration testing.
ACKNOWLEDGEMENTS
The work was supported by "twelfth five-year"
science and technology research project of jilin
province department of education with the project
number 2012247.
REFERENCES
Swiler LP, Phillips C, Gaylor T. A Graph Based Network
Vulnerability Analysis System, SAND97-3010/1.
Sandia National Laboratories, Albuquerque,
NewMexico and Livermore, California, 1998.
Danforth M. Models for Threat Assessment in Networks.
University of California-davis, 2006.
Ritchy RW. Efficient Network Attack Graph Generation.
George Mason University, 2007.
Templeton S T. A Requires Provides Model for Computer
Attacks. Proceedings of the New Security Paradigms
Workshop, Cork Ireland, 2000:31-38.
ORTALO R, DESWARTES Y, KAANICHE M.
Experimenting with quantitative evaluation tools for
monitoring operational security. IEEE Transactions
on Software Engineering, 1999, 25(5):633-650.
Ou XM, BoyerWF. A Scalable Approach to Attack Graph
Generation. Proceedings of the 13th ACM Conference
on Computer and Communications Security,
2006:336-345.
SCHNEIER B. Secrets and Lies. John Wiley and Sons,
Creating Secure Systems through Attack Tree
Modeling. Resources Red Teaming Articles and
Papers, Amenaza Technologies Limited. 2003.
SHEYNER O. Scenario Graphs and Attack Graphs.
School of Computer Science Department, Carnegie
Mellon University, 2004.
Peter Mell, Karen Scarfone, Sasha Romanosky. A
Complete Guide to the Common Vulnerability Scoring
System Version 2.0. http://www.first.org/cvss/v2/guide
A technical community for symantec.
http://www.securityfocus.com/.
Common Vulnerabilities and Exposures.
http://cve.scap.org.cn/.
Li Lingjuan,SUN Guanghui, Research on Algorithm of
Generating Network Attack Graph. Computer
Technology and Development. 2010.10. (in Chinese).
Chen Feng, Mao handong, Zhang Weiming, Lei Changhai.
Survey of Attack Graph Technique. Computer Science.
2011.11. (in Chinese).
Zhang Xi, Huang Shuguang, Xia Yang, Song Shunhong.
Attack graph based method for vulnerability risk
Algorithm of Attack Graph Generation based on Attack Cost of CVSS
475
Algorithm of Attack Graph Generation based on Attack Cost of CVSS
475

evaluation. Application Research of Computers.
2010.1. (in Chinese).
Wang Guoyu, Wang Huimei, Chen Zhijie, Xian Ming,
Research on Computer Network Attack Modeling
Based on Attack Graph. Journal of National
University of Defense Technology. 2009.4. (in
Chinese).
He Jianghu, Pan Xiaozhong, Algorithm of attack graph
generation based on attack cost of vulnerability
relations. Application Research of Computers. 2012.5.
(in Chinese).
Zhao Fangfang, Chen Xiuzhen, Li Jianhua, Generation
Method of Network Attack Graphs Based on Privilege
Escalation. Computer Engineering. 2008.12. (in
Chinese).
Lu Yuliang, Song Shunhong, Cheng Weiwei, Liu Jinhong,
Shi Fan. Analysis of the generation approaches to
network attack graphs. Journal of Anhui University
(Natural Science Edition). 2010.4. (in Chinese).
ISME 2015 - Information Science and Management Engineering III
476
ISME 2015 - International Conference on Information System and Management Engineering
476
