
Increasing Fault Tolerance in Operational Centres using
Human Sensing Technologies: Approach and Initial
Results
Nelson Silva
1,2
, Volker Settgast
1,2
, Eva Eggeling
1,2
,
Torsten Ullrich
1,2
, Tobias Schreck
2
and Dieter Fellner
1,2,3
1
Fraunhofer Austria Research GmbH, Inffeldgasse 16c, 8010 Graz, Austria
2
Technische Universit
¨
at Graz, ComputerGraphics and KnoweledgeVisualization (CGV) ,
Inffeldgasse 16c, 8010 Graz, Austria
3
GRIS, TU Darmstadt & Fraunhofer IGD, Darmstadt, Germany
nelson.silva@fraunhofer.at
Abstract. The analysis of users’ behaviours when working with user interfaces
is a complex task. It requires various sensing technologies and complex mod-
elling of input/response relationships. A huge amount of data is collected and
analysed today but there are multiple crucial factors that play an unknown role
in improving human decision processes. The development of new user interfaces
and the usage of suitable techniques to recognize interaction patterns, is crucial
for creating adaptive systems.
Our work is focused on fault tolerance of Human Machine Interfaces and we de-
velop systems that accept physical user measurements as additional inputs. This
can be applied to multiple domains such as Operational Control Centres. We have
conducted experiments with professional air traffic controllers with the company
Frequentis AG and we present and discuss the results obtained in a project called
Sixth Sense. We also discuss limitations and extensions for future systems.
1 Introduction
The automatic analysis of users’ behaviours and personal choices when working with
a user interface is a complex task. It requires diversified sensing technologies to au-
tomatically capture users’ behaviours and actions. Also, it requires certain advanced
analysis approaches and sophisticated models to enable an automated inference of the
context. There is a huge amount of data that may be captured. This includes physical
observations like eye movements, facial expression, body poses, gestures, but also heart
rate readings, body temperature, and so on. While the amount of potentially available
readings is huge, it is not clear which of these measures can be used and for which pur-
pose. We could detect high-stress and high-workload situations. This can be achieved
by monitoring the heart rate variability or the eye activity, in terms of areas of interested
visited. Also we can use eye information to steer the interface. Therefore, keeping the
user focused during critical and monotonous situations. This data must be handled and
processed to accurately represent the complexity in the interdependence of all extra ac-
tivities. It is much more than just user interface selections and systems actions. There
Silva N.
Increasing Fault Tolerance in Operational Centres using Human Sensing Technologies: Approach and Initial Results.
DOI: 10.5220/0006164100250049
In European Project Space on Computer Vision, Graphics, Optics and Photonics (EPS Berlin 2015), pages 25-49
ISBN: 978-989-758-156-4
Copyright
c
2015 by SCITEPRESS – Science and Technology Publications, Lda. All rights reserved
25

are environmental, sociological, psychological and physiological factors that play a pos-
sible relevant role in the human behaviour. These factors probably have a high impact
in the work being performed by the users. If correctly captured and pre-processed, they
are of vital importance to develop better automated systems, that understand, react and
adapt to unknown and unpredictable situations.
Our work is focused on improving the fault tolerance of human-machine-interfaces
and apply it to different domains, but we are targeting Operational Control Centres
(OCC) in general. Examples of this operational centres are: security in public spaces,
air traffic control, tunnels and highways or other emergency operational centres. The
target is to create systems that accept and process overall user’s body measurements
as input. It is essential to introduce in operational centres, new approaches for sensor
usage at the workplace. This is done without changing the current established proce-
dures or work-flows. A new sensor approach is desired to capture information about
the user’s movements, body postures, actions or eye scanning paths [7] in a continuous
and automatic way. Many institutions are demanded to go through a complex process
of certification, if the established work-flows are changed in any way. This has a high
impact in the assurance of the safety of the entire infrastructure. It has consequences
in terms of extra cognitive effort for the workers (the users will need to adapt to the
new working procedures or to new equipment and receive training). This results in high
impacts on stress levels, workload and situational awareness [14]. All this, ultimately,
translates into high financial costs too. It is important then, to introduce a novel sensing
devices, that allow us to better understand human behaviour and decisions with minimal
disruptions for the users. Maybe minimal disruption is not possible in all situations, but
it is highly desirable. It is crucial for the success of projects that aim at a higher automa-
tion of the work place at operational centres. This is specially true, for centres which
deal with critical information and where human life is a big concern.
We have to properly learn about relevant sensing input that generate huge amounts
of data streams. So, it is crucial to dedicate research to novel approaches for analysis,
processing and visualization of large amounts of data. These raw data streams are gen-
erated by multiple sources. Examples are sensors, domain specific information events,
control messages (like alarms or acknowledgements). If possible, the study of users’ in-
teractions should be done at the time of a user evaluation or directly at the work place.
This allows the creation of safety-critical systems that can learn, adapt, foresee and
overcome human errors or mistakes [24]. With such a framework, the domain data can
be collected in real time for an automated processing and analysis. It can also be stored
and replayed later for a detailed review by supervisors or data experts. For example,
we can aggregate sensors, such as: eye-tracker, body pose sensors (e.g., Kinect), hand
gesture sensors (e.g., leap motion) or bio-sensors (e.g., heart rate, electroencephalo-
gram) into the real work context. Then it might be possible to correlate domain specific
information with data about the users’ behaviour, interactions, current mental or even
physiological and emotional status. Nowadays, the accuracy of these types of sensors
improved drastically and their price is much lower now, making these sensors very at-
tractive. Both the data analysts and the control centre supervisors can make use of such
a system. They can have a better understanding of current difficult situations and use it
to augment the meaning of both historical and live operational data.
26
EPS Berlin 2015 2015 - European Project Space on Computer Vision, Graphics, Optics and Photonics
26

We present and discuss important research questions related with users’ interactions
and behaviours. They allow a better understanding of the different challenges. The final
goal is the identification of common decision making error patterns [39]. Until now,
the usage of interaction data required a tedious processing and analysis effort, specially
whenever there was the need of integrating several systems and sensing technologies.
In section 3 the project Sixth Sense [31] is introduced as a case study in the field of
air traffic management. This project was sponsored by EUROCONTROL and SESAR
[8][9], where together with Frequentis AG we did an evaluation on air traffic con-
trollers’ behaviours. Our contribution is to the improvement and development of op-
timized adaptive user interfaces. We study correlated interaction patterns that are used
for creating real-time supportive systems. Section 4 discusses the development of a
framework prototype developed to capture and analyse behavioural data directly at the
work place. Section 5 describes air traffic control experiments and the air traffic con-
trollers’ evaluation. We conducted these studies together with professional air traffic
controllers. Section 6 presents results of the project Sixth Sense. We discuss relevant
metrics and analysis techniques, and we report lessons learned and main findings.
2 Related Work
Until now, the design process of a user interface assumed that interfaces have the users’
full attention. User interfaces presume that the user is sitting, has two hands available
and can always look at the interface while operating it. This leads to an increase in the
number of errors [5][1] while the user operates these user interfaces. Today’s and fu-
ture’s interfaces should consider human attention as part of the design criteria [23]. An-
other important topic is related with the measurement of interaction costs. According to
Sauro et al. [28] and Lam [20] the calculation of interaction costs, e.g., physical-motion
costs (mouse, gestures), cognitive costs, visual-cluttering costs to perceive state, view-
change costs to interpret perception or state-change costs to evaluate interpretation, is
still typically not part of the development process of most interactive user experiences;
in particular in visualization design. These costs also affect the performance, situational
awareness and the workload, and it might even be the root basis for errors performed
by the users.
Events in a sequence of discrete events can be described using a proper stochastic
model. Usually, human-interaction tasks can be described as a sequence of discrete
events. Here parametrized variable length Markov chains (VLMC) can be used as a way
to reduce the number of contexts and their variance allowing an easier interpretation of
eye tracking or mouse data, allowing to show interpretable regularities in user-traces
[35]. Results suggest that fixation durations for a given individual are very stable across
reading, line drawings, color photographs and full color renderings of 3D models of
scenes [26]. Also it appears that there is no significant correlation between a user’s
saccade length or fixation duration and long fixation durations for one task, then the
fixation duration will be also longer for other tasks performed by the same user [26].
User interfaces and in particular the eye-based ones present enormous potential
for efficient human-computer interaction. However, these interfaces also have a great
difficulty in inferring intent from user eye movements. Fixation tracing using hidden
27
Increasing Fault Tolerance in Operational Centres using Human Sensing Technologies: Approach and Initial Results
27

Markov models to map user actions to the sequential predictions of a cognitive process
model, might give a help in this case [27]. Also it is important to investigate relations
between eye fixations and mouse cursor alignments [15]. Previous work has shown
correlations in the user interactions or to explore the mouse movements to infer query
intent or to investigate relations between mouse cursor pauses and high workload peri-
ods [12]. Data stream oriented applications are used across different fields and it plays
an important role in sensors integration projects. There are several strategies that can
be employed for the analysis of streaming information, one of these strategies employs
Complex Event Processing Systems (CEP) [22]. CEP combines several existent events
to generate a new composite or derived event. These events contain new correlated in-
formation that allow the study of the underlying processes. Furthermore, CEP offers the
opportunity for an improved loose coupling between software components [6].
The recognition of patterns is an important part in analysing the decision-making
mechanisms, and it can be achieved applying advanced outlier detection and machine
learning techniques [3]. Recent research clarifies why the human brain makes mistakes
and how the decision-making mechanisms work in reality. The decision-making tasks
are now linked with sensory evidence delivered in randomly timed pulses where noise
is playing a key role as the source of variability and errors [4]. Decisions in real life
need to be made based on noisy and unreliable evidence. The accumulation of evi-
dence from a set of noisy observations made over time makes it possible to average
over different noise samples, thus improving the estimates of the signal. This is at the
basis of the influential class of “drift-diffusion” models. Also, accumulation involves
maintaining a memory of evidence and the ability to add new evidence to the memory.
Yet until now no test has distinguished between noise associated to these two compo-
nents. New models [3] are now presented, which estimate the cognitive performance at
each moment in time while forming a decision, this without inserting electrodes into
the brain. The models provide a better view into brain during the “mulling-over” period
of decision-making. The neuroscientists found that internal mental process is perfectly
noiseless and that all the imperfections came from noise in the sensory process and not
from cognition. There is a variety of controller errors involving perception, memory,
decision-making, communication and team resource management. The classification of
errors is essential to record data for the detection of trends in incident occurrence. Iden-
tifying situations where systems can fail or identifying risky strategies taken by users,
makes error analysis a key component in safety management[30].
Human error is a major contributing negative factor in general and sometimes para-
doxically automation can often increase the complexity and importance and impact of
human error [36]. Shorrock and Kirwan [30] describe in detail a new approach to deter-
mine how human errors contribute to incidents. Also the authors review existing models
of human performance and taxonomies of human error. The field of behavioural analyt-
ics is a subset of business analytics that focuses in analysing seemingly unrelated data
points to extrapolate, predict and determine errors and future trends. It takes a more gen-
eral and human view on the data. It can be used in different domains and applications
such as consumer habits analysis, marketing campaigns and decision analysis.
Today applications in all fields may benefit from behavioural and neuroscience con-
tributions. There are multiple behavioural models that attempt to model human be-
28
EPS Berlin 2015 2015 - European Project Space on Computer Vision, Graphics, Optics and Photonics
28

haviour. In an overview on behavioural modelling [39] the author presents interesting
outlook on this topic. There are big challenges in the design of good visual analyt-
ics systems or solutions, the definition of interactive processes to explore and retrieve
useful knowledge has been actively discussed [19].
The topic of anomaly (outliers) detection and time series visualization are also im-
portant aspects for the analysis of time based data originated from users behaviour and
from sensors data streams [16][32][33]. Moreover, the projection of multidimensional
data to a lower-dimensional visual display is a common approach used to identify and
visualize patterns in data [25]. Strategies for dimensionality reduction are critical in
visual analytics [25]. Finally, the possibility of interactively search and explore large
collections of data is a strong capability in all visual analytics systems [2].
3 Case Study: Air Traffic Management Domain
The domain of air traffic management is a very challenging field on what concerns sys-
tem complexity, systems interdependency and also concerning human factors. In this
field there are several types of operational centres with different needs, that control
different areas or sectors. The en-route sector handles ongoing high altitude air traf-
fic. The tower and approach sector (or remote tower control centres) handles landing
and departure air traffic. There are even control centres just responsible for monitor-
ing and evaluating other control centre decisions. For example, they decide whether
to authorize or not a flight cancellation. In this context, the project Sixth Sense [31]
was developed, with the support of the Single European Sky Air Traffic Management
Research project (SESAR)(i.e., it targets productivity while keeping the humans in the
core of the continuous evolving systems), and the European Organization for the Safety
of Air Navigation (EUROCONTROL) [8][9]. In Sixth Sense we address EUROCON-
TROL’s innovative research topic of implementing full automation in the work place.
The goal is to contribute to the improvement of error detection systems through sensor
augmentation, while keeping the humans in the main decision loop of air traffic control
(ATC). Our interest is to find ways to improve fault tolerance and the collaboration of
humans and machines. We want to ease the workload and to handle complex decision-
making processes by studying the users’ interactions with Human Machine Interfaces
(HMI)[34][36].
In this project we are focused on a tower control scenario, however the project im-
plementations are suitable for other air traffic control scenarios, for example, en-route
air traffic control. This project had the duration of 24 months (a medium-size project
according to SESAR) and it ended on July 2015. For it’s development a consortium was
created that included: Fraunhofer Austria Research GmbH and Frequentis AG (special-
ized in developing software for air traffic management and control centres in general,
e.g., tunnels remote control). The main goals of the project were the realization of eval-
uation experiments, to collect data about users’ behaviours and decisions coupled with
realistic air traffic data. This data was originated from users’ interactions with an air
traffic control simulator at a standard controller work position.
Sixth Sense, incorporates simulated air traffic data, such as: flight, runaway infor-
mation and data about user selections on the user interface. Other useful information is
29
Increasing Fault Tolerance in Operational Centres using Human Sensing Technologies: Approach and Initial Results
29

also considered, for example eye tracking data that we use to analyse areas of interest
focused by the air traffic controllers. To collect data for the project, professional air
traffic controllers performed their normal tasks, while using the tower simulator in a
pre-defined and realistic ATC scenario.
Based on the obtained results, we have identified important predictors related with
good or bad decision making. The prototype aimed at augmenting the air traffic con-
trollers working environment with extra sensors and to collect data about the user’s
body language, such as: arm movements, body positions, hand gestures.
The work of the controller was analysed by domain experts during the experiment
and afterwards. This was done by accurately replaying the recorded experiment to clas-
sify and label unusual situations or decisions. We developed a new data collection and
analysis framework and we were also able to correlate different sources of information
and calculate metrics focused on the current work performance of the user, presenting
results on a dashboard that could be monitored by the air traffic control supervisor.
The work-flows of ATC centres and control rooms represent the work process of
other known producing enterprises. The work-flows define what needs to be done by
whom and when, especially in ATC centres this process is already defined quite well.
In Sixth Sense we used inputs from another SESAR project, the ZeFMaP project [18],
where a detailed analysis of the tower process has been performed in the form of tasks
and respective value stream analysis. Additionally, we used inputs from earlier work
[11],[21], where the different roles and tasks of a tower control centre were described.
3.1 Monitoring Challenges in Air Traffic Management
The work at an air traffic control centre can be very demanding with high peeks of
workload, requiring high levels of attention. However, sometimes in airports (specially
during the night) there are low activity times, but even during these times it is also
important to keep the controllers focused and alert.
As an aircraft travels through an airspace sector, it is monitored by one or more air
traffic controllers responsible for that sector. As an air plane leaves that airspace sector
and enters another, the air traffic controller passes the air plane off to the controllers
responsible for the new airspace sector. An airport like Hamburg, Germany (our sim-
ulated scenario) deals with more than 15 million passengers annually. This translates
into around 154 thousand aircraft movements annually, 115 national and international
non-stop flights and more than 60 airlines. In our tower control experiment the air traf-
fic controllers had to handle around 58 aircraft landings and departures in one hour. We
have selected this airport for our scenario because it offers challenging situations, such
as, the handling of a cross runway where the air traffic controllers have to put the air
planes on hold to allow other air planes to cross.
Consequently, the paramount goal is to improve human error detection through sen-
sor augmentation, while keeping the humans in the main decision loop of the control
work, considering that the disruption on the working environment procedures and phys-
ical space should be kept to a minimum. In Sixth Sense [31], the first step to achieve
this goal was to record and analyse the users’ behaviours and decisions. We wanted
to use this information as a source of data to illustrate the current users mental map
(either by registering all decisions in a graph database or by visually representing the
30
EPS Berlin 2015 2015 - European Project Space on Computer Vision, Graphics, Optics and Photonics
30

current landing or departure work-flow steps for each handle air-plane. We have anal-
ysed the users behaviours at the work place, which is referred in air traffic management,
as the integrated controller work position (iCWP) [10]. To collect the data, we have in-
tegrated multiple sensors like eye-tracking, mouse data, Kinect, voice recognition, bio-
sensors, environmental sensors (e.g., temperature, humidity, light) with domain specific
information (e.g., flight information, control messages), provided through an air traf-
fic simulator (Fig. 1) developed by the company Frequentis AG. This sensor set was
chosen because, it was the most plausible and non intrusive way to automatically col-
lect behavioural and interaction information. The gathered information helps automated
systems in the identification of moments of stress (or extreme relaxation), allowing it to
also constantly “observe” what happens while the users remain in those states.
We learned about where and what the user was looking at and we analysed the deci-
sions goals. The extra data provided by the sensors is then combined with information
available from different domain specific knowledge systems, such as the flight strip
system, and with the user interface interactions. From these observations, correlation
analysis are performed based on high frequency time-stamped data streams. This al-
lows the system to infer about different probabilities of the user’s next interaction (also
linked to existent well defined work-flow processes) and also about aspects related with
the current cognitive workload.
3.2 Assumptions Considered
To understand which sensor data was potentially useful to explain the users’ behaviours,
we have prepared two experiments for data collection and for fine tuning of our frame-
work. We considered the following main assumptions:
– It would not be feasible to introduce at once a large number of sensing technologies
(sensors like EEG or emotional frameworks for deeper cognitive inference). Also
these technologies, require most of the times a more invasive set-up, where users
have to wear special equipment. Due to the complexity involved in the detection of
human behaviour, we started by utilizing single sensors (e.g., eye-tracker, heart rate
monitor) to create a standard baseline dataset. In posterior work the researchers and
air traffic experts following a similar set-up can easily compare if the introduction
of wearable devices have impact or not in the behaviour of the users.
– Regarding the discovery of common work-flows, we have decided to focus on gen-
eral eye tracking and mouse sequence analyses (e.g., areas of interested visited and
time spent on areas of interest). We performed analysis on the air traffic control
work-flow step sequences but future experiments should also be focused on spe-
cific and smaller tasks. Our complex event processing was able to reconstruct these
complete work-flow step sequences. Therefore in our data we captured the com-
plete work-flow sequences with each main task and we are able to compute metrics
that tell us for example how many times an air plane was put on hold or how many
runway crosses there was or the total processing time of an air plane.
– Regarding the inclusion of recommendation and prediction capabilities, it was de-
cided that we would further explore and analyse the data with the domain experts
to help them on the finding of unusual decisions or behaviours that might be used
31
Increasing Fault Tolerance in Operational Centres using Human Sensing Technologies: Approach and Initial Results
31
as good predictors. This will allow us to start designing recommendation and pre-
diction models. In our prototype we already included the capability of using a graph
database (to capture all meaningful decisions and data relationships in a way that
can then be visually explored and for which state of the search and analysis algo-
rithms are proofed to be useful for behavioural analysis), and we have integrated a
prediction engine (so that in the future we are able to recommend actions or to send
warnings to the supervisors about unusual user behaviours). Nevertheless these im-
plementations were not the goal of the project (the goal was to perform data analysis
and labelling, uncover decision patterns and gather good data predictors) and topics
like error avoidance and behaviour prediction will be properly addressed in future
work.
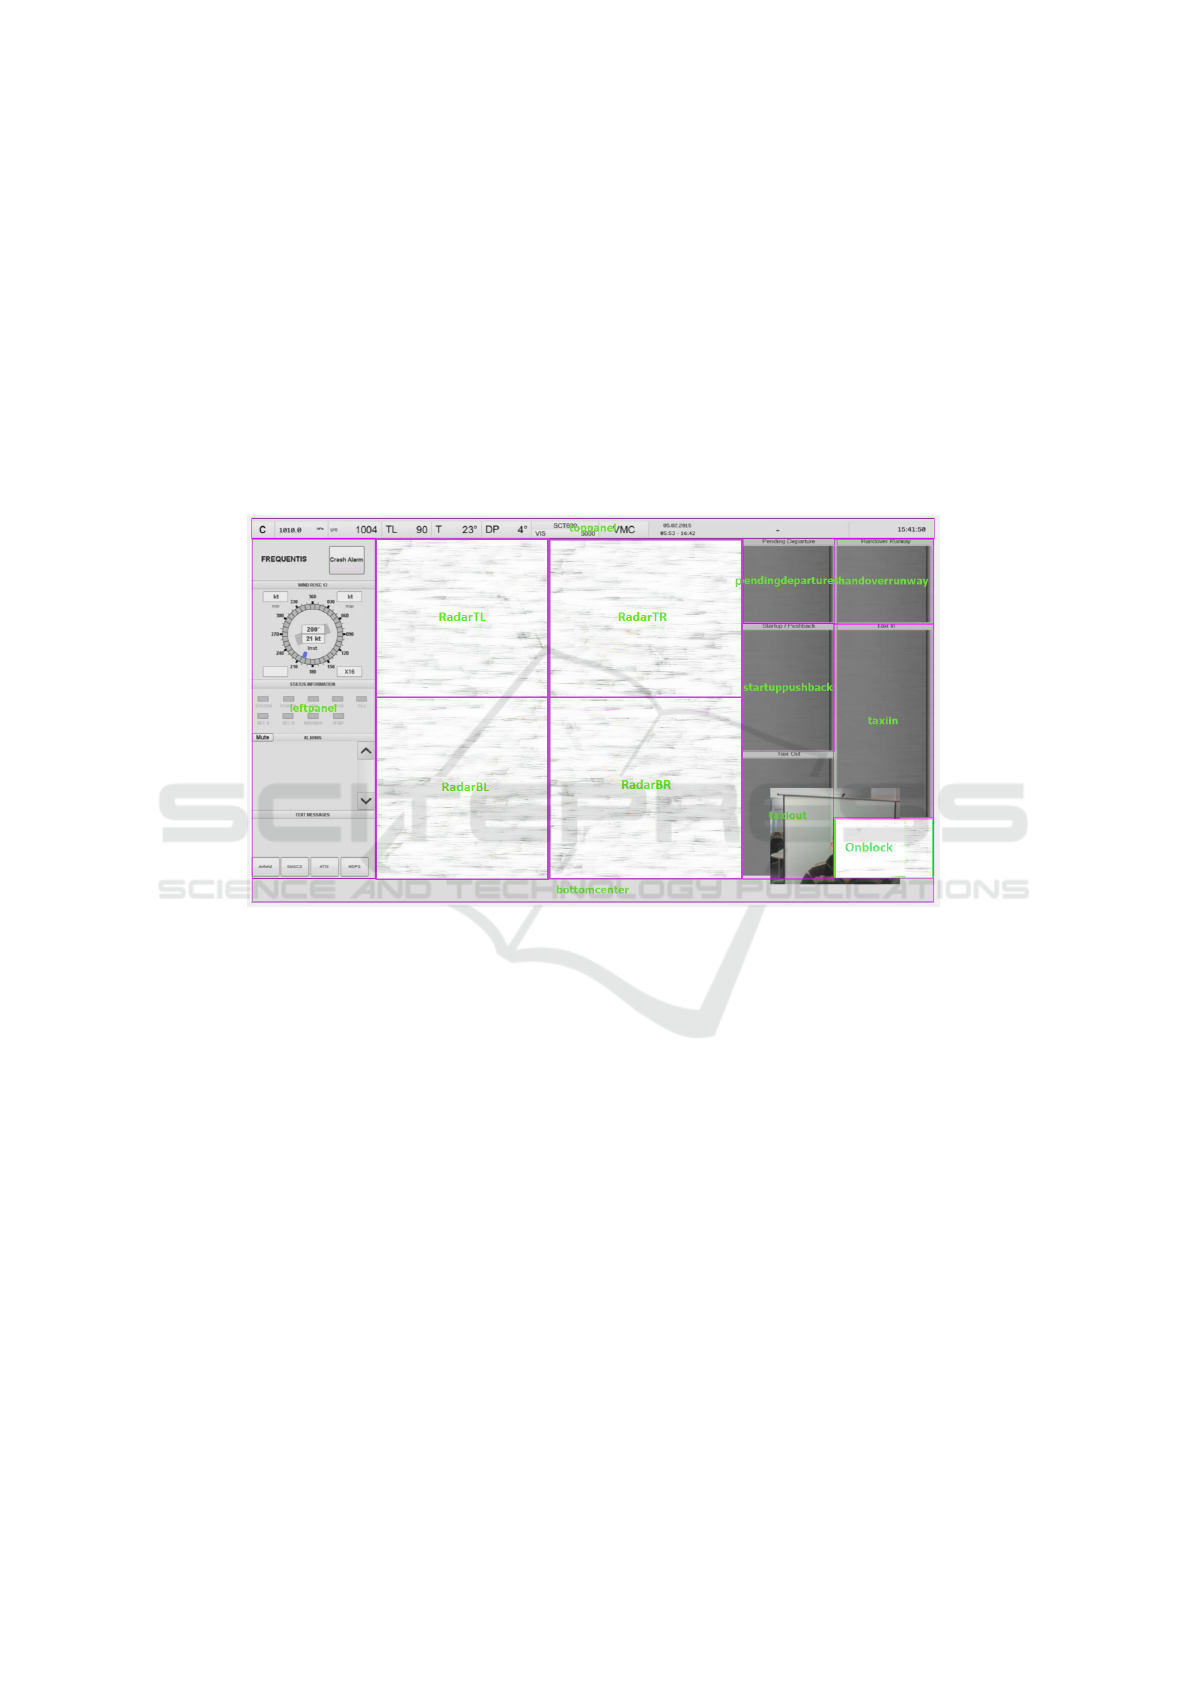
Fig. 1. Tower Air Traffic Control Simulator. Different information is displayed: alarms on the left
side; the radar controls in the center area; and the different drag and drop flight bays on the right.
– The automatic comparison between good and bad user decisions is done by using
metrics regarding task load, mental workload, attention and behaviour metrics de-
scribed in our work. These metrics were gathered with the help of psychologists
and air traffic control experts and provide us hints about the detection of distracted
users or under high workload.
– We needed professional air traffic controllers to be able to collect meaningful data.
To our knowledge this data was not (until now) freely available and therefore we
needed to set up evaluation experiments to collect it. The main reason was that we
needed to collect not only air traffic data and data about the selection and choices
of the air traffic controllers, but we needed to collect related sensor data using new
sensing devices like the MS Kinect, Voice Recording, bio-sensors or environmental
sensors. This combination of multi-modal data is not commonly available, making
these types of projects much more complex from the point of view of initial inte-
32
EPS Berlin 2015 2015 - European Project Space on Computer Vision, Graphics, Optics and Photonics
32

gration. At this stage we preferred to have less users on our experiments but we
were able to collect data from meaningful users, the air traffic professionals.
– We needed air traffic experts to monitor, supervise and classify the air traffic con-
trollers’ decisions, choices and behaviours to better judge about the mental status,
situational awareness or workload but also to more correctly annotate the data col-
lected. The quality of the users decisions is accessed in different ways (classifica-
tion, e.g. positive, negative and by ranking, e.g. 1 to 5 scale) and by different entities
(experts, experiment supervisors, experiment observers).
– It was assumed that we needed a very good integration with the existent air traffic
control systems (voice recognition modules, flight strip systems, radar). Only in
this way we would be able to collect enough realistic air traffic data.
– This use case was focused in the collection of data and in the correlation between
different sources of data (sensors and air traffic systems). It had the goal of gather-
ing realistic situations that could capture unusual situations due to high task work-
load, lack of situational awareness or high stress levels.
Our use case targeted safety and error avoidance, at this stage, not by predicting
unusual situations or making recommendations, but by accurately capturing these
abnormal situations. It allows the experts, to discuss, explore and visualize this type
of data. We can then prepare better models and study and experiment new concepts
and methods to create future autonomous systems that can adapt and react.
3.3 Research Questions
Operational centres have to handle domain specific information and communications
in very stressful and safety critical situations. Many times, not much information is
captured regarding the user’s behaviours. Even if this information is partially captured,
there is the lack of systems able to process and correlate the data to extract meaningful
knowledge about users’ behaviours or cognitive status. The “complex data” (i.e. time-
series, sensors, multivariate data) collected today is not enough for the analysis and
modelling of cognitive processes [37]. New sensing technologies are also needed to
provide a multi-modal view of the operational centres controllers work. There is also a
big challenge ahead in designing evaluation experiments that can capture the user’s in-
teractions and decisions with high fidelity. This project was developed to tackle exactly
these questions and problems.
The main research question debated in this work is: “When working in a control
centre can the user’s body language and choices provide valuable cognitive informa-
tion, to uncover hidden patterns that allow us to distinguish between “good” and “bad”
(erroneous) inputs and interactions and avoid mistakes and bad decisions?”
We developed an integrated framework to capture additional information about the be-
haviour and the decisions taken by the users. But more importantly we developed a
better way to collect data. Not only we needed to collect raw data from sensors, but also
simple mechanisms that would allows us to visualize, explore and correlate sensor data
with the air traffic information. It makes sense that a system that detects and separates
decisions and actions in an automatic way, has the potential to avoid the loss of situa-
tional awareness and to decrease the user’s stress level. It might significantly improve
33
Increasing Fault Tolerance in Operational Centres using Human Sensing Technologies: Approach and Initial Results
33

the work of air traffic controllers. Starting from this principle and counting with the
help of the experts we defined general research questions, such as:
– How to improve the user interfaces usability?
– How to detect main causes that lead to mistakes (e.g., using air traffic info, eye-
tracker, mouse, heart rate data, body pose)
– What are the hidden data signs that we can incorporate in an automated system
to detect and predict the users next actions or to predict when a user is in a high
workload situation or is about to make a mistake?
– What are the unknown factors that co ntribute to higher stress levels or to the lack
of situational awareness?
– Can air traffic information be combined with sensor information to improve the
detection and classification?
We then generated a list of partial research questions that allow us to guide our
analysis in the search for good predictors of the users’ behaviours (Table 1). These are
example questions created from a list of more than 43 research metrics, that is part of
the final Sixth Sense report (SESAR project).
4 Software Architecture of the Prototype for Data Collection and
Analysis
The simulated air traffic working environment and the descriptive technical documents
required for the preparation of our software framework (Fig. 2) were provided by
Frequentis AG, the company that developed the air traffic tower simulator utilized in
our experiments. The sensor data is stored as queued messages (to avoid losing any
messages and because the sensors can provide data at a very high rate). These mes-
sages are stored in different modalities, e.g., air traffic info, eye-tracker or heart rate
measurements. These are combined automatically into a new source of information,
i.e., eye-tracker data is combined with mouse data to form a single source of informa-
tion for analysis or data export purposes. These data topics are then pre-processed, and
analysed either using complex event filters or machine learning processes (a filter looks
much like an SQL statement, however we were able to also define, for example, time
window intervals for calculation and data aggregation, also the filters syntax is imple-
mented following well defined variables and work-flows in air traffic management). The
evaluation of the data mining and machine learning components will be part of future
work, outside of the scope of the Sixth Sense [31] project.
The idea of the project was to partially make use of information about the users’
body information (eye movements, hand movements, posture, etc.). In this way, we
were able to correlate air traffic information (departures, arrivals) with sensor infor-
mation (eye-tracker, heart rate measurements, kinect). For example the air traffic con-
trollers might mismatch similar air plane call signs, e.g. LH357 and LH375, but by com-
bining voice recognition with eye tracking we could depict that the controller talked to
the air plane LH357 while watching LH375.
34
EPS Berlin 2015 2015 - European Project Space on Computer Vision, Graphics, Optics and Photonics
34

Table 1. Research Questions.
ID Research Question
1 Does the number of taxi-in air planes at a given time influences the stress level (higher
stress level)?
2 Pauses in the mouse movement activity are known to be linked to high workload. Is
there a correlation between errors and increases in the the eyes/mouse movements to
scan the user interface?
3 When the user is about to make an error is there an increase in the fixation time on the
different areas of interest (AOI)?
4 When there is an increase in the number of Eye AOI fixations, then there is also an
increase in the number of Mouse AOI fixations, because there is a relation between eye
and mouse work?
5 The higher the task load the higher it will be the mental workload. How many de-
partures, arrivals per minute? Is this related with stress and changes in the heart rate
variability?
6 When the workload is higher then the occurrence of errors increases?
7 When the task load is higher then the occurrence of errors increases?
8 What is the eye and mouse scan path patterns of the users when they are about to make
mistakes? Are these distinctive enough?
9 Is the heart rate variability a good indicator for when the user is about to make a mis-
take? Can this information be combined with other sensor information?
10 Is there a possibility for error detection due to mismatches in the correlation between
eye-tracking and voice (call signs) information?
11 Is it possible to detect excessive demand based on number (or time spent) on areas of
interest?
12 Kinect Data - Is there a possibility for error detection due to the correlation between air
traffic information and the body posture.
13 Is the number of clicks, mouse movements or AOIs related with the occurrence of er-
rors?
14 Can we report what are the users’ most preferred eye and mouse scanning sequences?
15 Can we show how fast the utterances were spoken? Can this metric be utilized to detect
periods with more negative observations?
The Sixth Sense Framework is Composed by Four Essential Functional Blocks:
– The air traffic control tower simulator framework which is managing multiple graph-
ical user interfaces and it is distributing data via the network.
– The complex event processing (CEP) block incorporates an SQL database that is
used for logging and reconstructing events on the tower simulator and a NoSQL
graph database [17] which is to be used for further detailed actions investigation
and exploration.
– In the prediction block there is an Apache Hadoop and Mahout [29] recommenda-
tion engine.
– A data visualization block which features HTML5 chart visualizations, filtering and
data exploration capabilities.
– All the available air traffic information is collected into an ActiveMQ message
queue system (AMQ), in the form of XML messages separated using topic descrip-
tors. The same was achieved for all the different sensors, as an effort to incorporate
35
Increasing Fault Tolerance in Operational Centres using Human Sensing Technologies: Approach and Initial Results
35
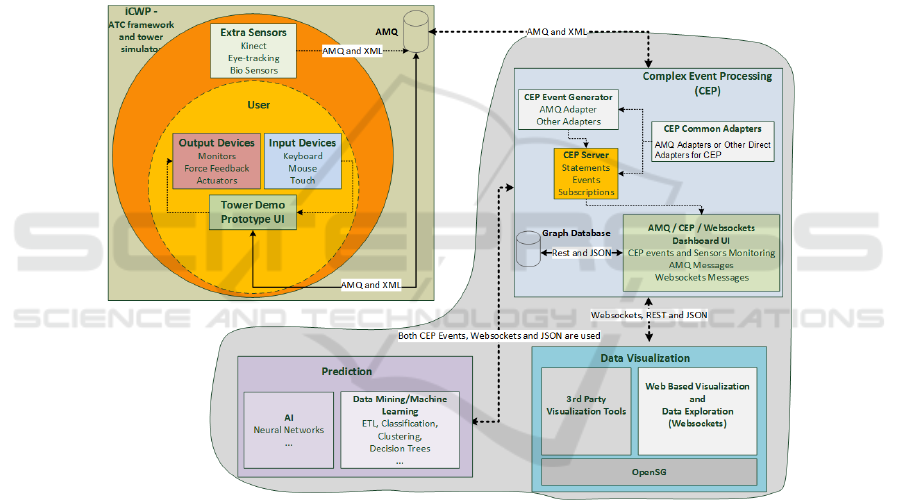
the new sensors into existing legacy systems. With the goal of saving processing
time on repetitive lookups, we also aggregate specific air traffic data with sensor
data, such as integration of air plane call signs with eye-tracking gaze position.
There are essential use case scenarios for the different sensors, based on the expected
usage in our context:
– Mouse, eye-tracker and voice recognition data - Error detection related with mis-
matches in the correlation between eye-tracking and voice (call-signs) information.
Detection of excessive demand based on number (or time spent) on areas of interest
(AOI). Detection of user tiredness based on longer times spent on each AOI.
– Kinect data - Possibility of error detection due to the correlation between air traffic
information and the body posture. Detection of excessive demand based on body
and gesture tracking information (speed of gestures). Detection of user tiredness
based on body posture.
Fig. 2. The Sixth Sense Software Architecture.
The process starts with an “observe phase” and the collection of raw interaction
data (available as queue messages). The data is generated from user interactions when
using the ATC simulator system an it is augmented with sensor data. The messages
are immediately pre-processed and transformed into events through the complex event
processing platform, where we filter and correlate multiple different event sources.
4.1 Features of the Prototype Framework
The main features of the Sixth Sense [31] framework are:
36
EPS Berlin 2015 2015 - European Project Space on Computer Vision, Graphics, Optics and Photonics
36
– Replay of all information topics (on-line data analysis and replay)
– Graph database storage (e.g., storage: body posture, work-flow step, AOI, action)
– Prediction engine training (e.g., give recommendations about possible next han-
dling steps for an air-plane)
– On-line complex event processing (CEP) and dynamic change of correlation filters
– Analysis and visualization of the air-planes arrival and departure work-flow tasks
and times (showing any repetition loops)
– Real-time plot of Eye-tracking and mouse current positions
– Visualization of interaction metrics, e.g., current user pace (current effort)
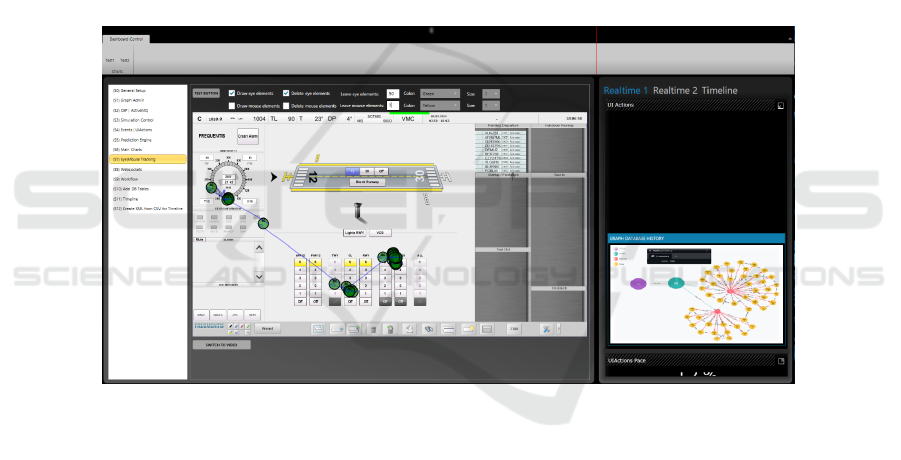
– Awareness dashboard (Fig. 3) with thresholds for cumulated departures or arrivals
– Web observation platform using Web-sockets and D3.js
– Real-time representation in a time line of the supervisors, observers and experts
annotations (stress level report, negative and positive observations)
– Handling of voice recognition data from communications between pilots and air
traffic controllers (similar to “think aloud protocol”)
– Export of datasets for analysis in other tools
Fig. 3. Dashboard in Sixth Sense showing the plot of eye and mouse data and current links in
graph database.
5 Air Traffic Control Experiments and Users’ Evaluation
To capture our baseline data we have designed two experiments. These experiments
took in consideration the feedback from the different experts in air traffic control (air
traffic controllers and supervisors, developer, psychologists with expertise in Human
Factors in the field of aviation). Also our team received specific training at the ATM
EUROCONTROL Experimental Center (EEC) in Bretigny, where we could experience
in first hand how it is like to be an air traffic controller performing at different sectors
(en-route sector , middle sector and approach and landing).
In the context of operational centres and due to the diversity of tasks performed
37
Increasing Fault Tolerance in Operational Centres using Human Sensing Technologies: Approach and Initial Results
37

by the users (manual work, ui interactions, discussions, planning, visual observations,
high or low stress, high emotional and critical or emergency related actions, multitude
of systems), there are a multitude of challenges to the identification of behaviours or
sequence of actions associated with errors or mistakes. This presented many difficulties
to the design of our two experiments in terms of sensor location and data analysis.
The tasks and decisions performed by air traffic controllers and subjective information
on stress (self-rating) or overall physical workload in terms of UI actions (i.e. mouse
clicks, eye movements), are critical for grasping the complexity of ATC decisions [23].
They allow the understanding of the reasons behind the actions taken. The collected
data allowed us to identify interaction and workload patterns.
In the first experiment we carefully collected and analysed data and we did direct
observation of the air traffic controllers. For the experiments, we have used a realistic
simulator, provided by our partners (Frequentis AG). The overall set-up is similar to
an ATC work environment. It allowed us to collect meaningful data about the user’s
decisions and actions. These tests were necessary, since the performance of the track-
ing technologies depends on environmental constrains, the workplace layout, working
procedures and many other factors.
The experiment was designed to capture critical data on stress and workload levels
in a natural way. It was not necessary to use any artificial strategies, e.g. to induce in-
creases in the workload or effort of air traffic controllers, besides a relative long duration
of each simulation (around 60 minutes maximum) and a proportional high air traffic. In
the second experiment we have fixed remaining problems with some sensors (kinect,
eye-tracking). Mostly, these problems were related with the capacity of the computers
to deal effectively with a high data streaming flood coming out of the sensors.
5.1 Method
First, we observed how an expert uses the simulator, using a “Think Aloud Protocol”.
An experienced air traffic controller performed the same experiment, while comment-
ing his decisions and working sequences. This allowed us to understand the problems
involved, ask questions and prepare the real experiments.
To analyse the behaviour and decisions of the air traffic controllers, we have de-
signed an experiment which uses the Hamburg Airport Tower Control scenario as a
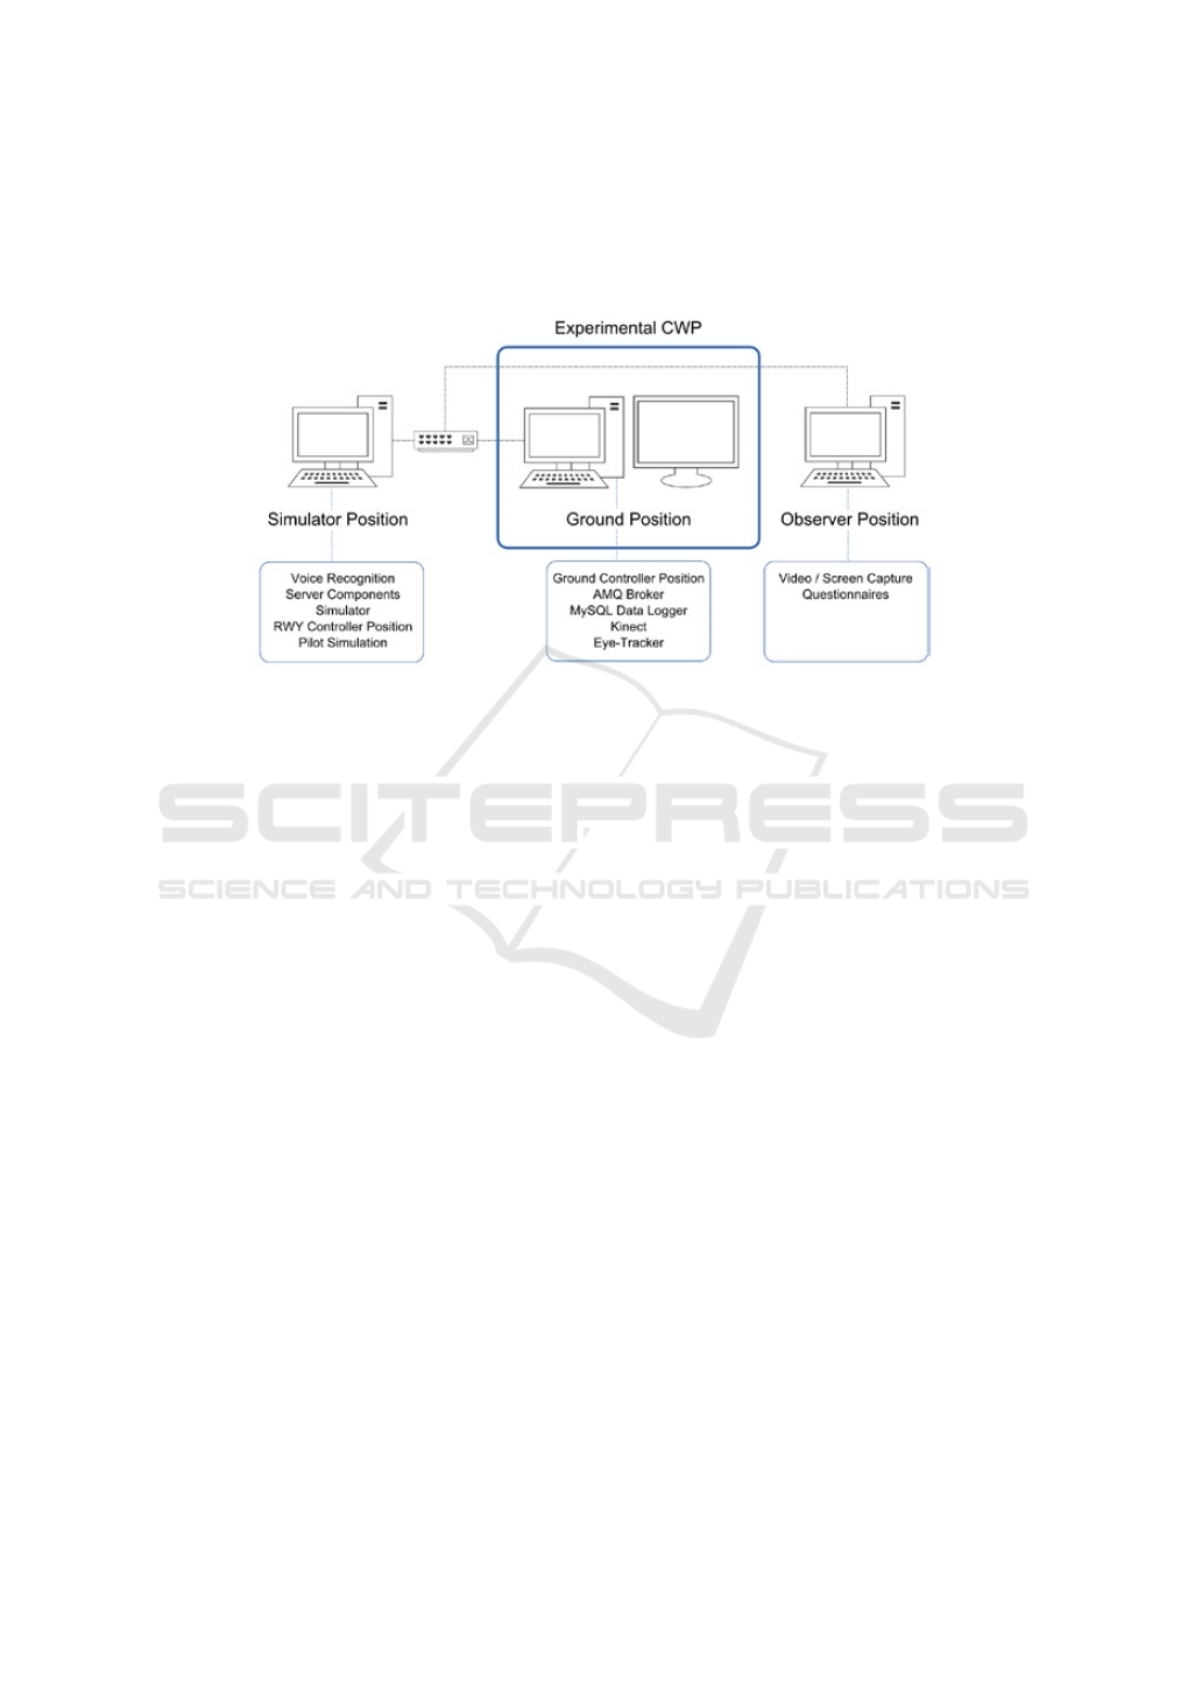
working base. In Fig. 4, we can see a representation of the experiment set-up. An initial
protocol was created for training of the users where we explained how to handle the UI
and it served as a test of the entire set-up to guarantee the quality of the data.
We have created a “Behavioural Observation Protocol” for the study of:
– Handling of pending departure air planes and pending taxi-in (arrival) air planes -
how the users work with these queue lists;
– Number of errors the criteria and indication for the report of an error is related to
the handling of air traffic. This is given by the supervisor (the supervisor signals
the error, and the ATC acknowledges), and it is added to the dataset by the remote
observer. There are certain errors associated with the handling of the UI that can be
considered directly by the observer watching the remote video;
38
EPS Berlin 2015 2015 - European Project Space on Computer Vision, Graphics, Optics and Photonics
38
– Number of help requests - similar to the report of errors. The observer is alert, to any
help request by the ATC to the supervisor in the room through remote observation.
This dataset is now part of our base of expert reference datasets.
Fig. 4. Our Air Traffic Control Experiment Setup.
Constraints Used During the Two Experiments:
– Simulation ran for approx. 45 min. (max. 60 min.) for each participant,
– Arrivals were automatically simulated until touchdown,
– Departures are controlled until take off and no runway change was simulated,
– Taxiway Routes could be selected by the operator.
General Configurations of the Experiment:
– Arrivals on runway 23 and departures on runway 33,
– Number of Arrivals: 31 flights and Number of Departures: 27 flights,
– Total number of flights(airplanes): 58 airplanes,
– 8 different types of airplanes: A319, A320, A321, B738, C206, CRJ9, E190, F900,
Task Description
Every participant got a map of the Hamburg airport and was asked to assume the ex-
periment work place. The participants were informed that it was ok to ask questions
about the usage of the simulator user interface (to the air traffic controller supervisor,
present in the room). When all questions were answered, the experiment started, and the
air traffic information was loaded into the simulator. Every 10 minutes, the supervisor
asked, what was the current stress level experienced by the participant and registered
extra notes about his personal evaluation point of view of the current performance of
the participant. The experiment lasted for 45 minutes, but it could run for 60 minutes
maximum, depending on the current air traffic situation. Each participant:
– Had to control landings and departures of the same number and types of air planes.
– Had around 45 min. (max. 60 min.) to perform in the entire experiment.
– Received a document about the experiment with map of the runways and a short
description of the simulation scenario.
39
Increasing Fault Tolerance in Operational Centres using Human Sensing Technologies: Approach and Initial Results
39

– Had the help of a person familiar with the UI (can ask questions about the UI).
– Each user had access to the same input devices (mouse and keyboard).
– The participant handles the same number and type of airplanes (same order).
Participants
All 8 participants currently work in the field of air traffic control, as air traffic controllers
(1 En-route, 6 Ground, 1 trained as a ground controller but works only in simulations
experiments). The work experience of the air traffic controllers varied from 20 to 2.
Gender: 4 males (50%) and 4 females (50%). Age: 3 participants were aged between
20-30, 3 were aged between 30-40 and 2 were aged between 40-50. One of the partici-
pants was wearing glasses.
Language
All communications between pilots and air traffic controllers were handled in English.
Six of the participants had German as their mother language, 1 Romanian and 1 Span-
ish. The level of experience with the UI varied from less than 1 hour to 3 years or more.
Apparatus/Materials
– Scenario and Hamburg airport description, map of runways.
– Consent form, pre-questionnaire, post-questionnaire (SASHA [8] and NASA-TLX
[13]) and a debriefing-questionnaire.
– Air Traffic Simulation and Experience Control.
– ATC Tower Simulator (ground control info, voice recognition, MS Kinect, Tobii
X2-30 eye tracker, mouse and keyboard).
– Environmental sensors (temperature, humidity, light and noise), captured with the
Libelium Waspmote sensing platform.
– Heart rate monitoring watch and monitoring bands for each user (Polar Watch).
– ATC replay framework and analysis software prototype.
– Remote Video Recording and Observation Notes Registration.
Main Variables in Our Study
– Number of Total Errors Observed. This measure is manually taken by observation
using a remote video recording software, and complemented with written annota-
tions observed from the air-traffic controller supervisor that is present during the
simulation in the evaluation room.
– Number of Total Help Requests. This measure is manually taken by manual obser-
vation using a remote video recording software.
– Every 10 Minutes Stress Level Check. This measure is manually recorded by the air
traffic controller supervisor, by direct report from the participant, every 10 minutes,
during the evaluation, using a Likert scale from 1(lower) to 5 (higher).
– Number of Air Planes in Pending Departure. This measure is automatically regis-
tered by the system.
– Number of Air Planes in taxi in. This measure is automatically registered by the
system and manually by remote observation.
– Average Workload. This measure is automatically calculated by our analysis frame-
work, takes the entire simulation period and the number of UI actions (composed
by eye and mouse activity).
40
EPS Berlin 2015 2015 - European Project Space on Computer Vision, Graphics, Optics and Photonics
40

– Every Minute Workload. It is automatically calculated by our analysis framework, is
taken every 60 seconds and uses the number of UI actions (eye and mouse activity).
– Workload at Stress Level Report Time. It is automatically calculated by our analysis
framework. It takes the workload (eye and mouse activity) at the time the user
reported the stress level (every 10 minutes), and also the number of UI actions.
Procedure
When starting the experiment all participants came alone into the evaluation room. Be-
fore starting the experiment, the participants were informed that the evaluation was
going to be video recorded, including the user interface interactions, and were asked
to sign a consent form. They were informed that they could stop the experiment at
any time, if they wished so. The participant had to answer a pre-questionnaire which
included questions about their experiences as air traffic controllers and about their pre-
vious experience with the simulator. The users were assisted in putting on the heart
rate monitor bands. We recorded 3 baseline heart rate measurements. In this way we
have the possibility to subdivide the users in groups, according to the heart beat rate
and heart beat variability. Some users may have a lower heart beat baseline than others.
During the experiment the participants were asked to report every 10 minutes about
their current experienced stress level. After the trial, the participants were asked to fill
in a post-questionnaire (based on SASHA [8] and NASA-TLX [13]) and new heart
rate measures were taken. After 10 minutes of relaxing and rest, a debriefing session
took place. A structured interview protocol was conducted, where difficult situations
were reported and revised (video recordings) and a debriefing-questionnaire was filled
by the participant. Questions regarding subjective experiences while working with the
simulator UI were also asked to each participant (debriefing-questionnaire). We have
implemented a protocol for reporting problems or common questions and to avoid and
improve similar situations in the future. Also, we measured the relation between the
number of errors and help requests reported (through remote video observation and su-
pervisor feedback) and the number of pending departures and air planes in the taxi-in,
queue lists.
5.2 Experiments to Assess the Data Quality
In our experiment the data quality (Fig. 5) was evaluated in distinct ways:
– Integration and collection of air traffic related data through the usage of a message
queue system and a MySQL database (this dataset can be replayed and extracted to
csv files for posterior analysis using statistic tools).
– Storage of environmental data (e.g., temperature, light and humidity in the room)
and the heart rate of participants that authorized this procedure.
– Transformation of questionnaires and observations into text files (csv format) for
posterior treatment and analysis.
– Through the creation of complex event processing filters it is possible to generate in
our prototype, new datasets with new measuring variables. For example, regarding
the usability workload measure, we can implement a filter that simply returns new
updated results every 60 seconds instead of every 10 minutes.
41
Increasing Fault Tolerance in Operational Centres using Human Sensing Technologies: Approach and Initial Results
41

– We have performed flight work-flow task sequences identification (this step was not
provided by the ATC systems that we used)
– We have used the well known statistic tools R and SPSS, for analysing correlations
between all the variables. After extracting the necessary datasets in a text file (csv
format), we import it and we make the necessary rearrangements on the meta data,
so that it can be analysed and charted in R and SPSS.
– The R analysis, revealed to be the right choice for the treatment of our data. We
call the scripts directly in our prototype and they allowed us to study correlations
on a big quantity of variables and data. For building the correlation matrices we
have used the default Pearson correlation method. Because of these correlation ta-
bles, we could direct our analysis in a much easier way, looking mainly at the most
important correlations. For building these matrices we have used the Pearson corre-
lation method. For our final analysis we have used the M-Estimation method. This
method is a robust technique that helps in the identification of data errors and other
problems (e.g. outliers).
– Creation of extra analysis datasets (errors, number of departures and landings be-
tween errors, several task related metrics).
– Heart Rate Variability Calculation
5.3 Data Analysis, Exploration and Visualization
Besides using our framework, we used other tools to analyse eye and mouse areas of
interest (AOI), to study of interaction sequences and to explore the data.
Firstly, for the analysis of mouse and eye-tracker data, we used the open source soft-
ware OGAMA (from TU Berlin). We defined and calculated eye positions and AOI cor-
respondences. The eye-tracker data stream contained many rapid eye position changes.
The visual perception of the human needs time to realize elements of a graphical user
interface (in our case the ATC simulator). We were interested in eye gaze positions that
were actively realized by the user (fixations). The calculation of eye fixations automat-
ically takes the AOIs into account and connects the results. A similar process was for
the mouse “fixations”, i.e., positions on which the mouse cursor rested for a certain
amount of time. The results were then exported to a comma separated file (CSV) for
visualization and correlation with other datasets in other tools (e.g., R). An off-screen
AOI for large time slots (>500 ms) between fixations was added too.
Secondly, after obtaining these AOI, we studied the sequence patterns in a soft-
ware created by Fraunhofer FKIE, called Event Analyser [35], that is based on Markov
chains.
Thirdly, we performed data exploration sessions with the different experts (e.g.,
ATC experts, psychologists). We have followed a reduced matrix of metrics related to
task-load, mental workload, performance, attention and behaviour, where we tried to
combine first the most obvious metrics (according to the experts in the different fields).
Finally, for users that authorized heart rate monitoring, we analysed the heart rate
variability (HRV) of each user. HRV is affected some factors like: aerobic fitness, age,
genetics, body position, time of day, and health status. A low HRV indicates is associ-
ated with stress or over training. We used the HRV together with the experts classifi-
42
EPS Berlin 2015 2015 - European Project Space on Computer Vision, Graphics, Optics and Photonics
42
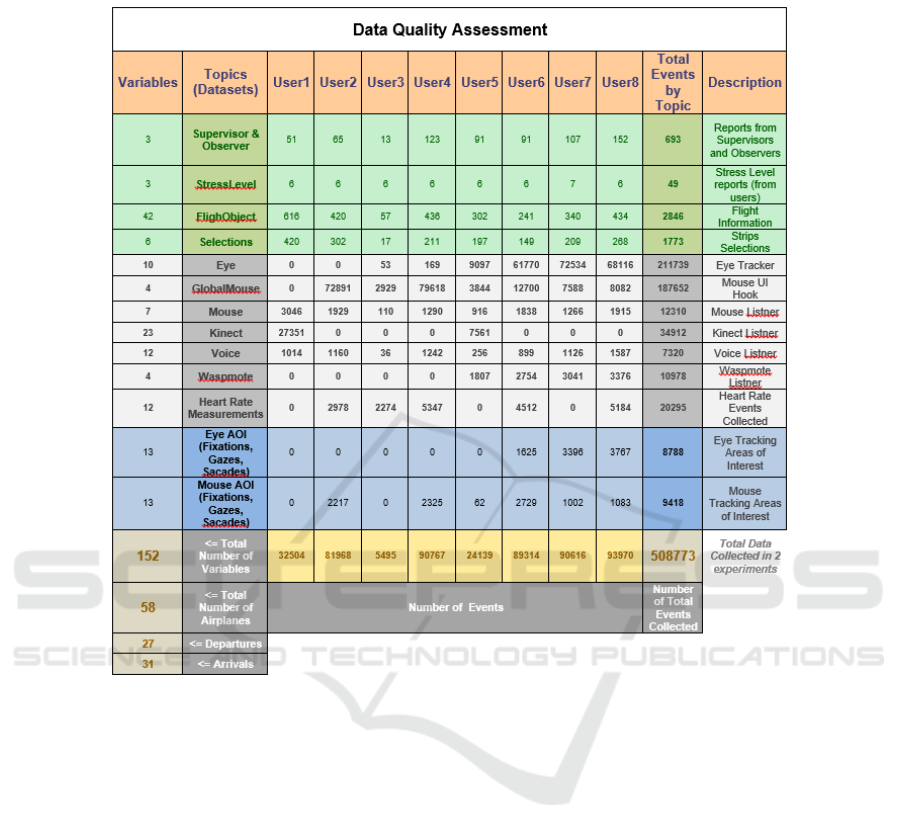
Fig. 5. Data Collected and Quality Assessment for Different Datasets and Sensors.
cation of negative observations to check for correlations in the data, this allowed us
to discover predictors for negative events.
6 Results and Discussion
We present some of the results of the Sixth Sense [31] project as an example of what
can be achieved and of what can be the outcome of a behavioural analysis study. For a
more complete overview, the reader can have a look at the Sixth Sense project report at
the SESAR website or contact us.
– Research question 1. Interdependence between taxi-in air planes and higher stress
levels through time?
We have found indications for relations between the number of arrival and departure
air planes and the report of higher stress levels by the users.
– Research question 2. Pauses in the mouse movement activity are known to be linked
to high workload. Is there a correlation between errors and increases in the the
43
Increasing Fault Tolerance in Operational Centres using Human Sensing Technologies: Approach and Initial Results
43

eyes/mouse movements to scan the user interface?
There appears to be a relation between the occurrence of errors and the increase
of eye or mouse events. The data indicates that there is a possible link between
reductions in mouse movement and increases in the eye movements, coincident
with the occurrence of negative observations.
– Research question 9. Heart rate variability as a good detector of mistakes?
After the data analysis we concluded that the heart rate together with the reduc-
tion in mouse activity, the number of visual UI objects to be managed (e.g. flight
strips) and the eye tracking AOI frequency and duration provide very good clues
for anticipating moments of stress, high workload and the occurrence of negative
observations.
– Research question 10. Possibility of error detection due to mismatches in the corre-
lation of eye tracking or mouse data and voice. There are direct relations between
an increase in the number of words utilized by the air traffic controllers and the
occurrence of negative observations. This always follows the same pattern.
– Research question 12. Kinect Data - Possibility of error detection due to the corre-
lation between air traffic information and the body posture
We have found the Head Coordinate State and the User in Range variables, very
promising for implementing a future error predictive system. We could account (in-
clude in the same time interval) at least 96% of all negative observations reported
by the experts, by filtering data using these two variables.
6.1 Discussion
The goal of our current and future work is to study interaction issues and identify neg-
ative patterns (non-optimal user decisions). These behaviours affect the performance
of air traffic controllers and exercises an unnecessary cognitive workload [37] burden
on the users. We are not working only around operational centres or air traffic control
scenarios. We initiated projects in other fields where we use this results applied to other
domains, e.g., on the improvement of data search user interfaces or in the development
of better systems in car driving.
These studies have the potential of showing interaction problems linked to increases
on workload, stress levels and to situations that evoke a high demand of attention from
users. We seek to understand the reasons and to identify the data signals that lead to
users’ confusion or decreases in their normal response capability. There is space for
improving current user interfaces [1] used in all domains. This can be done also by
analysing correlations between experience levels (e.g., experience performing similar
work or using the same UI) and our framework measures (e.g., regarding task load,
mental workload, attention, behaviour, performance).
It is interesting to verify which specific decisions and actions contribute to the de-
crease in situational awareness (e.g., the number of visual elements to be handled at a
certain time by the user). Reasons that lead to significant increases in the stress levels or
that answer why there is degradation throughout time are also investigated. Sometimes
this happens in a unclear way, that becomes only more evident after combining different
sources of information and by having a more complete view of the users actions and
behaviours.
44
EPS Berlin 2015 2015 - European Project Space on Computer Vision, Graphics, Optics and Photonics
44

We compared supervisor and observer annotations with other data collected, to de-
rive conclusions about the answers (negative or positive), actions and decisions taken.
We created an expert dataset that can be used as a comparison reference, after more data
is collected from non-expert users. After our data analysis we selected the most promi-
nent variables (among many), the ones that better represent the cognitive behaviour and
the decisions of the users. We have created a framework to allow a real time integra-
tion and processing of streamed data directly at the data generation time. These types
of frameworks are not usually available, making the investigative work of analysts and
experts very cumbersome when done manually. It is desirable that the experts supervis-
ing daily activities in operational centres, can be better supported through automated
anomalies detection, specially avoiding the necessity of drilling down big amounts of
data.
Studies like this one, are limited by the amount and diversity of data collected and by
the “noise” existent in the data, derived from the fact that it was not possible to capture
data without errors. We need models to classify and define what is exactly an error. In
our case, we worked with the domain experts. It was a manual process of labelling and
classifying relevant data events that paid off. In the specific case of human behaviour,
studies also must consider that certain aspects may not still be known and they might
not even be currently captured in the existent data.
Hence there is always the need to incorporate unknown data facts. This can be done
in our case by simply replaying the experiments to correlate new facts, already using
new labelled data. The order and time synchronization of data events, as wel as the
sample rate is very important. We have dedicated a great effort to make this step as
good as possible. For example, in the ATC use case, the capture of information related
with the radar area was challenging. The systems do not provide enough information
feedback about the visual user interface (aircraft labels and position) and eye tracking
fixations do not correspond directly to an aircraft id. Instead we subdivided the radar
area into four sub areas (left high, right high, left lower and right lower parts). This
allowed us to know at which area the users were looking. Here the problem of having
dynamic areas of interest (e.g. a UI control the can be re-sized) might interfere with
the calculation and analysis of AOI. Sometimes, we do not know when a problem is
due to other unknown aspects. To have a better assurance we would need to carefully
design new experiments and use other sensing devices, e.g., brain waves, perspiration
or emotional expressions.
6.2 Contribution and Benefits
The ability to pre-process and analyse streamed data directly at an evaluation study or
at the work place revealed to be a good option in our case because we could annotate
better our data by constantly observing all the remaining details that are not possible
to be captured by the sensors (e.g., user delay because of a dropped pencil). The focus
in the development of a more comprehensive framework for near real-time analysis,
reduces the burden in data interpretation and it is therefore self-justified. It means that
we can now feed on-line machine learning models that can be constantly trained and
adjusted to learn and adapt to new changes.
45
Increasing Fault Tolerance in Operational Centres using Human Sensing Technologies: Approach and Initial Results
45

The Sixth Sense project has laid important foundations for the creation of active
and supportive systems that can be of great value also for the supervisors in their daily
activities. Only a small part of all possible existent sensors could be analysed within
our project. This is a great starting point for adapting a system to the user.
As a major outcome of the project we expect to bring the supervisor and users in
general, much more into the core command of the overall operations by automating
certain tasks. In this manner, the sensors provided information about the intentions of
the user and the analysis can result in a recommendation or reaction from the system
that is beneficial for the job. We are also working on ways to introduce a mechanism, to
make usage of ontologies as a hierarchy of user interface concepts, where we can take
advantage of the interrelationships of those concepts. It was challenging to get the data
we needed and in a timely manner. There were a high number of technical limitations
that we had to overcome. An example of this was the integration of sensing technologies
with the existent ATM system used for the simulation scenarios. Another example was
the need to aggregate knowledge about different sensors that work at different frame
rates. We discuss in more detail these challenges in our Sixth Sense project.
6.3 Conclusion
Control centres can be improved by monitoring the users’ actions and decisions. Our
system allows to record and collect the users’ direct inputs as well as behavioural data
from sensors, including body pose aggregated with the various status of the available
systems. It is possible to separate work-flows into tasks and identify individual decisions
in an automatic way. Supervisors can rank the users’ decisions and available system
predictions.
By combining all this data, we expect to be able improve the performance and the
awareness of users at work. We are now able to continue working on ways to predict
the next choice of a user or on ways to infer if a user is moving or relaxed, by observing
the respective users’ movements. We want to automatically create a database of best
work-flows that reflect different users and that is able to display recommendations about
optimal next actions.
This allows the creation of systems that are able to deal with unusual behaviour.
Several challenges are solved and we are fine tuning some parts of the system. A
final step of this type of project is to confirm if the framework and overall prediction
concept is performing well in not know situations. We need to receive feedback from
supervisors regarding the results and advices given by such system. This also opens up
new possibilities to other research topics, leading for instance to the implementation of
more comprehensive cognitive models in many domains. This facilitates, for example,
the acceptance of this nature of intelligent systems by the users, or the integration of
more forthcoming sensing technologies in the near future.
Acknowledgements. This work was co-financed by EUROCONTROL acting on be-
half of the SESAR Joint Undertaking (the SJU) and the EUROPEAN UNION as part
of Work Package E in the SESAR Programme. Opinions expressed in this work reflect
the authors’ views only and EUROCONTROL and/or the SJU shall not be considered
liable for them or for any use that may be made of the information contained herein.
46
EPS Berlin 2015 2015 - European Project Space on Computer Vision, Graphics, Optics and Photonics
46

We wish also to thank our Sixth Sense consortium partners and their staff mem-
bers: Theodor Zeh, Michael Poiger, Florian Grill and Baris Kalayci (Frequentis AG),
and to Carsten Winkelholz and Jessica Schwarz (Fraunhofer FKIE) for their invaluable
contributions and expertise in the fields of air traffic control, evaluation methodologies,
psychology, data analysis.
References
1. Anne, I., Steven, T. S., Barry, K.: Human error in European air traffic management: the
HERA project. Vol. 75. Reliability Engineering & System Safety, Elsevier (2002) 257-272
2. Bernard, J., Daberkow, D., Fellner, D., Fischer, K., Koepler, O., Kohlhammer, J., Runnwerth,
M., Ruppert, T., Schreck, T., Sens, I.: VisInfo: a digital library system for time series research
data based on exploratory search - a user-centered design approach. Vol. 16. Intern. Journal
on Digital Libraries (2015) 37-59
3. Bishop, C.: Pattern Recognition and Machine Learning. Springer (2006) 605-674
4. Brunton, B., Botvinick, M., Brody, C.: Rats and humans can optimally accumulate evidence
for decision-making. Vol. 340. Science AAAS, New York (2013) 1-108
5. Carayon, P.: Handbook of Human Factors and Ergonomics, Human Error. L. Erlbaum Asso-
ciates Inc. (2006) 708-760
6. Cugola, G., Margara, A.: Processing Flows of Information: From Data Stream to Complex
Event Processing. Vol. 44. ACM Comput. Surv. (2012) Art. no. 15
7. Duchowski, A.: Eye tracking methodology: Theory and practice. Vol. 373. Springer (2007)
3-179
8. EUROCONTROL: Recommendations for HMI Evaluation in the Context of CWP Develop-
ment: A Synthesis Of Relevant Literature. Core Requirements for ATM Working Positions,
Project HRS/HSP-006. EUROCONTROL (2003)
9. EUROCONTROL: The Development of Situation Awareness Measures in ATM Systems.
EATMP Method and Tool, Edition 1.0. EUROCONTROL (2003)
10. Frequentis, DFS: iCWP
R
- Integrated Controller Working Position. SESAR (2012)
11. GAIN, Working Group B: Analytical Methods and Tools, Guide to Methods and Tools
for Safety Analysis in ATM, http:// flightsafety.org/ files/ methods tools safety analysis.pdf.
GAIN (2003)
12. Guo, Q., Agichtein, E.: Exploring mouse movements for inferring query intent. Conference
on Research and Development in Information Retrieval. ACM SIGIR ’08, New York (2008)
707-708
13. Hart, S.G.: NASA-Task Load Index (NASA-TLX); 20 years later. NASA technical report,
http:// humansystems. arc. nasa.gov/ groups/ TLX/ tlxpublications.html. NASA (2006)
14. Hoang, T., Jung, Y. C., Holbrook, J. B., Malik, W. A.: Tower Controllers Assessment of
the Spot and Runway Departure Advisor (SARDA) Concept. Ninth USA/Europe Air Traffic
Management Research and Development Seminar (2011)
15. Huang, J., White, R., Buscher, G.: User see, user point: gaze and cursor alignment in web
search. CHI’12 (2012) 1341-1350
16. Janetzko, H., Stoffel, F., Mittelstadt, S., Keim, D. A.: Anomaly detection for visual analytics
of power consumption data. Vol. 38. Computers & Graphics. Elsevier (2014) 27-37
17. Jouili, S., Vansteenberghe, V.: An Empirical Comparison of Graph Databases. International
Conference on Social Computing (SocialCom) (2013) 708-715
18. Karahasanovic, A., Andersen, B., Hansson, L., Langlo, J. A., Swengaard, H. E., Zeh, T.,
Grantz, V., Rubenser, R.: Zero Failure Management at Maximum Productivity in Safety
Critical Control Room. SID2011 (EUROCONTROL; ISBN 978-2-87497-024-5). SESAR;
Project N:10.10.02 (2011)
47
Increasing Fault Tolerance in Operational Centres using Human Sensing Technologies: Approach and Initial Results
47

19. Keim, D., Andrienko, G., Fekete, J., Gorg, C., Kohlhammer, J., Melancon, G.: Information
Visualization - Human-Centered Issues and Perspectives. Lecture Notes in Computer Sci-
ence. Springer (2008) 154-175
20. Lam, H.: A Framework of Interaction Costs in Information Visualization. Vol. 14. IEEE
Trans. Vis. Comput. Graph. (2008) 1149-1156
21. Langlo, J. A., Wegner, E., Karahasanovic, A., Hansson, L., Swengaard, H., Andersen, B.,
Zeh, T., Kind, S., Rokitansky, C., Gr
¨
aupl, T.: Usefulness of FMECA for improvement of
productivity of TWR process. SID2012 (2012)
22. Lehmann, S., D
¨
orner, R., Schwanecke, U., Haubner, N., Luderschmidt, J.: UTIL: Complex,
Post-WIMP Human Computer Interaction with Complex Event Processing Methods. Work-
shop ”Virtuelle und Erweiterte Realitt” der GI-Fachgruppe VR/AR, Aachen (2013) 109-120
23. Myers, B., Hudson, S. E., Pausch, R.: Past, Present, and Future of User Interface Software
Tools. Vol. 7. ACM Trans. Comput.-Hum. Interact. (2000) 3-28
24. Patern, F., Santoro, C.: User Interface Evaluation When User Errors May Have Safety-
Critical Effects. INTERACT 01, Tokyo (2001) 270-277
25. Perez, D., Zhang, L., Schaefer, M., Schreck, T., Keim, D., Diaz, I.: Interactive feature space
extension for multidimensional data projection. Vol. 150. Neurocomputing. Elsevier (2015)
611-626
26. Rayner, K., Li, X., Williams, C., Cave, K., Well, A.: Eye movements during information pro-
cessing tasks: Individual differences and cultural effects. Vol. 47. Vision Research. Elsevier
(2007) 2714-2726
27. Salvucci, D.: Inferring intent in eye-based interfaces: tracing eye movements with process
models. CHI’99 (1999) 254-261
28. Sauro, J., Lewis, j.: Quantifying the User Experience: Practical Statistics for User Research.
MK (2012) 19-157
29. Seminario, C., Wilson, D.: Case Study Evaluation of Mahout as a Recommender Platform.
Workshop on Recommendation Utility Evaluation: Beyond RMSE (2012) 45-50
30. Shorrock, S., Kirwan, B.: Development and application of a human error identification tool
for air traffic control. Applied Ergonomics (2002)
31. Silva, N., Eggeling, E., Settgast, V., Dieter, F.: Sixth sense - air traffic control predic-
tion scenario augmented by sensors. i-KNOW ’14 Proceedings of the 14th International
Conference on Knowledge Technologies and Data-driven Business, Article no. 34. doi:
10.1145/2637748.2638441 (2014)
32. Steiger, M., Bernard, J., Mittelstadt, S., Lucke-Tieke, H., Keim, D., May, T., Kohlhammer,
J.: Visual Analysis of Time-Series Similarities for Anomaly Detection in Sensor Networks.
Computer Graphics Forum (2014) 401-410
33. Stoffel, F., Fischer, F., Keim, D.: Finding Anomalies in Time-series Using Visual Correlation
for Interactive Root Cause Analysis. VizSec. ACM (2013) 65-72
34. Tsonis, C.: An analysis of information complexity in air traffic control human machine in-
teraction. HAL2006-04. MIT (2006)
35. Winkelholz, C., Schlick, C.: Statistical variable length Markov chains for the parameteriza-
tion of stochastic user models from sparse data. IEEE International Conference on Systems,
Man and Cybernetics (2004) 1770-1776
36. Xing, J., Manning A. C.: Complexity and Automation Displays of Air Traffic Control: Litera-
ture Review and Analysis, Final Report, Civil Aerospace Medical Institute, Federal Aviation
Administration. Office of Aerospace Medicine, Washington DC (2015)
37. Xu, F., Griffiths, T.: Probabilistic models of cognitive development: Towards a rational con-
structivist approach to the study of learning and development. Journal of Cognition. Elsevier
(2011) 299-301
38. Yampolskiy, R.V.: Behavioral Modeling: an Overview. Vol. 5. American Journal of Applied
Sciences (2008) 496-503
48
EPS Berlin 2015 2015 - European Project Space on Computer Vision, Graphics, Optics and Photonics
48

39. Zhang, J., Ren, J., Wu, C.: Modeling air traffic controllers’ decision making processes with
relational complexity network. IEEE 17th International Conference on Intelligent Trans-
portation Systems (2014) 2663-2668
49
Increasing Fault Tolerance in Operational Centres using Human Sensing Technologies: Approach and Initial Results
49
