
Waveguide Evanescent Field Microscopies for Application in
Cell- and Bacteria- Biophysics
Silvia Mittler
Department of Physics and Astronomy, The University of Western Ontario, London, ON, N6G2P6, Canada
Keywords: Waveguide, Evanescent Illumination, Microscopy, WEEF and WEFS, Cells, Bacteria, Fluorescence,
Scattering, Distance Mapping, Granularity, Application as a Sensor.
Abstract: Two evanescent field microscopy technologies based on glass slab waveguides with permanent coupling
gratings are presented: waveguide evanescent field fluorescence microscopy (WEFF) and waveguide
evanescent field scattering microscopy (WEFS). The technologies are briefly described: the experimental
setup is based on a conventional inverted microscope. A comparison to TIR and TIRF microscopy is given.
The advantages of the waveguide method are clearly addressed. Various examples from for WEFF and
WEFS microscopy are given. For WEFF: static distance mapping with a multimode waveguide, dynamic
solubilisation studies of cell plasma membranes and the kinetic response of osteoblasts to trypsin. For
WEFS: bacteria sterilization as well as cell adhesion and granularity studies. The latest development is a
mass producible all-polymer-waveguide-chip to bring the technology to the interested scientific community.
1 INTRODUCTION
With the aim of developing new medical devices
with direct tissue contact, drug delivery vehicles,
and tissue engineering scaffolds, there has been
increasing interest in recent years in the interactions
of cells with both synthetic and natural biomaterials
(Niu et al., 2005; Storrie et al., 2007). In particular,
the study of the contact regions between a cell and
its substratum is of considerable interest as its
investigation delivers inter alia information about
the cytocompatibility of the substratum - the affinity
of cells towards that particular surface. Promotion or
inhibition of cell adhesion to synthetic and natural
biomaterials is often crucial to the proper function of
a particular device. Some information concerning
these interactions, e.g. the lateral location and the
density of the adhesion sites, as well as their
relationship to the actin stress fiber system, part of
the cell's cytoskeleton, can be inferred from
fluorescence microscopy of immunolabeled
molecules involved in adhesion; typically, vinculin,
a protein located within the multi-protein complex
that anchors the adhesion to the cytoskeleton inside
the cell (Burmeister et al., 1998). These methods
only deliver signals from the focus volume and no
information about adhesion distances to the
substratum. However, a direct and quantitative
method to address the distance to the substratum is
highly attractive. To address this need, different
microscopic techniques based on electron
microscopy (Chen and Singer, 1982) and optical
means such as evanescent fields and interference
techniques have been developed. Total internal
reflection fluorescence (TIRF) (Burmeister et al.,
1998; Burmeister et al., 1994), surface plasmon
resonance microscopy (SPRM) (Giebel et al., 1999),
interference fluorescence microscopy (IRM)
(Verschueren, 1985), fluorescence interference
contrast (FLIC) microscopy (Braun and Fromherz,
1997) and combinations thereof (Burmeister et al.,
1998; Atilgan and Ovryn, 2009) have been used to
visualize and quantify these contacts. The contacts
themselves had been discovered by interference
reflection microscopy (IRM) in the 1970s
(Abercrombie et al., 1971).
Bacteria, on the other hand, are the most
metabolically diverse group of organisms found in
all natural environments including air, water and
soil. Bacteria commonly occur with food sources
and are also found within and on our bodies.
However, concerns exist over contamination of
food, water, and air by pathogenic bacteria (Sapsford
Mittler, S.
Waveguide Evanescent Field Microscopies for Application in Cell- and Bacteria- Biophysics.
DOI: 10.5220/0005618302010212
In Proceedings of the 4th International Conference on Photonics, Optics and Laser Technology (PHOTOPTICS 2016), pages 203-214
ISBN: 978-989-758-174-8
Copyright
c
2016 by SCITEPRESS – Science and Technology Publications, Lda. All rights reserved
203

and Shiver-Lake, 2008) that can enter our bodies
through ingestion, inhalation, cuts or lacerations
(Pizarro-Cerda and Cossart, 2006). Therefore, there
is an increasing interest in bacterial contamination
and the need for anti-bacterial surfaces not only for
application in the food industry but also for medical
and hygienic purposes (Oliver, 2005). Over two
million hospital-acquired cases of infection are
reported annually in the USA, which lead to
approximately 100,000 deaths annually and added
nearly $5 billion to U.S. healthcare costs (Madkour
and Tew, 2008; Madkour et al., 2009).
Contamination of medical devices (e.g., catheters
and implants) has been attributed to 45% of these
infections (Stamm, 1978).
Bacterial contamination
of any surface typically begins with the initial
adhesion of only a few cells that can then develop
into a more structurally cohesive biofilm in less than
24 hours when provided with suitable nutrient
conditions sustaining metabolism and cell division
(Hetrick and Schoenfisch, 2006). Therefore, a better
understanding of bacterial adhesion to surfaces is
important for technical surface development and in
biomedical applications. However, the precise
measurement of bacterial adhesion to surfaces are
difficult and time consuming because bacterial cells
typically occur on the micrometer-scale and their
adhesion forces are generally low‚ typically 0.1–100
nN (Christianson, 2004). Recent studies on the
detection of bacteria on surfaces have focused on
similar imaging systems as with cells such as optical
(Vasilev et al., 2009) and fluorescent microscopy
(Pires et al., 2013) to image the bacteria themselves
or luminescence measurement of the presence of
cells by ATP (adenosine triphosphate) detection
systems (Pera et al, 2010). Surface Plasmon
Resonance (SPR) sensors (Taylor et al., 2008),
Nucleic Acid Detection (Schmidt et al, 2006),
Optical Waveguide Lightmode Spectroscopy
(Cooper et al., 2009), Optical Leaky Waveguide
Sensors (Zourob et al., 2005), and Evanescent Mode
Fiber Optic Sensors (Mazhorova et al., 2012) have
also been applied in order to detect biochemical
toxins as signatures of bacteria.
In conclusion, it is important to have methods
which are able to investigate interfaces between a
technical surface and a bacterium or cell.
In recent years, Total Internal Reflection
Fluorescent (TIRF) microscopy has been
demonstrated to be an effective method for studying
cell-substrate interactions that occur at surfaces and
interfaces. Using TIRF microscopy, the behaviour of
various types of cells (Bauereiss et al., 2015: Liu,
2015) and bacteria (Smith et al., 2002, Vigeant et al.,
2001) near surfaces has been characterized. Total
Internal Reflection (TIR) Microscopy utilizes the
basic technology of TIRF without any fluorescence
dyes present in the sample by creating an optical
contrast due to scattering (Byrne et al., 2008).
Recent studies have also demonstrated the use of
TIR for imaging microbial adhesion.
The waveguide evanescent field scattering
technique was developed by Thoma et al. (Thoma et
al., 1997; Thoma et al., 1998) for ultrathin technical
structures on surfaces using ion exchanged
waveguides. Later, Waveguide Evanescent Field
Fluorescence (WEFF) microscopy was developed
(Grandin et al., 2006; Agnarsson et al., 2009;
Horvath et al. , 2005; Hassanzadeh et al., 2008) as a
straightforward alternative to TIRF microscopy for
imaging ultrathin films and cell-substrate interaction
using fluorescence dyes located in the plasma
membrane.
This paper will give an overview on biophysical
applications of WEFF and WEFS microscopy on
cells and bacteria and a short outlook on current
developments to offer the methods to a broader user
base.
2 EXPERIMENTAL
2.1 Waveguides
In this study home-fabricated, glass on fused silica,
step-index slab waveguides or ion exchanged
waveguides with holographic coupling gratings were
used (Hassanzadeh and Mittler, 2011; Halfpap et al.,
2012). The waveguides were reusable various times
after thorough cleaning. A typical cleaning
procedure consisted of a submersion in 70% ethanol
(Aldrich, Canada) with sonication (Branson 2510,
Branson, USA) for 20 min and a blow-dry with
nitrogen gas. To remove organic material, the dried
samples were cleaned with Nano-Strip (KMG
Chemicals Inc., Fremont, CA) at 80°C for 5 minutes.
After the Nano-Strip application, the substrata were
rinsed extensively in Milli-Q water and blown dry
again.
2.2 Cell Culture
The osteoblastic cell line MC3T3-E1 (subclone 4,
ATTC Catalog 3 CRL-2593) were cultured in flasks.
The cleaned waveguides were sterilized for 3 hours
by UV light. Growth medium was prepared from
17.8 ml α-minimum essential medium 1X (MEM;
Gibco), 2 ml fetal bovine serum (FBS; Gibco) and
PHOTOPTICS 2016 - 4th International Conference on Photonics, Optics and Laser Technology
204

0.2 ml antibiotic-antimycotic solution 100X (Anti-
Anti; Gibco). First the medium was aspirated from
the cell culture flask. Dulbecco’s phosphate-buffered
saline 1X (PBS; Gibco) was added to wash the cell
layer and aspirated subsequently. To detach the
osteoblasts from the vessel wall, 5 ml trypsin-EDTA
(0.05%, Gibco) was added and incubated at 37°C for
5 minutes. The culture was checked by phase-
contrast microscopy to confirm that cells were
released into the suspension. The trypsin was
neutralized by adding 9 ml growth medium to the
flask. The resulting cell suspension was diluted in
growth medium to 10,000 cells per ml. Waveguides
were placed in a Petri dish and 1 ml cell suspension
per substrate was applied to the surfaces. Samples
were then incubated for 24 h at 37°C, 100%
humidity and 5% CO
2
.
The waveguides were removed from the growth
medium and excess medium was aspirated. Next,
each waveguide was rinsed three times in PBS. For
fixation, the waveguides with the cells on top were
placed in a solution of 4% paraformaldehyde in PBS
for 10 minutes at room temperature. Subsequently,
samples were rinsed three times with PBS. To
prevent desiccation, samples were kept in PBS until
further treatment. A solution was prepared from 1.5
mg DiO in 1 ml dimethyl sulfoxide (DMSO) and
heated to 37°C within 5 minutes. This mixture was
sedimented for 5 minutes at 2000 rpm to separate
solid residues. Ten μl of this stock solution was
dissolved in 1 ml growth medium to form the
staining solution. The staining solution (200 μl) was
pipetted onto the corner of each waveguide and the
waveguide gently agitated until all cells were
covered with staining solution. The samples were
left in the solution for 20 minutes to incorporate the
dye. Afterwards, the staining solution was drained
and the waveguides were washed in PBS. For the
removal of all unbound dye, the samples were
immersed in PBS for 10 minutes and drained again.
The entire wash cycle was repeated two more times.
The waveguides were stored in PBS until
performing WEFF microscopy. This procedure
delivers fixed cells, cells that are “frozen” in their
habitus (Lanier, 1981; Smit, 1974; Su, 2014) with
the dye situated in the plasma membrane of the cells.
2.3 Bacteria Culture
Nitrobacter sp. 263 was cultured on R2A (Difco™)
plates at room temperature (approximately 23°C) for
two weeks. For each colonization experiment,
bacteria from one R2A plate were removed and
suspended in 1 ml of filter-sterilized (0.45 μm pore-
size) distilled deionized water to produce an aqueous
bacterial suspension (with 10
6
bacteria/ml). A
separate stock solution of R2B (i.e., broth/liquid
culture medium) was made by dissolving R2A in
sterile, distilled, deionized water and filtering this
solution to remove the agar constituent leaving the
dissolved nutrients for bacterial growth.
Bacterial attachment to the waveguide surface
was achieved by placing a 50 μl aliquot of the
bacterial suspension on top of the waveguide for one
hour at 37°C. After bacteria attached to the surface,
the waveguide was rinsed with sterile, distilled water
and placed in a sterile Petri dish containing 20 ml of
R2A and incubated for 24 hours at 37°C to allow the
attached bacteria to grow. The samples were not
agitated. After 24 hours incubation, the waveguides
were examined using bright field microscopy to
determine whether microcolonies had formed. Note
that all images were taken of live cells in growth
medium. Samples were then analysed using WEFS
microscopy.
Sterilization experiments were performed.
Separate bacteria suspensions of 10 ml (with 10
6
bacteria/ml) were placed in a sterile, open glass dish
and exposed in a low pressure collimate beam
apparatus (LPCB) to induce sterilization (Hedrick et
al., 2007; Kuo et al., 2003) at doses of 2, 4, 8, 14, 20
and 30 mJ/cm
2
by
increasing time to produce
different doses (Kuo et al., 2003). This mode of UV
photon sterilization was chosen for its common use
in industrial applications and its ability to disrupt
and dimerize neighboring DNA bases (thymine
dimerization) that hinders bacterial growth but not
viability (Berney et al., 2007; Durbeej and Eriksson,
2002). Each ‘sterilized’ bacterial suspension,
produced via the different dose exposures, was used
in an identical colonization experiments as described
above.
It is important to note that prior to the first and
second colonization experiment, separate aliquots of
all bacterial suspensions (1ml) were stained using
BacLight
TM
(Invitrogen) Live-Dead stain and
examined using fluorescence microscopy to confirm
that the cells were viable.
2.4 WEFF and WEFS Microscope
The WEFF and WEFS microscope (Hassanzadeh et
al., 2008) consisted of an inverted microscope
(Zeiss, Oberkochen, Germany) with the waveguide
being located on the sample stage (Fig.1). The
specimen was positioned on top of the waveguide.
An argon ion laser (35 LAP 341-200, CVI Melles
Griot) operated at λ = 488 nm with a variable output
Waveguide Evanescent Field Microscopies for Application in Cell- and Bacteria- Biophysics
205
power of 7- 126 mW or a HeNe laser with a
wavelength of 543.8 nm (Research Electro-Optics,
0.5 mW) were used as light sources in WEFF and
WEFS microscopy, respectively. A neutral density
filter was placed directly behind the laser for power
reduction, avoiding bleaching and overexposure. An
iris aperture controlled the beam diameter.
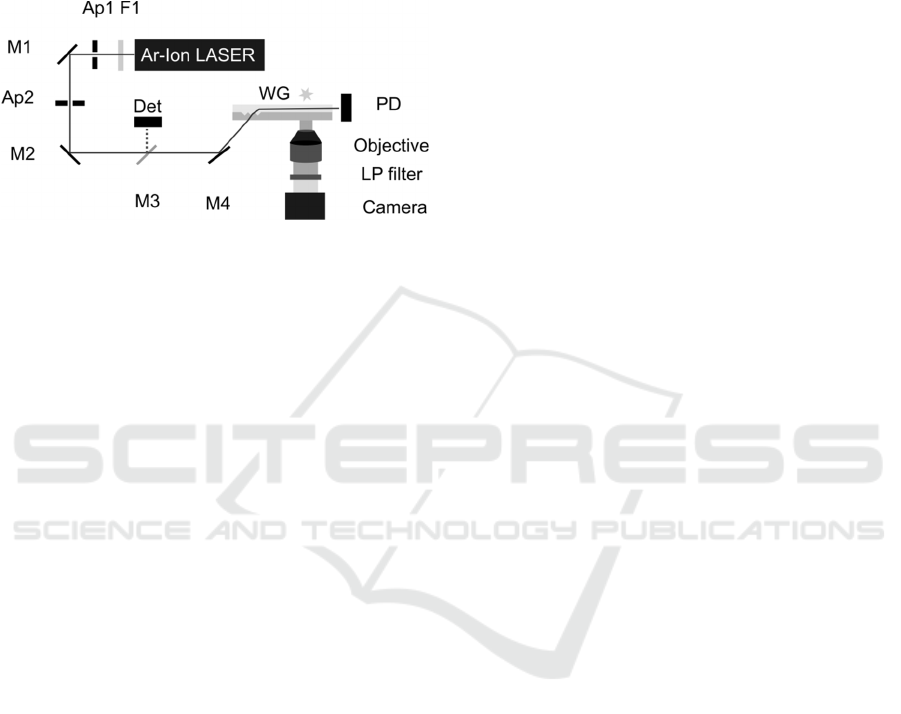
Figure 1: Schematic of WEFF microscope. Ap: aperture,
F1: neutral density filter, M: mirror, WG: waveguide, PD:
photo diode. For WEFS microscopy a HeNE laser was
used and the LP filter omitted.
The laser beam was coupled into a chosen
waveguide mode by a coupling grating located on
the waveguide. In the case of WEFF microscopy, the
undesired excitation wavelength was blocked with a
long pass filter with a cut-off wavelength of λ
cut-off
=
490 nm (3RD490LP, Omega Optics, Brattleboro,
VT) which was fitted between the objective and the
camera. The out-coupled intensity at the end of the
waveguide was captured with a large active area
photodiode (FDS1010, Thorlabs, Newton, NY) for
determining the coupling efficiency when needed. A
cooled CCD-camera (Persuit - XS 1.4 Diagnostic
Instruments Inc., Sterling Heights, MI), controlled
with SPOT 5 Basic (Spot Image Solutions, Sterling
Heights, MI) was connected to a computer. Image
data were exported for processing. Additionally,
bright field microscopy images of the samples were
captured with the same field of view/objective lens
as the WEFF/WEFS microscopy images and
processed with Image Pro Express (Media
Cybernetics, Rockville, MD).
3 TIRF/TIR AND WEFF/WEFS
COMPARISON
Both microscopy suits, TIRF/TIR and
WEFF/WEFS, employ evanescent fields for sample
illumination at the surface of a substrate which are
produced by total internal reflection. In modern
TIRF/TIR microscopes a laser beam is guided opto-
mechanically within the microscope and the
objective lens to allow a laser beam to undergo total
internal reflection at a high refractive index substrate
which carries the specimen and is located above the
objective lens. Costly state-of-the art equipment and
objective lenses with specially designed high
magnification and high numerical aperture
objectives and built-in optical path control are
necessary. Theoretically, all angles above the critical
angle of TIR can be achieved in this way, giving the
possibility to achieve different penetrations depth
with different angles. This can be used to measure
distances from the substrate surface (Truskey et al.,
1992). Practically, the microscopes are set to
particular angles, typically to receive a high quality
TIRF or TIR image and a high quality epi-
fluorescence or bright field image, respectively,
taken with a transmitting beam.
On the other hand, operating a TIRF/TIR
microscope manually can easily lead to a loss of the
evanescent mode and to a full specimen exposure to
the laser beam resulting in a damaged sample.
Reviewing the literature and in particular the use
of TIRF microscopy for distance measurements
shows that besides Burmeister’s excellent work in
the middle of the 1990s (Burmeister et al., 1994)
during the development phase of TIRF microscopy
only little has been published on exploiting different
penetration depths.
TIR microscopy is performed identically but
excluding the dye from the samples and the
necessary filter sets. Scattered photons instead of
fluorescence photons are collected. Bright field
images are taken for comparison since epi-
fluorescence is not possible. Little distance work has
been published involving TIR microscopy (Smith et
al., 2002). This is not surprising since the scattering
intensities are hard to analyse because all refractive
index fluctuations present in the evanescent field
contribute to the signal and these are not necessarily
controllable, in particular with living cultures
producing extracellular matrix in the case of cells or
extracellular polymeric substance (EPS) when
imaging live bacteria.
In WEFF/WEFS microscopy the resonances of
the waveguide modes dictate the available
evanescent fields and penetration depths. So the
number of choices is limited by the number of
modes propagating in the waveguide. In TIRF and
TIR microscopy, the penetration depth of the
evanescent field is limited to a maximum of ~ 200
nm, whereas a waveguides can produce penetrations
depths from below 100 nm to over a μm by tuning
the refractive index and thickness architecture of the
PHOTOPTICS 2016 - 4th International Conference on Photonics, Optics and Laser Technology
206
core and cladding layers (Agnarsson et al., 2009).
Planar waveguides also offer an extended
illumination area over macroscopic dimensions only
limited by the attenuation of the propagating
waveguide mode.
In addition, the beam in WEFF/WEFS can never
escape the waveguide; therefore WEFF and WEFS
microscopies carry the intrinsic safety mechanism of
avoidance of sample overexposure and damage.
In well characterized waveguides the evanescent
fields and penetration depth are well known
quantities and can be used for quantitative
measurements (Hassanzadeh et al., 2009).
WEFF and WEFS microscopy do not desire
state-of-the-art microscopes or objective lenses.
WEFF and WEFS technologies are based on a few
simple accessories and attachments to a standard
inverted microscope. It is therefore straightforward
to image the specimen in any magnification and
field of view available due to standard long distance
objective lenses by just turning the objective lens
revolver without the necessity of beam stirring. Due
to the evanescent field formation being taken care of
by the substrate and completely independent from
the entire microscope, different field of views or
magnifications still deal with the same illumination
conditions allowing direct comparison of images or
measurements after changing magnification.
Epi-fluorescence images can be achieved by
simply enhancing the integration time of image
acquisition. This is due to non-perfect waveguides:
every waveguide scatters slightly and therefore
supplies the 3D volume of the specimen with
excitation or scattering photons.
Comparing TIRF and WEFF images of the same
samples has shown identical image information
(Hassanzadeh et al., 2010). Both microscopy
technology suits are diffraction limited, therefore the
lateral resolution depends on the chosen laser
wavelength and the highest possible magnification
lens supported by the microscope used. The
resolution in z-direction (perpendicular to the
substrate) lies in both types of microscopes in the
order of ~7 nm.
To achieve a wide use of WEFF and WEFS
microscopy in the interested research communities it
is necessary to have simple access to and supply of
inexpensive waveguide substrates. Therefore it is
necessary to develop a mass producible waveguide-
chip.
4 STATIC DISTANCE MAPPING
WITH A MULTIMODE
WAVEGUIDE
A waveguide with a thickness of 651 ± 2 nm and a
refractive index of n = 1.840 ± 0.001 was used for
mapping the distances of the dye located in the
plasma membrane of fixed osteoblasts. The volume
above the waveguide was assumed to be water with
a refractive index of 1.33 for simulating the
evanescent fields. Two images taken with the TM
1
and TM
2
mode were used to calculate the dye
distance map (Fleissner et al., 2015).
The WEFF image in Fig.2 depicts four
osteoblasts well spread and indicating the nuclei and
some cell extensions. A false colour representation
of Fig.2 can be found in (Fleissner et al., 2015). The
dye distance map depicts lower distance grey values
(dark) in the area of the cells from close to 0 to ~
130 nm. In the unoccupied area, the unstained
medium, where the raw data do not show
fluorescence intensities, only noise is present. This is
depicted as distances in the order of the penetration
depth of the evanescent field: ~160 ± 40 nm (noisy,
dotty area). In addition, isolated spots in the no-
sample area (outside the cells) are visible in black.
These spots are correlated to un-physical distance
values below zero caused by microscopic damages
of the waveguide. These un-physical distances
should always be omitted in image interpretation.
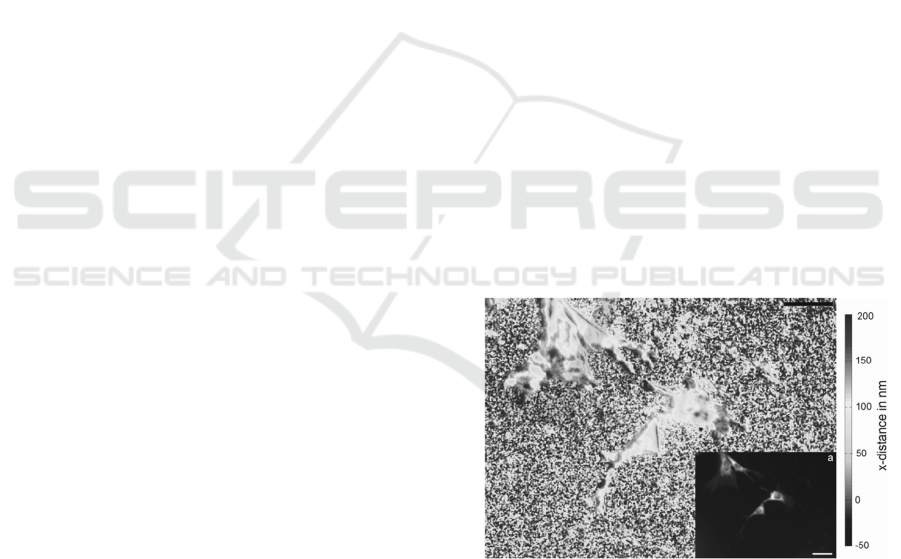
Figure 2: B/w representation of a dye distance map with
four osteoblasts. The inset represents a WEFF image with
increased integration time of the same field of view. The
scale bar represents 50 μm.
All four osteoblasts can be found in the distance
map and show cell outlines similar to the cells
depicted in the “epi-fluorescence” image. However,
the lamellipodia and the thinly spread cell body are
even clearer in the distance map. In Fig.2, the
distance map does not depict any information about
Waveguide Evanescent Field Microscopies for Application in Cell- and Bacteria- Biophysics
207
the nuclei. Not the entire cell body reached down
very close to the surface, as expected. At some of
the cells’ outer lines and at some extreme tips of the
spread cells, small regions – only a few pixels in
diameter – were found with distances of ~10 - 25
nm, typical of a focal adhesion (Chen and Singer,
1982; Tawil et al., 1993).
Twice line like accumulations of dense focal
adhesions are found (very dark lines with distances
around 10 - 25 nm). Between the focal adhesions,
there are regions in lighter dark grey depicting
distances around 40 -50 nm as well as grey areas
depicting distances around 70 - 80 nm. Lamellipodia
of the cells, which are very faintly seen in the epi-
fluorescence images, are clearly visible in the
distance map as thin spikes with a dark grey
(possible focal adhesions or point contacts) or lighter
dark grey (possible extracellular matrix contacts)
center and bright grey to white surroundings (Chen
and Singer, 1982).
Fig.3 (b in false colour representation in
(Fleissner et al., 2015)) depicts one well spread
osteoblast in epi-fluorescence WEFF and grey scale
distance map imaging. Fig.4 shows the two z-cuts
through the distance map: one randomly through the
cell, (Fig.4a) and one through an area including the
smallest distances of the cell (Fig.4b).
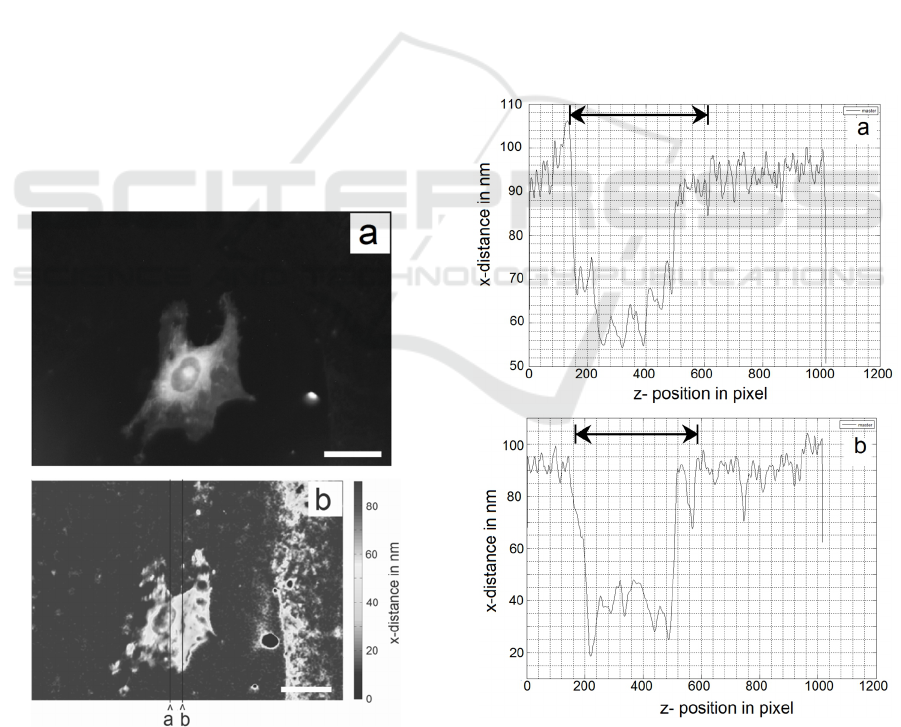
Figure 3: Single osteoblast. a) Epi-fluorescence WEFF
image and b) b/w representation of the dye distance map
with z–cuts. The scale bars represent 25μm.
The area outside the cell is nearly
homogeneously dark grey. The existing noise level
in the no-sample regions is clearly depicted in the z-
cut data; it is the noisy data at an average distance of
~ 90 nm on both sides of the cell. The cell itself is
shown by the depressions in the z-cuts with the dips
indicating adhesions. The spreading of the cell is
excellently depicted by the distance map. The cell is
attached at all extreme spreading points, however
not necessarily as focal adhesions since, distances
above 40 nm and up to 50 nm, possible close
contacts, are found. In the centre of the cell, focal
adhesions are present.
The z-cuts show the position of the plasma
membrane/dye location along the cut line in nm. For
the random cut ‘a’, three “small” distances in the
order of ~ 55 nm are found, as well as a couple of
more bends towards the substratum with distances of
~ 62 - 67 nm. The maximum heights of the plasma
membrane from the waveguide surfaces between the
bends towards the substratum are found to be
between 62 and 75 nm.
Figure 4: z-cut through cell at random position ‘a’ through
cell at smallest distance locations at position ‘b’ in Fig.3.
The cuts in Fig.3 from bottom to top are represented in
Fig.4 from left to right. The scale bars represent 25μm.
Arrows depict cell position.
PHOTOPTICS 2016 - 4th International Conference on Photonics, Optics and Laser Technology
208
In the z-cut ‘b’ through the small distance
adhesions one focal adhesion at 18 nm is found as
well as contacts with distances of 25 – 35 nm. The
maximum heights of the plasma membrane from the
waveguide surfaces in this case are 37 and 45 nm.
The bending of the membrane towards the
cytoplasm between these adhesions points is clearly
depicted. The relative straight lines between the
“maxima and minima” in the distance curve bear a
resemblance to a stretched rubber band. One needs
to keep in mind that the surface tension of the
plasma membrane tries to minimize the surface area,
trying to force the cell into a spherical shape. The
adhesions are obvious biological disruptions of the
physical effect of surface minimization.
With the current set-up it is not possible yet to do
time laps distance mapping. An automatic motorized
mirror adjustment for M4 (Fig.1) needs to be
implemented.
5 DYNAMIC SOLUBILISATION
STUDIES OF CELL PLASMA
MEMBRANES
Detergent-membrane interactions have been the
subject of many studies (Ngassam et al., 2012).
Functional membranes typically exist in the fluid
state also called the liquid-disordered state. Due to
difficulties of working with authentic cell
membranes, simplified membrane models - such as
supported lipid bilayers or liposome mimicking
biological systems - have often been used to
investigate detergent-membrane interactions
(Ngassam et al., 2012). Model membranes were
helpful in exploring the basic membrane functions.
However, in comparison to a living cell, with
integral and peripheral proteins, cholesterol
molecules and oligosaccharides in and on their
plasma membrane, artificial membrane models
cannot mimic all aspects of plasma membrane
function. In addition, studying the interaction
between lipids and detergents in the form of vesicles
(liposomes) or supported lipid bilayers has several
other disadvantages. For example, in supported lipid
bilayers, the quality of the deposited film plays a
major role. The direct contact with the underlying
substrate affects the bilayer’s structure and fluidity,
and blocks access of solutions to both sides of the
membrane.
The results of lipid-detergent interaction studies
using bio-membrane models have been related to a
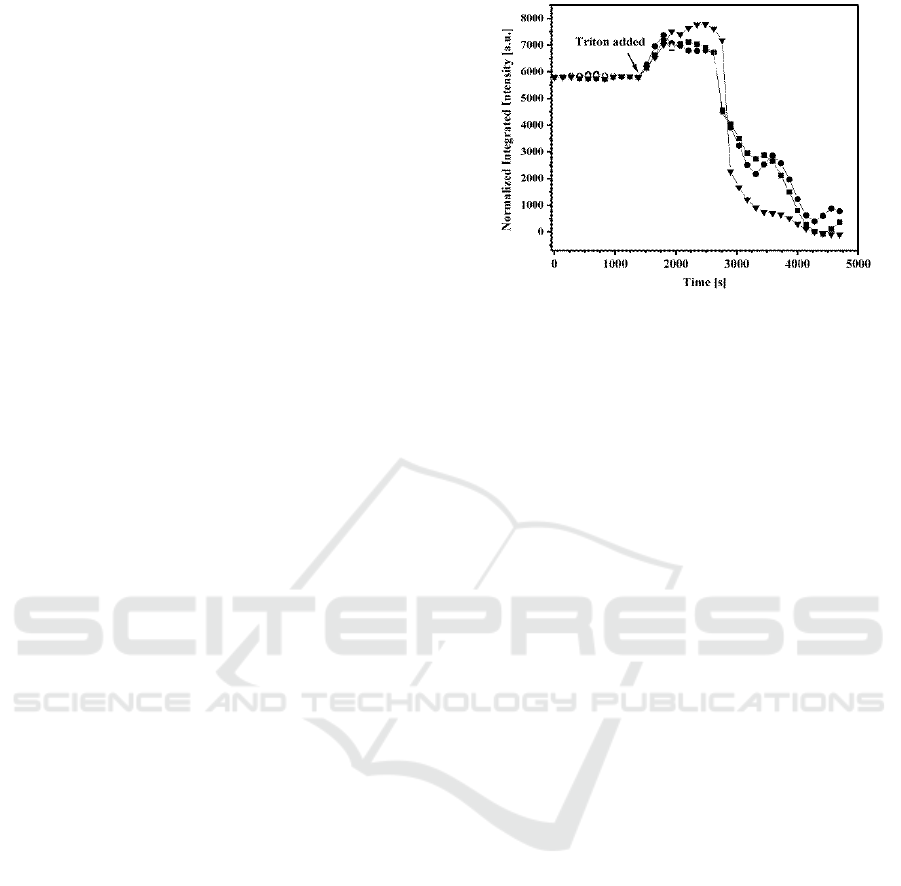
Figure 5: Normalized, integrated intensities of three cells
versus time. Triton X-100 (0.013 w/w%) was added where
indicated by the arrow.
three-stage model, which was described by
Lichtenberg et al. (Lichtenberg et al., 1985). In stage
I, with increasing detergent concentration, detergent
incorporates into the bilayer. At this stage,
solubilization does not occur, but the bilayer
becomes saturated with detergent. At stage II, with
further increase in detergent concentration, the
bilayer starts to solubilise. Lipid vesicles saturated
with detergent form and coexist with mixed micelles
of lipid and detergent. At stage III, the entire
membrane solubilises, and only mixed micelles exist
(Csucs and Ramsden, 1998; Helenius and Simons,
1975).
Osteoblast were cultured on the waveguides and
imaged alive with time laps WEFF microscopy. At a
certain time Triton X-100 was added to the medium
to start solubilisation. Fig.5 shows the normalized
integrated intensity of the WEFF fluorescence signal
of three example cells imaged with time.
In the absence of detergent, the integrated
intensities are constant indicating negligible photo
bleaching. In the presence of the detergent, three
reproducible kinetic stages were found: i) an
increase in fluorescence intensity, ii) a plateau, and
iii) a decrease in intensity. Therefore, a comparison
to or an adaption of the established three-stage
model is possible. In stage I, the membrane takes up
detergent and the concentration of detergent rises in
the plasma membrane. The integrated fluorescence
intensity increases due to suppression of fluorophore
quenching by dilution of the dye with detergent
(Silvius, 1992) in the cell membrane. In this stage,
solubilisation does not occur. According to the
model, stage I ends when the membrane becomes
saturated with detergent. The end of stage I is seen
in Fig.5 when the intensity increase ends and the
plateau starts.
Waveguide Evanescent Field Microscopies for Application in Cell- and Bacteria- Biophysics
209
In stage II of artificial membrane solubilisation,
the detergent-saturated lipid bilayer undergoes a
structural transition and converts partially into lipid-
detergent mixed micelles; however, these micelles
are not yet mobile, but still incorporated in the
membrane. Therefore, stage II is seen in our data as
the plateau in which intensity remains constant as
the dye is not leaving the evanescent field. At this
time, the dye is still located either in the membrane
or in formed micelles in unquenched conditions
mixed with detergent.
During stage III, the micelles become mobile and
leave the evanescent field, leading to a decrease in
integrated intensity. Individual micelles are too
small to be seen with the WEFF microscope.
By changing the Triton X-100 concentration the
duration of all three phases changed: the higher the
detergent concentration the quicker the solubilisation
stages (Hassanzadeh et al., 2012).
WEFF microscopy confirmed that living
osteoblasts are solubilized in the same way as model
membranes.
6 KINETIC RESPONSE OF
OSTEOBLASTS TO TRYPSIN
Trypsin is a serine protease and cleaves peptide
chains. Therefore, trypsin is used in laboratories to
cleave proteins bonding the cultured cells to the
dish, so that the cells can be suspended in fresh
solution and transferred to fresh dishes.
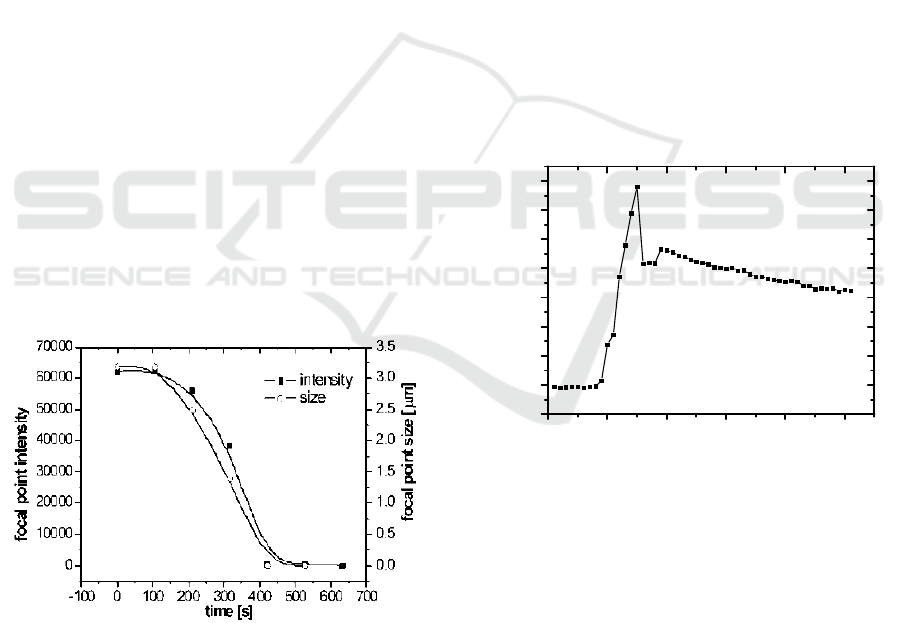
Figure 6: The impact of a 0.05% trypsin containing
medium on an individual focal adhesion: intensity and size
decrease with time. The lines are guides to the eye.
Healthy osteoblast cells were grown directly on
the waveguide and monitored with time laps WEFF
microscopy. Trypsin was used at 0.05% and 0.02%
concentration. Upon addition of 0.05% trypsin, the
cells were lifted very fast and only individual focal
adhesions could be imaged. However, with the lower
concentration changes in cell morphology could be
observed, such as cell retraction.
The quick disappearance of an individual
adhesion point at the high trypsin concentration was
examined. The focal adhesion point had the
appearance of a bright circular dot. A series of
images were taken with time and analyzed. Fig.6
depicts the kinetic behaviour of the adhesion point’s
disappearance, with respect of its integral intensity
and size. Clearly both the size and the integral
intensity of this individual focal adhesion point
decreased in an S-shaped curve and provided
basically identical kinetic information about the
detachment of the cell.
A sample was treated with 0.02% trypsin. The
cells have shown cell retraction, and partly detached
from the surface, leaving a black featureless
evanescent image. After the trypsin treatment the
medium was exchanged carefully to a trypsin-free
environment. The imaging was continued. The
osteoblasts, still alive, re-synthesise new adhesion
proteins for the formation of new adhesion points.
The kinetics of the adhesion process, unit the cell
population died and lost adhesion again, is depicted
in Fig.7.
120 140 160 180 200 220
-2
0
2
4
6
8
10
12
14
intensity [a.u.]
time [minute]
Figure 7: Integrated, intensity of 5 individual re-appearing
adhesion points after exchanging a trypsin-containing
medium at t = 0 to a trypsin-free medium.
7 BACTERIA STERILIZATION
Studies on the attachment of bacteria onto surfaces
using WEFS microscopy detection is a quick method
for investigations regarding bacterial sterilization
treatment (Nahar et al., 2014). We hypothesized that
non-potent, sterilized cells do not attach to surfaces
and do not form microcolonies. Therefore, we have
treated identical bacteria sample batches with
different UV doses (2, 4, 8, 14, 20 and 30 mJ/cm
2
).
PHOTOPTICS 2016 - 4th International Conference on Photonics, Optics and Laser Technology
210
After the UV illumination the viability was
measured. The UV illumination did not result in
bacterial death. As a control, one sample was left
without UV treatment. All bacteria illuminated with
different UV doses and the control were cultured
identically and examined using WEFS microscopy
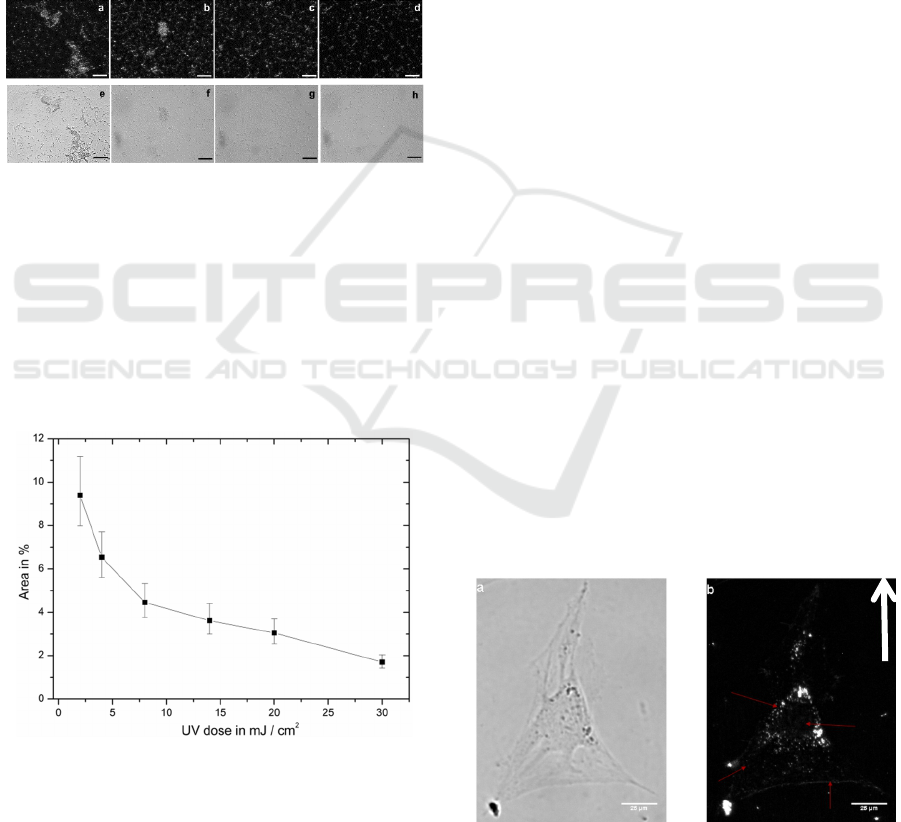
after 24 h. Fig.7 shows a series of WEFS and bright
field images of the control and UV treated bacteria.
The relative signal attributed to attached colonies
and individual bacteria on the waveguide surface
decreased as exposure to UV illumination was
increased (Fig.8). It is significant to note that the
highest dose of 30 mJ/cm
2
was not sufficient to
completely prevent bacterial attachment.
Figure 8: WEFS and bright field microscopy images of
UV illuminated, sterilized bacteria after 24 h of culturing:
a) and e) control: 0 mJ/cm
2
), b) and f) 8 mJ/cm
2
, c) and g)
20 mJ/cm
2
, d) and h) 30 mJ/cm
2
. The scale bars are 50 μm.
Both WEFS and bright field microscopy
demonstrated that the highest dose resulted in the
attachment of primarily individual bacteria,
demonstrating that while attachment still occurred
with increasing UV-dose, microcolony formation
was prevented.
Figure 9: Percentage of occupied area of bacteria versus
applied UV dose. The line is a guide to the eye only.
In order to yield quantitative data, a Matlab
program was written to investigate the intensity
distribution of each WEFS image and to calculate
the percentage of area (i.e., pixels with signals above
the defined threshold) occupied by bacteria (i.e.,
individual cells and cells comprising distinct
colonies). Fig.9 shows the percentage of area on a
sample occupied by bacteria versus the applied UV
dose. Although the percentage of surface area with
attached bacteria was decreasing exponentially, it
did not reach zero. Bacteria were still attached to the
waveguide surface despite the UV treatment.
A rough extrapolation of the exponential curve
suggests that a dose of >100 mJ/cm
2
would be
required to completely hinder all bacterial
attachment to the surface. If this had been a water
sterilization experiment, at least a dose of 200
mJ/cm
2
(double safety) should be applied before
release to the user.
8 CELL GRANULARITY AND
ADHESIONS
Fixed osteoblasts were imaged with WEFS
microscopy. Fig.10 shows a bright field image of a
single osteoblast and the corresponding WEFS
image. In the WEFS image the nucleus can be
located: it is the dark area in the cell centre. In
addition, the granular structures in the cell body and
the adhesion sites at the cell outline are visible.
Fig.10 indicates with the arrow the propagation
direction of the waveguide mode. The cell’s
boundary first hit by the propagating light is shown
very clear and with many adhesions points. The
other three outer lines depict the adhesion points but
not the complete cell boundary. At this chosen
integration time the WEFS image depicts adhesions
due to the evanescent illumination and the cell
granularity due to 3D scattering of the waveguide.
Cell-substrate adhesions could be distinguished
from scattering centres located further away from
the substrate, the granularity of the cell, by varying
the integration time. This is shown in Fig. 11.
Figure 10: a) Bright field image and b) WEFS image of an
osteoblast taken with an exposure time 3000 ms. The
green arrow indicates the direction of light propagation.
The scale bars are 25 μm.
Waveguide Evanescent Field Microscopies for Application in Cell- and Bacteria- Biophysics
211
With a very short integration time only a few
spots appeared on the image in the areas where the
cell was well spread. These spots are the cell’s
adhesions within the evanescent field. With
increasing integration time, more and more features
appeared, such as the cell nucleus area, the cells
boundary and the cell granularity.
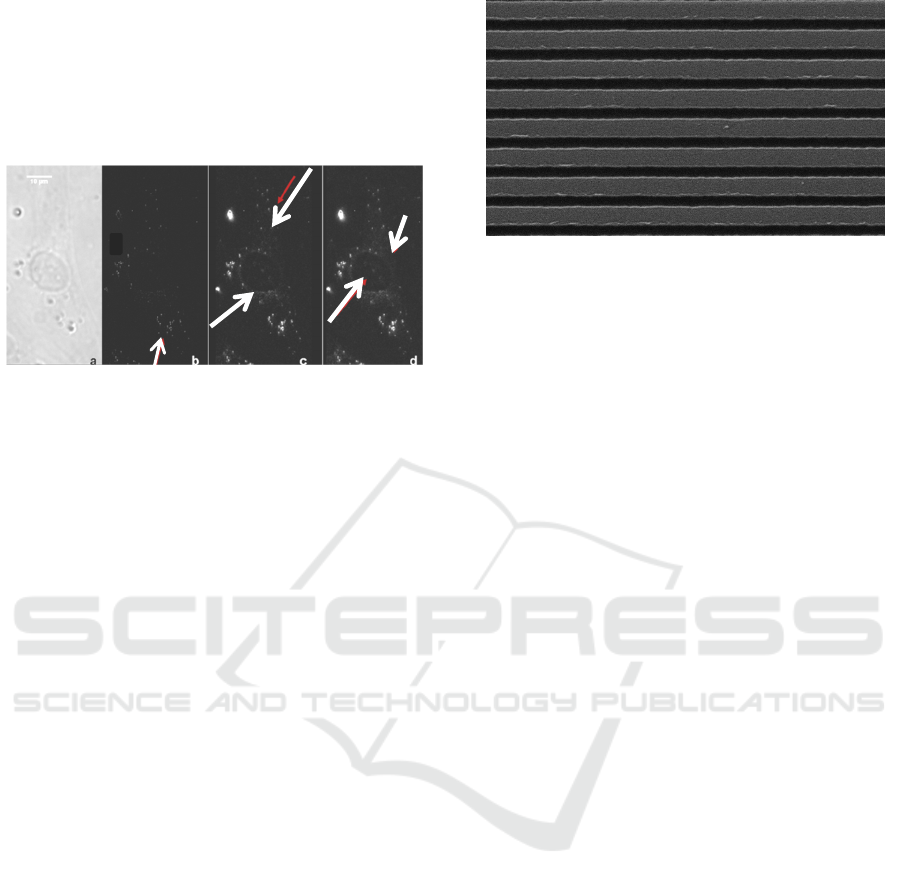
Figure 11: a) Bright field image of a single osteoblast and
b)-d) corresponding WEFS images with integration times
of 500 ms, 1000 ms and 1500 ms, respectively. The
arrows point to the features mentioned in the text: a)
adhesions, b) granularity and cell boundary, and c) nucleus
and cell boundary.
These few experiments show that not necessarily
fluorescence staining needs to be carried out for
imaging focal adhesions and hence getting some
cell-substratum interaction measures. As in WEFF
microscopy larger integration times lead to 3D
information of the cell.
Further detailed analysis, e.g. whether WEFS
data are comparable with flow cytometry (scattering
mode), need to be done.
9 MASS PRODUCIBLE
WAVEGUIDE CHIPS
In order to allow WEFF and WEFS microscopy to
be used by the interested communities, typically
biophysics, biology, biochemistry and medical
laboratories, the waveguide chips need to be
available and at a reasonable cost. Mass production
is the only way to achieve this. An all-polymer-
waveguide chip with an imprinted coupling grating
is one way to achieve this goal.
We have designed an all-polymer-waveguide
chip on the basis of a PMMA substrate. The
imprinting was performed into the PMMA with a
home-fabricated silicon stamp and in a subsequent
step a polystyrene waveguide was spin coated on
top.
Fig.11 shows SEM images of an imprinted
grating with a periodicity of 670 nm and a depth of
200 nm.
Figure 12: SEM image of a PMMA imprinted coupling
grating. The periodicity is 670 nm.
First experiments with the all-polymer chips
have produced promising WEFF imaging results.
However, still development towards mass produced
chips is necessary. The grating of Fig.11 was
fabricated by imprinting one grating into one
PMMA substrate. The imprinting and waveguide
spinning procedure needs to be scaled up to do 16,
25, 36 or even 49 chips in parallel on one substrate
with one imprinting procedure and a subsequent spin
coating process.
10 CONCLUSIONS
We demonstrated a simple, cost effective and safe
(sample safety) approach to perform TIRF and TIR
microscopy on an existing inverted microscope by
applying a slab waveguide as a sample substrate. No
expensive, extremely low loss waveguides were
needed. In contrary, the 3D scattering which is
always present in non-sophisticated waveguides
allowed to do epi-microscopy by simply enhancing
the integration time.
We applied WEFF and WEFS to a variety of
problems: from simple imaging of adhesions to
quantitative investigations like distance maps and
kinetic phenomena.
In order to spread the technology, the availability
of mass produced, inexpensive waveguide-chips is
necessary. The engineering towards this goal is on
its way.
Both WEFF and WEFS microscopy will allow
all kinds of interface and surface related imaging
and measurements. Both methods carry the
possibility to also be used in sensor technology.
Various options exist for using WEFF microscopy in
sensing. One can think to operate a WEFF
microscope with two simultaneously propagating
modes at different wavelength for any kind of pump
probe experiment. Or one can use a sensing scheme
PHOTOPTICS 2016 - 4th International Conference on Photonics, Optics and Laser Technology
212

involving a Förster transfer changing the
fluorescence yield upon binding of an analyte within
the evanescent field and therefore detecting an
image intensity change. WEFS microscopy is
sensitive to any changes in the size or the density
(refractive index) of the scattering entity.
Recognition reactions on a surface could easily be
detected by enhancing the scattering power by a
gold nanoparticle (Klein, 2008) or by increasing the
size of a scattering entity due to the binding.
Surface functionalization of the all-polymer-
waveguide chip is possible with silane chemistry as
–OH groups can easily be produced by oxygen
plasma or UV ozone treatment (Kandeepan et al.,
2015).
ACKNOWLEDGEMENTS
Many co-workers, students, PDFs and colleagues are
thanked for their contribution in the past, the present
and the future for developing and applying WEFF
and WEFS microscopy: Frank Thoma, John J.
Armitage, Huge Trembley, Michael Nietsche,
Abdollah Hassanzadeh, Rebbeca Stuchburry, Sabiha
Hacibekiroglu, Daniel Imruck, Christopher Halfpap,
Michael Morawitz, Qamrun Nahar, Darryl K.
Knight, Susanne Armstrong, Jeremia Shuster,
Frederik Fleisser, Mihaela Stefan, Rony Sharon,
Hong Hong Chen, Jeffrey S. Dixon, Stephen Sims,
Kibret Mequanint, Uwe Langbein, Beth Gillies,
Rene Harrison, Gordon Southam, Donglin Bai,
Doug Hamilton, Cheryle Seguin, and Elisabeth
Pruski.
REFERENCES
Abercrombie, Heaysman, J.E., and Pegrum, S.M., 1971,
Exp. Cell Res. 67, 359 – 367.
Agnarsson, B., Ingthorsson, S., Gudjonsson, T., and
Leosson, K., 2009, Optics Express 17, 5075-5082.
Atilgan, E., and Ovryn, B., 2009, Current Pharmaceutical
Biotechnology 10, 508 – 514.
Bauereiss, A., Welzel, O., Jung, Grosse-Holz, S. Lelental,
N., Lewczuk, P., Wenzel, E.M., Kornhuber, J. , and
Groemer, T. W., 2015, Traffic 16, 655-675.
Berney, M., Hammes, F., Bosshard, F., Weilenmann, H.-
U., and Egli, T., 2007, Applied and Environmental
Microbiology 73, 3283–3290.
Braun, B., and Fromherz, P., 1997, Applied Physics A-
Materials Science & Processing 65, 341 – 348.
Burmeister, J.S., Olivier, L.A., Reichert, W.M., and
Truskey, G.A., 1998, Biomaterials 19, 307 – 325.
Burmeister, J.S., Truskey, G.A., and Reichert, W.M.,
1994, Journal of Microscopy-Oxford 173, 39 – 51.
Burmeister, J.S., Truskey, G.A., Yarbough, J.L., and
Reichert, W.M., 1994, Biotechnological Progress 10,
26-31.
Byrne, G. D., Pitter, M.C., Zhang, J., Falcone, F.H.,
Stolnik, S., and Somekh, M.G., 2008, Journal of
Microscopy, 231, 168-179.
Chen, W.T., and Singer, S.J., 1982, Journal of Cell
Biology 95, 205 - 222.
Christianson, G.E., 2004, in Molecular Adhesion and Its
Applications, The Sticky Universe, ed. Kevin Kendal,
275-303.
Cooper,I.R., Meikle, S.T., Standen, G., Hanlon, G.W., and
Santin, M., 2009, J. Microbiol. Meth. 78, 40-44.
Csucs, G., and Ramsden, J.J., 1998, Biochimica et
Biophysica Acta 1369, 304–308.
Durbeej, B., and Eriksson, L.A., 2002, Journal of
Photochemistry and Photobiology A: Chemistry 152,
95–10.
Fleissner, F., Morawitz, M.,Dixon, S.J., Langbein, U., und
Mittler, S., 2015, Journal of Biophotonics 8, 826-837.
Giebel, K.F., Bechinger, C., Herminghaus, S., Riedel, M.,
Leiderer, P., Weiland, U., and Bastmeyer, M., 1999,
Biophysical Journal 76, 509 – 516.
Grandin, H.M., Städler, B., Textor, M., and Vörös, J.,
2006, Biosensensors and Bioelectronics 21, 1476-1482.
Halfpap, C., Morawitz, M., Peter, A., Detrez, N., Mittler,
S., and Langbein, U., 2012, DGaO Proceedings, 0287-
2012.
Hassanzadeh, A., Nitsche, M., Mittler, S., Armstrong,
S.,J., Dixon, J., and Langbein, U., (2008) Applied
Physics Letters 92, 233503.
Hassanzadeh, A., Armstrong, S., Dixon, S.J., and Mittler,
S., 2009, Applied Physics Letters 94, 033503.
Hassanzadeh, A., Nitsche, M., Armstrong, S., Nabavi, N.,
Harrison, R., Dixon, S.J., Langbein, U., and Mittler,
S., 2010, Biomedical Optics 15 036018-1 - 036018-7.
Hassanzadeh, A., and Mittler, S., 2011, Optical
Engineering 50, 071103.
Hassanzadeh, A., Kan Ma, H., Dixon, S.J., and Mittler, S.,
2012, Biomedical Optics 17, 076025 1-7.
Hedrick, R.P., Petri, B., McDowell, T.S., Mukkatira, K.,
and Sealey, L.J., 2007, Diseases of Aquatic Organisms
74, 113-118.
Helenius, A., and Simons, K., 1975, Biochimica et
Biophysica Acta 415, 29–79.
Hetrick, E.M., and Schoenfisch, M.H., 2006, Chem. Soc.
Rev. 35, 780-789.
Horvath, R., Pedersen, H.C., Skivesen, N., Selmeczi, D.,
and Larsen, N.B., 2005, Applied Physics Letters 86,
071101.
Kandeepan, S., Paquette, J.A., Gilroy, J.B., and Mittler, S.,
2015, CVD in press.
Klein, A., Diploma Thesis, RheinMain University,
Rüsseleheim, Germany, 2008.
Kuo, J., Asce, M., Chen, C.-L., and Nellor, M., 2003,
Journal of Environmental Engineering 129 774-779.
Lichtenberg, D., Robson, J., and Dennis, E.A., 1985,
Biochimica et Biophysics Acta 821 470-4778.
Waveguide Evanescent Field Microscopies for Application in Cell- and Bacteria- Biophysics
213

Liu, X., Welf, E.S., and Haugh, J.M., 2015, Journal of the
Royal Society, Interface / The Royal Society 12,
DOI:10.1098/rsif.2014.1412.
Madkour, A.E., and Tew, G.N., 2008, Polym. Intl. 57, 6.
Madkour, A.E., Dabkowski, J.M., Nusslein, K., and Tew,
G.N., 2009, Langmuir 25, 1060-1067.
Mazhorova, A., Markov, A., Ng, A., Chinnappan, R.,
Skorobogata, O., Zourob, M., and Skorobogatiy, M.,
20012, Opt. Express 20, 5344-5355.
Lanier, L.L., and Warner, N.L., 1981, Journal of
Immunological Methods 47, 25-30.
Nahar, Q., Fleissner, F., Shuster, J., Morawitz, M.,
Halfpap, C., Stefan, M., Southam, G., Langbein, U., and
Mittler, S., 2014, Journal of Biophotonics, 7, 542–551.
Niu, X.F., Wang, Y.L., Luo, Y.L., Xin, J., and Li, Y.G.
2005. Journal of Materials Science & Technology 21,
571- 576.
Ngassam, V.N., Howland, M.C., Sapuri-Butti, A., Rosidi,
N., Parikh, A.N., 2012., Soft Matter 8, 3734-3738.
Oliver, J.D., 2005, J. Microbiol. 43, 93-100.
Pera, N.P., Kouki, A., Haataja, S., Branderhorst, H.M.,
Liskamp, R.M.J., Visser, G.M., Finne, J., and Pieters,
R.J., 2010, Org. Biomol. Chem. 8, 2425-2429.
Pires, L., Sachsenheimer, K., Kleintschek, T., Waldbaur,
A., Schwartz,T., Rapp, B.E., 2013, Biosensors and
Biolectronics 47, 157-163.
Pizarro-Cerda, J., and Cossart, P., 2006, Cell 124, 715-
725.
Sapsford, K.E., and Shiver-Lake, L.C., 2008, in Zourob,
M., Elwary, S., and Turner, A.P.F. eds, Principles of
Bacterial Detection: Biosensors, Recognition
Receptors and Microsystems. Springer, 109-123.
Schmidt, M., Hourfar, M.K., Nicol, S.-B., Wahl, A.,
Heck, J., Weis, C., Tonn, T., Spengler, H.-P., Montag,
T., Seifried, E., Roth, W.K., 2006, Transfusion 46,
1367-1373.
Silvius, J.R., 1992, Annual Review of Biophysics and
Biomolecular Structure 21323-348.
Smith, L.V., Tamm, L.K., and Ford, R.M., 2002,
Langmuir 18, 5247-5255.
Smit, J.W., Meijer, C.J.L.M., Decay, F., and Feltkamp,
T.M., 1974, Journal of Immunological Methods 6, 93-
98.
Su, J.-W., Hsu, W.-C., Tjiu, J.-W., Chiang, C.-P., Huang,
C.-W., and Sunga, K.-B., 2014, Journal of Biomedical
Optics 19, 075007.
Stamm, W.E., 1978, Annals of International Medicine 89,
764-769.
Storrie, H., Guler, M.O., Abu-Amara, S.N., Volberg, T.,
Rao, M., Geiger, B., and Stupp, S.I., 2007,
Biomaterials 28, 4608 - 4618.
Taylor, A.D., Ladd, J., Homolas, J., and Jang, S., 2008, in
Zourob, M., Elwary, S., Turner, A., eds., Principles of
Bacterial Detection: Biosensors, Recognition
Receptors and Microsystems XXXII (Springer) 83-
108.
Tawil, N., Wilson, E., and Carbonetto, S., 1993, Journal of
Cell Biology 120, 261 – 271.
Thoma, F., Langbein, U., Mittler-Neher, S., 1997, Optics
Communications 134, 16-20 (1997).
Thoma, F., Armitage, J.J., Trembley, H., Menges, B.,
Langbein, U., and Mittler-Neher, S., 1998,
Proceedings of SPIE 3414, 242-249.
Vasilev, K., Cook, J., and Griesser, H.J., 2009, Expert
Rev. Med. Devices 6, 553-567.
Verschueren, H., 1984, J Cell Sci 75, 279 – 301.
Vigeant, M.A.S., Wagner, M., Tamm, L.K., and Ford,
R.M., 2001, Langmuir 17, 2235-2242.
Truskey, G.A., Burmeister, J.S. Grapa, E., Reichert,
W.M., 1992, Journal of Cell Science 103, 491-499.
Zourob, M., Mohr, S., Brown, B.J.T., Fielden, P.F.,
McDonnell, M.B., and Goddard, N.J., 2005,
Biosensors and Bioelectronics 21, 293-302.
PHOTOPTICS 2016 - 4th International Conference on Photonics, Optics and Laser Technology
214
