
Automated Breast Mass Segmentation using Pulse-Coupled Neural
Network and Distance Regularized Level Set Evolution: A
Coarse-to-fine Approach
Songlin Du, Yaping Yan and Yide Ma
School of Information Science and Engineering, Lanzhou University, Lanzhou, 730000, China
Keywords:
Breast Mass Segmentation, Pulse-Coupled Neural Network, Distance Regularized Level Set Evolution.
Abstract:
Motivation: Computer-aided diagnosis (CAD) is an important means for the clinical detection of breast cancer.
Mass is a common manifestation of breast cancer. This work aims to develop an effective breast mass segmen-
tation algorithm for CAD systems. Method: On one hand, pulse-coupled neural network (PCNN) and level set
(LS) method have complementary advantages in image segmentation, we therefore combine PCNN and LS.
On the other hand, traditional LS method formulates the evolution of the contour through the evolution of a
level set function (LSF), and LSF typically develops irregularities during its evolution, which may cause nu-
merical errors and eventually destroy the stability of the evolution. So we use an improved LS model, named
distance regularized level set evolution (DRLSE), to achieve desirable segmentation performance. Specifi-
cally, we extract the region of interest (ROI) with PCNN and sets initial contour for DRLSE first. Then the
finely segmentation is achieved by DRLSE. Results: Both qualitative and quantitative experiments on three
large-scale mammography databases prove that the proposed method achieves high segmentation accuracy.
Conclusion: The proposed algorithm is effective for automatic breast mass segmentation. Significance: First,
the sketchy position of mass is fixed by PCNN, which guides the algorithm to define a flexibly initial contour
for DRLSE. This strategy makes it easier for the contour to move from initial position towards the bound-
ary between mass and normal tissue. Second, the use of DRLSE, which introduces an intrinsic capability of
maintaining regularity of the LSF, ensures stable LS evolution and achieves accurate segmentation.
1 INTRODUCTION
1.1 Background and Motivation
Breast cancer is one of the most common cancers
among women, and the key action to reduce the death
rate due to breast cancer is early detection (Liang
et al., 2012). Mammography screening, which is a
specific technique of imaging that uses a low-dose
X-ray system and high-contrast, high-resolution film
for breast examination, can depict most of the sig-
nificant abnormal tissues in breast. Computer-aided
diagnosis (CAD) techniques in mammography serve
as a second opinion for radiologists by identifying
regions with high suspicion of malignancy (Astley,
2004). Breast mass is a common manifestation of
breast cancer that continues to challenge both radi-
ologists and CAD systems (Eltonsy et al., 2007; Guo
et al., 2015). However, accurate detection of breast
mass is challenging for its complex topological struc-
tures and heterogeneous intensity distributions (Cui
et al., 2009). The task of breast mass detection is
essentially a problem of image segmentation. Im-
age segmentation studies how to partition an image
into several meaningful parts, often consisting of ob-
jects and backgrounds (Zhang and Ji, 2011; Du et al.,
2014). As an important technique in many computer
vision related applications, it is of general interest
to design robust and fast segmentation algorithms.
However, it is widely accepted that there is no gen-
eral method for solving all segmentation problems.
On the contrary, to achieve satisfactory performances,
algorithms should be highly adapted to their corre-
sponding applications. In recent years, plenty of im-
age segmentation algorithms which were developed
in the field of computer vision have been introduced
to the detection and the segmentation of breast le-
sions. For example, Z. Wang et al. (Wang et al.,
2014) proposed to combine wavelet modulus max-
ima transform, morphological operation, and region
grow for breast tumor edge segmentation. L. Moraru
et al. (Moraru et al., 2014) transferred the problem
Du, S., Yan, Y. and Ma, Y.
Automated Breast Mass Segmentation using Pulse-Coupled Neural Network and Distance Regularized Level Set Evolution: A Coarse-to-fine Approach.
DOI: 10.5220/0005621300170024
In Proceedings of the 9th International Joint Conference on Biomedical Engineering Systems and Technologies (BIOSTEC 2016) - Volume 2: BIOIMAGING, pages 17-24
ISBN: 978-989-758-170-0
Copyright
c
2016 by SCITEPRESS – Science and Technology Publications, Lda. All rights reserved
17
of breast lesion segmentation into extracting texture
features. R. Rouhi et al. (Rouhi et al., 2015) em-
ployed region growing and cellular neural network
(CNN) segmentation for benign and malignant breast
tumors classification. W. Xie et al. (Xie et al., 2016)
employed level set and extreme learning machine for
breast mass classification. In this paper, we studied
the problem of partitioning breast mass in mammog-
raphy, and proposed a coarse-to-fine method which
combines pulse-coupled neural network (PCNN) and
distance regularized level set evolution (DRLSE).
1.2 Our Contribution
The PCNN, which has fundamental advantages in im-
age processing because of its biological background,
was constructed by R. Eckhorn et al. (Eckhorn et al.,
1989; Eckhorn et al., 1990) to simulate the syn-
chronous pulse bursts in cat visual cortex. Thus far, a
large plenty of literatures aiming at the applications of
PCNN have been published, such as image segmen-
tation (Kuntimad and Ranganath, 1999), image fu-
sion (Li et al., 2006), and edge detection (Zhou et al.,
2008). However, the strength of PCNN lies in finding
sketchy positions of homogeneous regions in natural
images, and it is hard for PCNN to position bound-
aries between different regions precisely. On the con-
trary, by minimizing an energy functional, the level
set (LS) method, which was proposed by S. Osher
and J. A. Sethian (Osher and Sethian, 1988), is able
to achieve accurate detection of the edges of homo-
geneous regions on condition that the sketchy posi-
tions of the homogeneous regions are known. There-
fore, we deem that PCNN and LS have complemen-
tary advantages in image segmentation. In our pre-
vious work, W. Xie et al. (Xie et al., 2015) pro-
pose to combine PCNN and traditional LS to achieve
breast mass segmentation. However, traditional LS
methods represent a contour or interface as the zero
level set of a level set function (LSF), and formu-
late the evolution of the contour through the evolu-
tion of the LSF, which typically develops irregulari-
ties during its evolution, may cause numerical errors
and eventually destroy the stability of the evolution
(Li et al., 2010). We therefore use the DRLSE (Li
et al., 2010), which is an improved LS model, instead
of using traditional LS methods. Specifically, the pro-
posed strategy employs PCNN to fix the sketchy po-
sition of mass by coarsely segmentation. After that,
based on the coarsely segmentation result of PCNN,
some basic geometric methods are used to set initial
contour for DRLSE automatically. At last, the task
of finely segmentation is carried out by DRLSE. Ex-
perimental results on three mammography databases
tell that the segmentation results are very close to the
ground-truth, which prove the accuracy of the pro-
posed method.
2 RELATED WORKS
The definitions and principles of PCNN and DRLSE
are successively reviewed and analyzed in the re-
minder of this section.
2.1 Pulse-Coupled Neural Network
As mentioned above, PCNN was proposed to sim-
ulate synchronous pulse bursts in cat visual cortex.
Therefore, compared with traditional artificial neural
networks, the bio-inspired neuron model of PCNN is
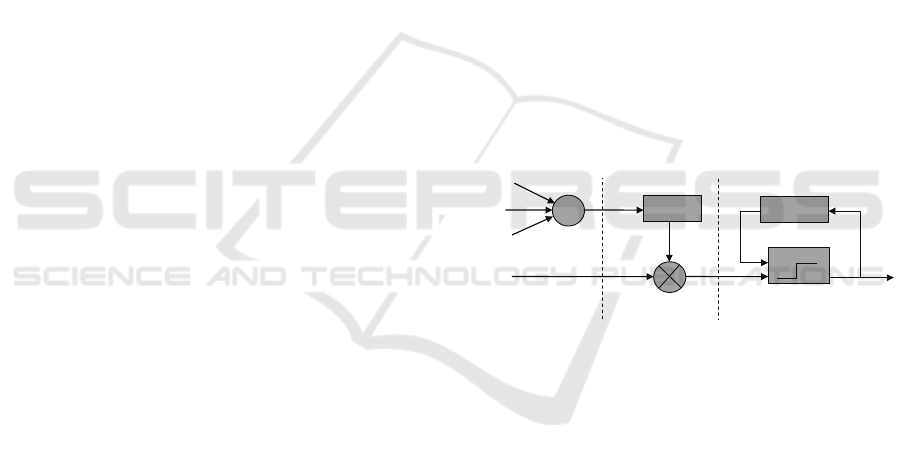
more sophisticated. As illustrated in Figure 1, neu-
ron model of PCNN consists of three parts, i.e., in-
put part, linking part, and pulse generator part (Wang
et al., 2010). The neuron receives information from
input signal and neighborhood neurons through input
part, these two kinds of information are linked by the
linking part, then the pulse generator part generates
pulses as outputs of the neuron.
W
1+
h
L
Threshold
Y
k,l
F
i,j
L
i,j
U
i,j
T
i,j
Y
i,j
Input Part
Linking Part
Pulse Generator
0
1
Figure 1: Neuron model of PCNN.
In image processing, pixels of the input image
should be mapped into neurons in PCNN. The neuron
model which is presented in Figure 1 can be quantita-
tively described as iteration by (Eckhorn et al., 1989;
Eckhorn et al., 1990; Wang et al., 2010)
F
i, j
[n] =e
−α
F
F
i, j
[n− 1]
+V
F
∑
k,l
w
i, j,k,l
Y
k,l
[n− 1]+ S
i, j
,
(1)
L
i, j
[n] =e
−α
L
L
i, j
[n− 1]
+V
L
∑
k,l
m
i, j,k,l
Y
k,l
[n− 1],
(2)
U
i, j
[n] = F
i, j
[n](1+ βL
i, j
[n]), (3)
T
i, j
[n] = e
−α
T
T
i, j
[n− 1] +V
T
Y
i, j
[n], (4)
Y
i, j
[n] =
1,
0,
U
i, j
[n] > T
i, j
[n]
otherwise
, (5)
where (i, j) is the coordinates of the pixel which is
corresponding to the current neuron. n denotes itera-
tion steps. S
i, j
is the input signal, i.e., gray-level value
BIOIMAGING 2016 - 3rd International Conference on Bioimaging
18
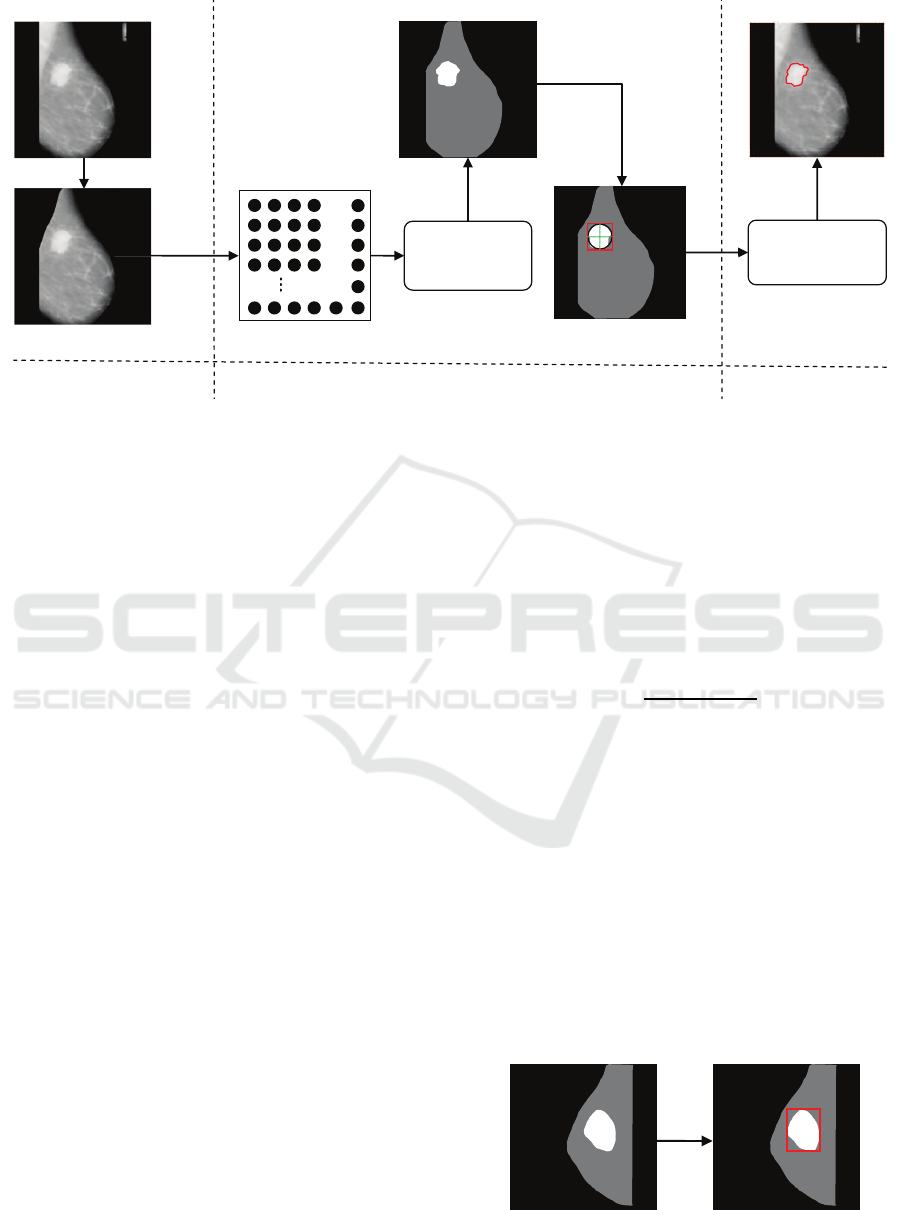
Ă
Original mammography
Neuron map
Neurons of PCNN
fire by iteration
Preprocessing
Setting initial contour for DRLSE
Finely segmentation
using DRLSE
Segmentation result
Step 2: Coarsely segmentation and setting
initial contour for DRLSE
Step 3: Finely segmentation
Binary image
Mapping
Step 1: Preprocessing
Figure 2: A graphical illustration of the proposed method.
of the current pixel. F
i, j
and L
i, j
are feedback input
and linking input of the current neuron. w
i, j,k,l
and
m
i, j,k,l
are constant synaptic weight matrices for feed-
ing and linking inputs, respectively, which depends on
the distance between the current neuron (i, j) and its
neighbourhood neuron (k, l). F
i, j
and L
i, j
are mod-
ulated through a linking strength β. U
i, j
, which is
named as internal activity, is the modulating result of
F
i, j
and L
i, j
. T
i, j
is a dynamic threshold which decays
by coefficients α
T
while the current neuron is not yet
fired. The neuron generates a pulse toY
i, j
while the in-
ternal activity U
i, j
is greater than the dynamic thresh-
old T
i, j
, otherwise, it remains quiet. In other words,
Y
i, j
is the output of the current neuron. V
F
, V
L
, and
V
T
are initial amplitudes of F
i, j
, L
i, j
, and T
i, j
, respec-
tively. α
F
and α
L
are decaying coefficients of F
i, j
and
L
i, j
, respectively.
2.2 Distance Regularized Level Set
Evolution
As mentioned above, the LS method represents a con-
tour or interface as the zero level set of a LSF, and
formulates the evolution of the contour through the
evolution of the LSF (Estellers et al., 2012). How-
ever, traditional LSF typically develops irregularities
during its evolution, which may cause numerical er-
rors and eventually destroy the stability of the evolu-
tion (Li et al., 2010). To solve this problem, C. Li et
al. (Li et al., 2010) constructed a new type of LS evo-
lution, which ia abbreviated DRLSE, by defining an
energy functional ε(φ) by (Li et al., 2010)
ε(φ) = µR
p
(φ) + ε
ext
(φ), (6)
where µ is a positive constant, ε
ext
(φ) is an external
energy term, and R
p
(φ) is the level set regularization
term defined by (Li et al., 2010)
R
p
(φ)
∆
=
Z
Ω
p(|∇φ|)dx, (7)
where p is an energy density function p : [ 0, ∞) → R.
In image segmentation applications, an edge indi-
cator function g can be defined by (Li et al., 2010)
g ,
1
1+ |∇G
σ
∗ I|
2
, (8)
where G
σ
is a Gaussian kernel with a standard devi-
ation σ. For a LSF φ : Ω → R, the line integral of
the function g along the zero level contour of φ can be
calculated with the Dirac delta function δ as
L
g
(φ) ,
Z
Ω
gδ(φ)|∇φ|dx, (9)
and a weighted area of the region Ω
−
φ
,
{x : φ(x) < 0} can be calculated with the Heav-
iside function H as (Li et al., 2010)
A
g
(φ) ,
Z
Ω
gH (−φ)dx. (10)
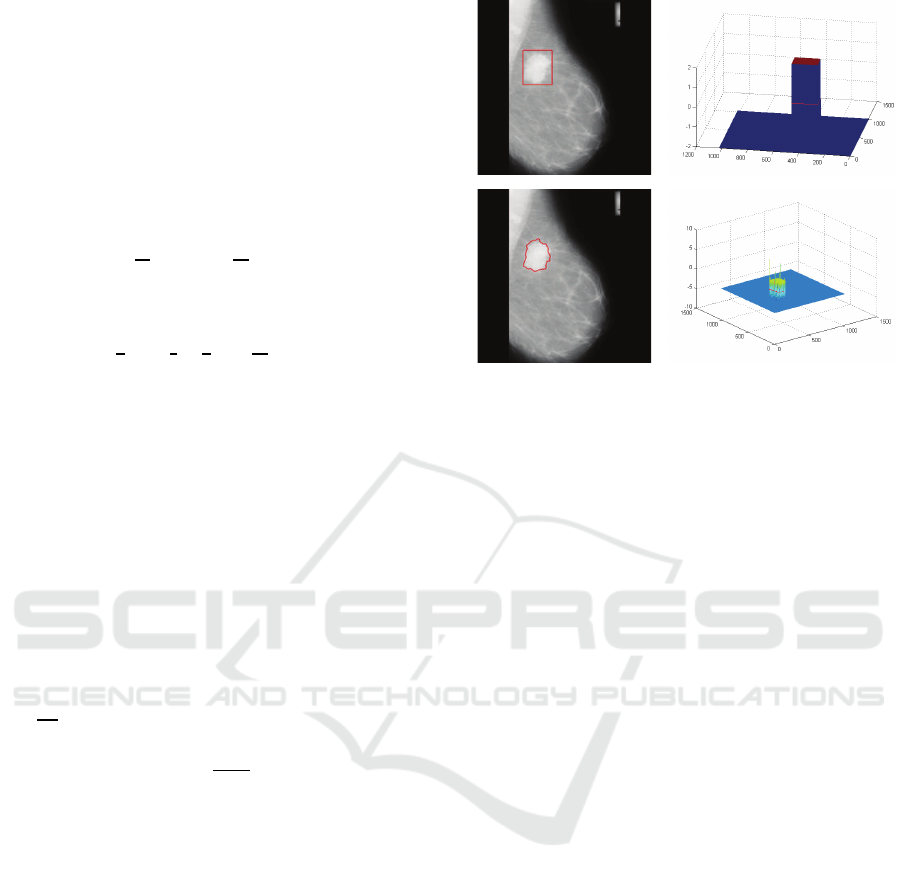
Figure 3: Schematic diagram of defining initial contour for
DRLSE.
Automated Breast Mass Segmentation using Pulse-Coupled Neural Network and Distance Regularized Level Set Evolution: A
Coarse-to-fine Approach
19
Then the energy functional ε(φ), i.e., (6), can be
achieved by (Li et al., 2010)
ε(φ) = µR
p
(φ) + λL
g
(φ) + αA
g
(φ), (11)
where λ and α, which are subject to λ > 0 and α ∈ R ,
are the coefficients of the energy functionals L
g
(φ)
and A
g
(φ), respectively. In practice, the Dirac delta
function δ and the Heaviside function H can be ap-
proximated by smooth functions δ
ε
and the Heaviside
function H
ε
, which are defined by (Li et al., 2010)
δ
ε
(x) =
1
2ε
1+ cos
πx
ε
, |x| ≤ ε
0, |x| > ε
(12)
and
H
ε
(x) =
1
2
1+
x
ε
+
1
π
sin
πx
ε
, |x| ≤ ε
1, |x| > ε
0, |x| < −ε
, (13)
respectively. By replacing δ and H with (12) and
(13) respectively, we can achieve the energy func-
tional ε(φ) by (Li et al., 2010)
ε
ε
(φ) =µ
Z
Ω
p(|∇φ|)dx+ λ
Z
Ω
gδ(φ)|∇φ|dx
+ α
Z
Ω
gH (−φ)dx.
(14)
Given an initial LSF φ(x, 0) = φ
0
(x), the approxi-
mated energy functional (14) can be minimized by
solving (Li et al., 2010)
∂φ
∂t
=µdiv(d
p
(|∇φ|)|∇φ|)
+ λδ
ε
(φ)div
g
∇φ
|∇φ|
+ αgδ
ε
(φ).
(15)
3 THE PROPOSED BREAST
MASS SEGMENTATION
METHOD
The framework of the proposed method, which con-
sists of three steps, is graphically illustrated in Fig-
ure 2. The first step is pre-processing, which re-
moves tags, camera windows, and pectoral muscles
from the original mammography. The second step
conducts coarsely segmentation and sets initial con-
tour for DRLSE. The last step achieves finely seg-
mentation by using DRLSE. From another angle, the
procedure of coarsely segmentation can be regarded
as extracting the region of interest (ROI) from mam-
mography. Since our method firstly extracts ROI with
PCNN and then performs finely segmentation with
DRLSE, we define it as a ‘coarse-to-fine’ strategy.
(a) (b)
(c) (d)
Figure 4: Visualization of the LSFs before and after evolu-
tion. (a) Initial contour. (b) Initial LSF. (c) Final contour.
(d) Final LSF.
3.1 Coarsely Segmentation with PCNN
In the field of CAD, a ROI usually denotes a region
which provides the rough location of a lesion and ex-
cludes normal tissues as much as possible (Xian et al.,
2015). In this work, the ROI of each mammography
is extracted by using PCNN to conduct coarsely seg-
mentation. As illustrated in Figure 2, each pixel of the
digitized mammography is corresponded to a neuron
in the PCNN, and the gray-level values of the pix-
els are regarded as the inputs of the corresponding
neurons, i.e., S
i, j
= G
i, j
, where G
i, j
denotes the gray-
level value of the pixel (i, j) in original mammogra-
phy. Then we initialize the PCNN by setting initial
values to its parameters. This work uses an adaptive
method, which was proposed in our previous work
(Chen et al., 2011), to initialize the parameters for
PCNN. After initialization, the neurons of PCNN are
able to fire by iteration following (1)-(5). As a basic
strength, PCNN is able to cause the adjacent neurons
with similar inputs to pulse synchronously, resulting
in great potential in image segmentation. Since we
have corresponded pixels to PCNN neurons without
changing their original locations, adjacent pixels with
similar gray-level can be easily partitioned from the
whole image by the procedure of synchronously fir-
ing. At the last iteration of PCNN, we should obtain a
binary image. Each pixel of the binary image records
whether its corresponding neuron has fired. The bi-
nary image is the result of the coarsely segmentation,
i.e., ROI.
BIOIMAGING 2016 - 3rd International Conference on Bioimaging
20
3.2 Defining Initial Contour for DRLSE
In this step, we use some simple yet effective geomet-
ric methods to define initial contour for DRLSE. As
illustrated in Figure 3, the largest rectangle which is
tangent to the foreground of the binary image is de-
fined as the initial contour for DRLSE. Specifically,
the foreground of the binary image denotes the largest
close region in the image.
3.3 Finely Segmentation with DRLSE
Based on the results of preprocessing and coarsely
segmentation (i.e., extraction of ROI), finely segmen-
tation is achieved by DRLSE. To help the readers un-
derstand the process of evolution, Figure 4 visualizes
the LSFs before and after evolution. Let’s denote by
φ
k
i, j
the LSF with spatial index (i, j) and temporal in-
dex k. The LS evolution equation can be formulated
by an iteration process as (Li et al., 2010)
φ
k+1
i, j
= φ
k
i, j
+ ∆tL
φ
k
i, j
, k = 0, 1, 2, ··· , (16)
where L
φ
k
i, j
denotes the approximation of the right
hand side in the evolution equations, and is defined by
L
φ
k
i, j
=
φ
k+1
i, j
− φ
k
i, j
∆t
. (17)
In our implementation, the time-step ∆t is fixed
as ∆t = 5, and the parameters in the DRLSE model,
i.e., equation (15), are set as µ = 0.04 and λ = 5, re-
spectively. The value of α can be flexibly adjusted
according to the contrast of the mammography.
4 EXPERIMENTAL RESULTS
4.1 Database and Settings
To provide a full spectrum of possible cases, the
mammographies used in this work are taken from the
Mammographic Image Analysis Society (MIAS) dig-
ital mammography database (Suckling et al., 1994),
the digital database for screening mammography
(DDSM) (Heath et al., 1998; Heath et al., 2001), and
the mammography database of the Japanese Society
of Medical Imaging Technology (JAMIT). The infor-
mation of the three databases are summarized in Table
1.
As can be seen from Table 1, the patients of the
three databases are from three different continents:
Europe, America, and Asia, respectively. The MIAS
Table 1: Overview of the mammography databases.
Database Provider Continent
MIAS Pilot European Image Processing Archive Europe
DDSM
Department of Computer Science and
Engineering, University of South Florida
America
JAMIT
Japanese Society of Medical Imaging
Technology
Asia
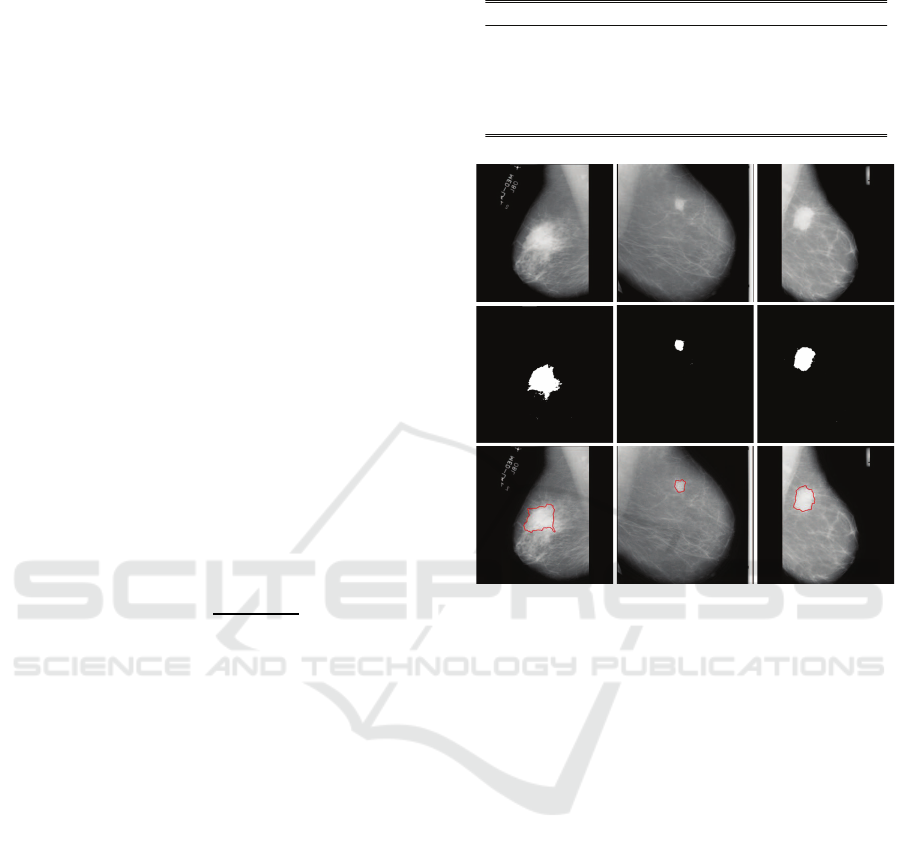
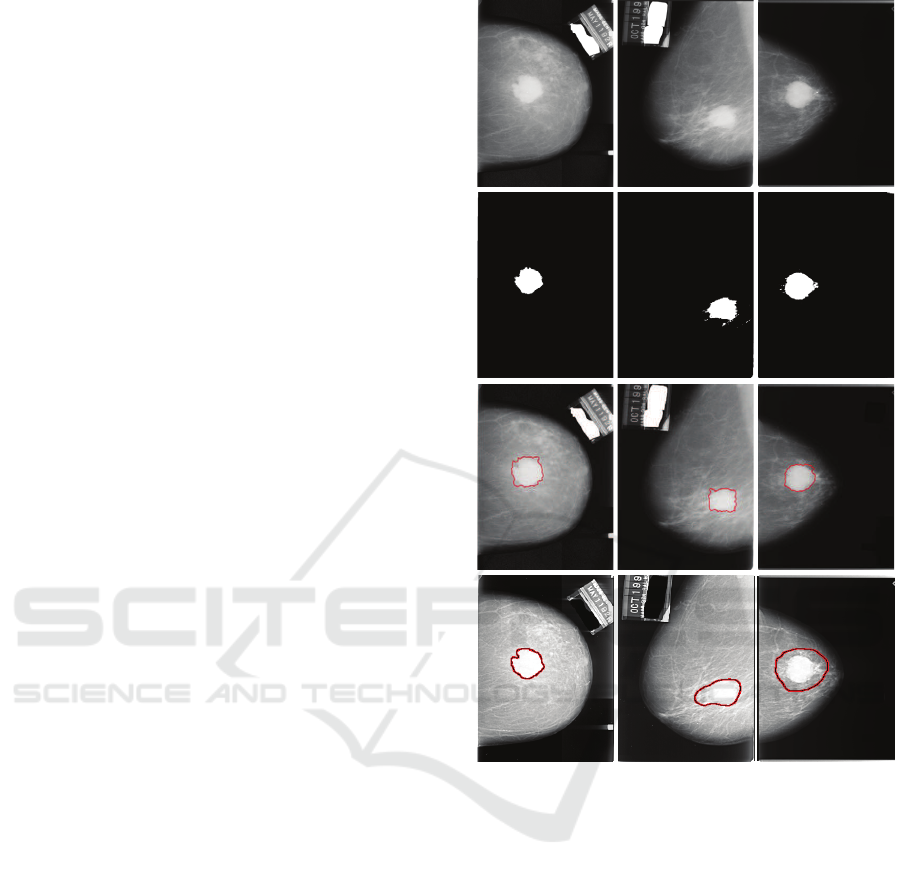
Figure 5: Typical segmentation results on MIAS database
(corresponding patients are from Europe). In each column,
from top to bottom: Original mammography, coarsely seg-
mentation result from PCNN, and finely segmentation result
from DRLSE.
digital mammography database contains 322 mam-
mography screening exams which have been digi-
tized to 50 micron per pixel with a linear optical den-
sity in the range 0-3.2, and each pixel is represented
with an 8-bit word. The resolution of the images
in MIAS database is 1024×1024 pixels. The im-
ages were annotated according to their correspond-
ing types of abnormality by expert radiologists, us-
ing seven distinct classes: Calcification (23 images),
well-defined/circumscribed mass (23 images), specu-
lated mass (19 images), ill-defined mass (14 images),
architectural distortion (19 images), asymmetry (15
images), and normal (209 images). The DDSM
database contains 2620, four view, mammography
screening exams. The mammography screening ex-
ams in DDSM database were digitized by one of four
different scanners: DBA M2100 ImageClear (42 mi-
cron per pixel, 16 bit depth), HOWTEK 960 (43.5
micron per pixel, 12 bit depth), Lumisys 200 laser
densitometer (50 micron per pixel, 12 bit depth), and
HOWTEK MultiRAD 850 (43.5 micron per pixel, 12
bit depth) (Chen et al., 2015). The size of the images
Automated Breast Mass Segmentation using Pulse-Coupled Neural Network and Distance Regularized Level Set Evolution: A
Coarse-to-fine Approach
21
in DDSM database varies, and the pathology types
were annotated by expert radiologists as normal, can-
cer, benign, and benign without callback. The JAMIT
mammography database contains 40 mammography
screening exams which have been classified into three
categories: normal (17 images), calcification (11 im-
ages), and tumor (12 images). Each of the mammog-
raphy screening exams in the JAMIT mammography
database was digitized to 2510×2000 pixels, and the
bit-depth of each pixel is 10 (Arai et al., 2012). In this
work, since the proposed approach focus on breast
mass segmentation, only mammographies that con-
tain a mass might be used for experiments. To bring
the mammographies in DDSM and JAMIT databases
into correspondence with those in MIAS database,
they are resized to 1024×1024 pixels before segmen-
tation. Following experiments are implemented by
programming with the Mathworks Matlab 2010b on
a PC with Intel Core-i5 processer and 4 GB RAM.
4.2 Experimental Results
Both subjective and objective evaluations on the per-
formance of the proposed method are presented in this
subsection. For European patients, Figure 5 presents
several typical segmentation results of the proposed
method on MIAS digital mammographydatabase. By
comparing the first row and the second row of Figure
5, we can see that the masses in the original mam-
mographies are accurately positioned, and the rough
shapes of the masses are also accurately contoured by
PCNN. Besides, by examining the last row of Figure
5, we can find that the boundaries between masses
and backgrounds are precisely positioned by DRLSE.
For American and Asian patients, Figure 6 and Figure
7 present the typical segmentation results of the pro-
posed method on DDSM and JAMIT mammography
databases, respectively. The same conclusion can be
drawn from Figure 6 and Figure 7. This is due to that
the initial contour of DRLSE is adaptively defined in
a mammography-specificway and DRLSE can ensure
stable LS evolution.
The quantitative segmentation results of the pro-
posed method and the ground-truth are listed in Table
2. In MIAS database, four mammographies, which
contain circumscribed mass, asymmetry, ill-defined
mass, and spiculated mass, respectively, were tested.
In DDSM database, four mammographies, which
contain masses with irregular shape, lobulated shape,
and oval shape, were tested. In JAMIT database,
four mammographies which contain tumors were also
tested. The coarse and fine regions in Table 2 de-
note the coarsely and finely segmentation results of
the proposed method, respectively. For each mam-
Figure 6: Typical segmentation results on DDSM database
(corresponding patients are from America). In each col-
umn, from top to bottom: Original mammography, coarsely
segmentation result from PCNN, finely segmentation re-
sult from DRLSE, and expert diagnosis (Heath et al., 1998;
Heath et al., 2001).
mography, the MIAS mammography database pro-
vides us the coordinates of the centre of the abnor-
mality and the approximate radius of a circle enclos-
ing the abnormality. So the ground-truth regions of
abnormalities in MIAS mammography database can
be calculated with the coordinates and the radius.
For DDSM mammography database, only thumbnail
images which contain suspicious regions are avail-
able. So the ground-truth regions of abnormalities
in DDSM mammography database can be approxi-
mately positioned with the thumbnail images. The
fourth column of Table 2 lists the ground-truth, and
the last two columns list the experimental results of
the proposed algorithm. Comparing our results with
ground-truth, we can find that, for every types of ab-
BIOIMAGING 2016 - 3rd International Conference on Bioimaging
22
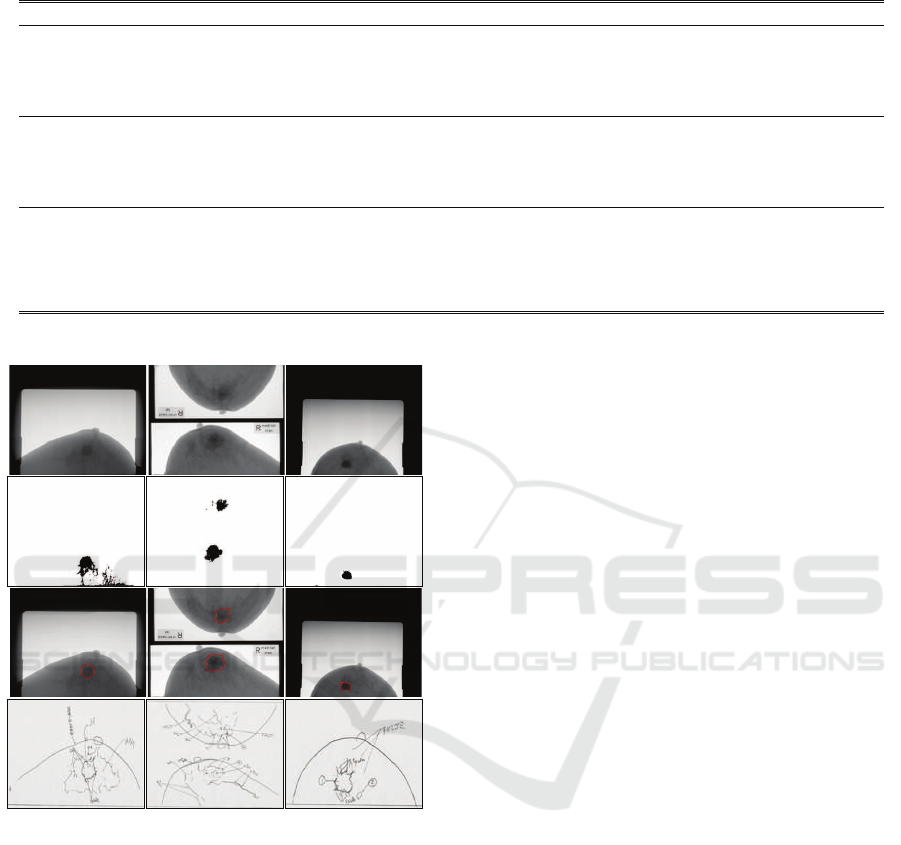
Table 2: Performance of the proposed method.
Database Mammography Abnormality Ground-Truth Region Coarse Region Fine Region
MIAS
mdb021 circumscribed mass
(444:542, 850:948) (480:525, 880:915) (428:580, 844:943)
mdb081 asymmetry (361:623, 420:682) (420:560, 500:625) (352:587, 426:635)
mdb134 ill-defined mass (420:518, 247:345) (450:490, 273:328) (433:516, 247:341)
mdb202 spiculated mass (520:594, 215:289) (535:580, 235:275) (510:596, 240:290)
DDSM
A_1004_1.RIGHT_CC mass: irregular shape (254:503, 399:566) (278:495, 411:559) (255: 492, 399:567)
A_1006_1.LEFT_MLO mass: irregular shape (577:916, 566:713) (657:901, 580:715) (681:891, 575:705)
C_0011_1.RIGHT_CC mass: lobulated shape (661:977, 565:745) (711:878, 618:706) (703:912, 567:719)
C_0088_1.LEFT_CC mass: oval shape (128:515, 401:631) (156:461, 438:592) (199:432, 438:591)
JAMIT
T1 tumor / (517:676, 740:939) (535:636, 711:845)
T3 tumor / (412:490, 874:956) (414:492, 882:966)
T5 tumor / (528:596, 857:950) (531:596, 868:935)
T7 tumor /
(508:609, 206:326)
(429:565, 865:794)
(507:616, 185:328)
(442:578, 629:783)
Noting that the positions of the mass regions were fixed after resizing.
Figure 7: Typical segmentation results on JAMIT database
(corresponding patients are from Asia). In each column,
from top to bottom: Original mammography, coarsely seg-
mentation result from PCNN, finely segmentation result
from DRLSE, and expert diagnosis.
normalities, almost all of our results are inside the
corresponding regions of ground-truth. This suggests
that the proposed method encloses little normal tis-
sues, proving the accuracy of our method.
5 CONCLUSION
We have presented a coarse-to-fine method for auto-
matic breast mass segmentation in this paper. Specif-
ically, PCNN is employed to fix the sketchy position
of mass and extract ROI in the first step. The initial
contour of DRLSE is then adaptively defined accord-
ing to the position and the shape of the ROI. Finally,
the precise boundary between mass and background
is positioned with DRLSE. This is a novel and effec-
tive approach to partition mass in mammography for
following reasons. First, ROI is extracted by PCNN
in advance, which brings about a flexible and auto-
matic definition of initial contour for DRLSE. Sec-
ond, the DRLSE, which can ensure accurate compu-
tation and stable LS evolution, is firstly employed for
the purpose of breast mass segmentation. Both sub-
jective and objective experiments on three large-scale
mammography databases prove that the ROI can be
accurately fixed by PCNN, and the boundary between
mass and normal tissue can be precisely positioned
by DRLSE. In summary, the proposed method shows
expectant segmentation performance.
On the other hand, considering its efficiency and
accuracy, we expect that, in the future, the proposed
breast mass segmentation algorithm will find its util-
ity in more applications of medical image segmenta-
tion, such as vessel segmentation in fundus images
and heart chamber segmentation in computed tomog-
raphy (CT) images.
ACKNOWLEDGEMENTS
The authors would like to thank Dr. Chunming Li for
shearing the source code of distance regularized level
set evolution, and the members of the Institute of Cir-
cuits and Systems, School of Information Science and
Engineering, Lanzhou University, for fruitful discus-
sions and valuable advices. This work was supported
by the National Natural Science Foundation of China
(NSFC) under Grant 61175012, the Specialized Re-
Automated Breast Mass Segmentation using Pulse-Coupled Neural Network and Distance Regularized Level Set Evolution: A
Coarse-to-fine Approach
23

search Fund for the Doctoral Program of Higher Ed-
ucation of China under Grant 20110211110026, and
the Fundamental Research Funds for the Central Uni-
versities of China under Grant lzujbky-2015-196.
REFERENCES
Arai, K., Abdullah, I. N., and Okumura, H. (2012). Auto-
mated detection method for clustered microcalcifica-
tion in mammogram image based on statistical textu-
ral features. Int. J. Adv. Comput. Sci. Appl., 3(5):12–
16.
Astley, S. M. (2004). Computer-based detection and
prompting of mammographic abnormalities. Br. J. Ra-
diol., 45:S194–S200.
Chen, Y., Park, S. K., Ma, Y., and Ala, R. (2011). A new au-
tomatic parameter setting method of a simplified pcnn
for image segmentation. IEEE Trans. Neural Netw.,
22(6):880–892.
Chen, Z., Strange, H., Oliver, A., Denton, E. R. E., Boggis,
C., and Zwiggelaar, R. (2015). Topological modeling
and classification of mammographic microcalcifica-
tion clusters. IEEE Trans. Biomed. Eng., 62(4):1203–
1214.
Cui, Y., Tan, Y., Zhao, B., Liberman, L., Parbhu,
R., Kaplan, J., Theodoulou, M., Hudis, C., and
Schwartz, L. H. (2009). Malignant lesion segmen-
tation in contrast-enhanced breast mr images based
on the marker-controlled watershed. Med. Phys.,
36(10):4359–4369.
Du, S., Wu, G., Ma, L., and Ma, Y. (2014). Maximum quan-
tum entropy based optimal threshold selecting crite-
rion for thresholding image segmentation. J. Comput.
Inf. Syst., 10(8):3359–3366.
Eckhorn, R., Reitboeck, H. J., Arndt, M., and Dicke, P.
(1989). Feature linking via stimulus-evoked oscil-
lations: experimental results from cat visual cortex
and functional implications from a network model. In
Proc. of the Int. Joint Conf. on Neural Networks, pages
723–730.
Eckhorn, R., Reitboeck, H. J., Arndt, M., and Dicke, P.
(1990). Feature linking via synchronization among
distributed assemblies: Simulations of results from cat
visual cortex. Neural Comput., 2(3):293–307.
Eltonsy, N. H., Tourassi, G. D., and Elmaghraby, A. S.
(2007). A concentric morphology model for the detec-
tion of masses in mammography. IEEE Trans. Med.
Imaging, 26(6):880–889.
Estellers, V., Zosso, D., Lai, R., Osher, S., Thiran, J.-P.,
and Bresson, X. (2012). Efficient algorithm for level
set method preserving distance function. IEEE Trans.
Image Process, 21(12):4722–4734.
Guo, M., Dong, M., Wang, Z., Ma, Y., Guo, Y. (2015).
A new method for mammographic mass segmentation
based on parametric active contour model. In Proc. of
the Int. Conf. on Wavelet Analysis and Pattern Recog-
nition, pages 27–33.
Heath, M., Bowyer, K., Kopans, D., Kegelmeyer, W. P.,
Moore, R., Chang, K., and MunishKumaran, S.
(1998). Current status of the digital database for
screening mammography. In Proc. of the Int. Work-
shop on Digital Mammography, pages 457–460.
Heath, M., Bowyer, K., Kopans, D., Moore, R., and
Kegelmeyer, W. P. (2001). The digital database for
screening mammography. In Proc. of the Int. Work-
shop on Digital Mammography, pages 212–218.
Kuntimad, G. and Ranganath, H. S. (1999). Perfect image
segmentation using pulse coupled neural networks.
IEEE Trans. Neural Netw., 10(3):591–598.
Li, C., Xu, C., Gui, C., and Fox, M. D. (2010). Distance
regularized level set evolution and its application to
image segmentation. IEEE Trans. Image Process.,
19(12):3243–3254.
Li, M., Cai, W., and Tan, Z. (2006). A region-based multi-
sensor image fusion scheme using pulse-coupled neu-
ral network. Pattern Recogn. Lett., 27(16):1948–1956.
Liang, X., Ramamohanarao, K., Frazer, H., and Yang, Q.
(2012). Lesion segmentation in dynamic contrast en-
hanced mri of breast. In Proc. of the Int. Conf. on Dig-
ital Image Computing Techniques and Applications,
pages 1–8.
Moraru, L., Moldovanu, S., and Biswas, A. (2014). Opti-
mization of breast lesion segmentation in texture fea-
ture space approach. Med. Eng. Phys., 36(1):129–135.
Osher, S. and Sethian, J. A. (1988). Fronts propagating
with curvature-dependent speed: Algorithms based
on hamilton-jacobi formulations. J. Comput. Phys.,
79(1):12–49.
Rouhi, R., Jafari, M., Kasaei, S., and Keshavarzian, P.
(2015). Benign and malignant breast tumors classifi-
cation based on region growing and cnn segmentation.
Expert Syst. Appl., 42(3):990–1002.
Suckling, J., Parker, J., Dance, D. R., Astely, S., Hutt,
I., Boggis, C. R. M., Ricketts, I., Stamatakis, E.,
Cerneaz, N., Kok, S.-L., Taylor, P., Betal, D., and Sav-
age, J. (1994). The mammographic image analysis so-
ciety digital mammogram database. In Proc. of the Int.
Congress Series on Exerpta Medica, pages 375–378.
Wang, Z., Ma, Y., Cheng, F., , and Yang, L. (2010). Review
of pulse-coupled neural networks. Image and Vision
Comput., 28(1):5–13.
Wang, Z., Yu, G., Kang, Y., Zhao, Y., and Qu, Q.
(2014). Breast tumor detection in digital mammogra-
phy based on extreme learning machine. Neurocom-
puting, 128:175–184.
Xian, M., Zhang, Y., and Cheng, H. D. (2015). Fully auto-
matic segmentation of breast ultrasound images based
on breast characteristics in space and frequency do-
mains. Pattern Recognit., 48(2):485–497.
Xie, W., Ma, Y., and Li, Y. (2015). Breast mass segmen-
tation in digital mammography based on pulse cou-
pled neural network and level set method. In Proc.
of the Satellite Data Compression, Communications,
and Processing XI, page 95010J.
Xie, W., Li, Y., and Ma, Y. (2016). Breast mass classifica-
tion in digital mammography based on extreme learn-
ing machine. Neurocomputing, 173:930–941.
Zhang, L. and Ji, Q. (2011). A bayesian network model for
automatic and interactive image segmentation. IEEE
Trans. Image Process., 20(9):2582–2593.
Zhou, L., Sun, Y., and Zheng, J. (2008). Automated color
image edge detection using improved pcnn model.
WSEAS Trans. Computers, 7(4):184–189.
BIOIMAGING 2016 - 3rd International Conference on Bioimaging
24
