
Correlation-based Method for Measuring the Duration of Motor Unit
Action Potentials
Armando Malanda
1
, Ignacio Rodríguez
2
, Luis Gila
3
, Iñaki García-Gurtubay
3
, Javier Navallas
1
and Javier Rodríguez
1
1
Department of Electric and Electronic Engineering, Universidad Pública de Navarra, Pamplona, Spain
2
Economics Department, Universidad de Navarra, Pamplona, Spain
3
Department of Neurophysiology, Complejo Hospitalario de Navarra, Pamplona, Spain
Keywords: MUAP, Duration, Electromyography, Correlation.
Abstract: We present a novel automatic method for measuring the duration of motor unit action potentials (MUAPs)
and compare it with two state-of-the-art automatic duration methods on normal and pathological MUAPs. To
this end we analyzed 313 EMG recordings from normal and pathological muscles during slight contractions.
A “gold standard” of the duration positions (start and end markers) was obtained for each MUAP from the
manual measurements determined by two expert electromyographists. The results of the novel method were
compared to those obtained by the two automatic methods using the “gold standard” duration measures for
the different groups of normal and pathological MUAPs. Several statistical tests were applied and showed
that the novel method provided closer duration positions to the “gold standard” and fewer gross aberrant errors
than those obtained by the two other methods in the four MUAP groups, being significantly different in many
of the cases.
1 INTRODUCTION
The motor unit (MU) is the functional unit for the
voluntary activation of the muscle. It comprises a
motor-neuron and the muscle fibres (MFs) innervated
by it. The order for contraction of these MFs comes
from the spinal cord and ultimately from the brain as
a train of action potentials traveling along the motor
unit. When they reach the muscle fibres highly
synchronized action potentials are generated in these
fibres and they travel towards the tendons producing
the contraction of the fibres. The potential wave
observed by an electrode near the MU is called motor
unit action potential (MUAP) and is dependent of the
structure and function of the whole MU. Analysis of
the MUAP is a central aspect of needle EMG studies
and is applied for diagnosis in clinical
neurophysiology practice.
The MUAP waveform is quantitatively
characterized by several parameters of which
duration is an essential one, as the rest of parameters
are measured within the MUAP time span defined by
its duration (Stalberg et al., 1986). MUAP duration is
related to the number of muscle fibres in the MU and
to the temporal dispersion of the activation times of
the fibres and their conduction velocities (Stalberg et
al., 1996).
The MUAP onset is usually an abrupt takeoff due
to the muscle fibre depolarization. However the offset
is more difficult to determine as the final phase of the
potential returns to the baseline (BL) very slowly and
asymptotically without a distinct end point (Sonoo
and Stalberg, 1993). It has been demonstrated in real
electromyographic (EMG) recordings and simulation
studies that the extinction of the action potentials
continues for over 20 ms after the main spike of the
MUAP (Lateva and McGill, 1998; Dumitru and King,
1999; Dumitru et al., 1999). Real routine EMG
signals almost invariably show slow baseline (BL)
fluctuations and other noise such that it is very
difficult to distinguish the full extension of the final
portion of the MUAP. This work is devoted to the
“clinical MUAP duration”, i.e., that which can be
observed in routine neurophysiological practice and
which has clinical meaning, as opposed to the
“physiologic MUAP duration” (Dumitru and King,
1999; Dumitru et al., 1999), which lasts until the
repolarization is entirely completed.
Measuring MUAP duration presents hard intrinsic
difficulties, so much that manual duration
Malanda, A., Rodríguez, I., Gila, L., García-Gurtubay, I., Navallas, J. and Rodríguez, J.
Correlation-based Method for Measuring the Duration of Motor Unit Action Potentials.
DOI: 10.5220/0005648301290136
In Proceedings of the 9th International Joint Conference on Biomedical Engineering Systems and Technologies (BIOSTEC 2016) - Volume 4: BIOSIGNALS, pages 129-136
ISBN: 978-989-758-170-0
Copyright
c
2016 by SCITEPRESS – Science and Technology Publications, Lda. All rights reserved
129

measurement has been previously described as “an
arbitrary task” (Sonoo, 2002) and low degrees of
reliability of manual duration markers have been
reported (Stalberg et al. 1986; Nandedkar et al., 1988;
Chu et al., 2003; Takehara et al., 2004b; Rodríguez et
al., 2007a). A number of automatic algorithms have
been designed to overcome the limitations of the
subjective assessment of MUAP duration (Stalberg et
al., 1986; Nandedkar et al., 1995). These were
eventually implemented in available commercial
EMG acquisition systems. But, as reported by several
authors (Bischoff et al., 1994; Stalberg et al., 1995;
Takehara et al., 2004a), conventional automatic
algorithms imply the necessity of continuous visual
supervision and frequent manual readjustments of the
duration markers. These methods fail to estimate
correctly the duration measurement mainly because
of the presence of noise and fluctuations in the BL and
other potentials, all of them being unfortunately
common in routine EMG signals.
Apart from the previous (conventional)
approaches, a different automatic duration
measurement method based on the wavelet
transforms was presented more recently (Rodríguez
et al., 2010; Rodríguez et al., 2012). In a comparative
study, this duration algorithm outperformed the
results of conventional methods over normal and
pathological signals. However, recent works are still
using conventional methods to measure MUAP
duration (Ghosh et al., 2014; Matur et al., 2014),
sometimes applying manual corrections (Jian et al.,
2015).
In this paper we present a novel duration
algorithm based on correlation. In biological systems
some physiological situations generate a train of
potentials or a quasi-periodic repetition of certain
waveforms. This is the case of MUAP trains in
voluntary or artificially-induced contractions of
skeletal muscles, the P, QRS and T complexes in the
ECG, the S1 and S2 sounds in the phonocardiogram,
or the spike-and-wave complexes in the EEG of
epileptic patients. If the physiological and recording
conditions stay stable during a certain period of time
in these situations, the potentials that can be recorded
will include a deterministic component, that can be
considered basically unaltered throughout this time,
and a stochastic component, i.e., noise and artifacts of
different origins which may include biological
potentials from other sources different from the ones
of interest. According to this, the correlation between
two waveforms of a train will be high. Moreover the
correlation between corresponding segments (i.e., the
initial upraise, the central spike, the final portion,
etc.), of two different waveforms of the train will also
be large.
On the other hand, the correlation between signal
periods in which these repetitive waveforms are
absent will be much lower. This is the central idea
behind our new MUAP duration estimation method:
to determine the potential duration regarding the time
extension in which it presents high correlation with
other potentials in the train.
In this work we present this novel algorithm, and
compare it to a well-known conventional automatic
duration method and to the more recent wavelet-
based approach over signals extracted from normal
and pathological muscles.
2 MATERIAL
We analyzed 313 recordings containing a 5 seconds
long EMG signal during slight voluntary
contractions: 68 signals from 14 normal deltoid
muscles, 105 from muscles with myopathies, 27 from
chronic neurogenic muscles, and 72 from subacute
neurogenic muscles. All these signals were recorded
from eight different muscles and exhibited definite
changes of characteristic pathologies. These signals
were acquired with a Medelec Synergy Mobile
electromyograph (Oxford Instruments Medical, Inc.),
using concentric needle electrodes (type DCN37;
diameter = 0.46 mm, recording area = 0.07 mm2;
Medtronic). The filter setting was 3 Hz to 10 kHz
with a sampling rate of 20 kHz and 16-bit analogue-
to-digital conversion. The digitized signals were
stored on the hard disk of a PC computer and further
analysis was performed off-line.
The multi-MUAP procedure of an automatic
decomposition method was used to extract MUAPs
from the continuous EMG signals (Florestal et al.,
2006). Epochs of 50 or 100 ms containing discharges
(potentials) of the same MUAP train were obtained.
The maximal negative peak of the MUAP was
centred on 40% of the length of the window epoch (at
20 or 40 ms corresponding to 50 or 100 ms epoch
window). A 100 ms epoch window was only used in
8 MUAPs from chronic and subacute neurogenic
muscles, as in these cases a 50 ms epoch was not
sufficient to visualize the whole MUAP.
Next, the waveforms of the isolated discharges of
each MUAP train were aligned in the time axis by
maximum correlation (Proakis and Manolakis, 1996;
Campos et al., 2000) and in the voltage axis by
euclidean distance minimization (the MUAP
discharges are ordered in accordance to their
euclidean distance to the average of MUAP
discharges) (Navallas et al., 2006). Besides,
BIOSIGNALS 2016 - 9th International Conference on Bio-inspired Systems and Signal Processing
130
interactive tools were implemented to visualize the
set of the extracted discharges in raster and
superimposed modes in order to discard manually
undesirable ones. The MUAP waveform was finally
obtained using a novel method of sample estimation
based on a sliding window algorithm (Malanda et al.,
2008).
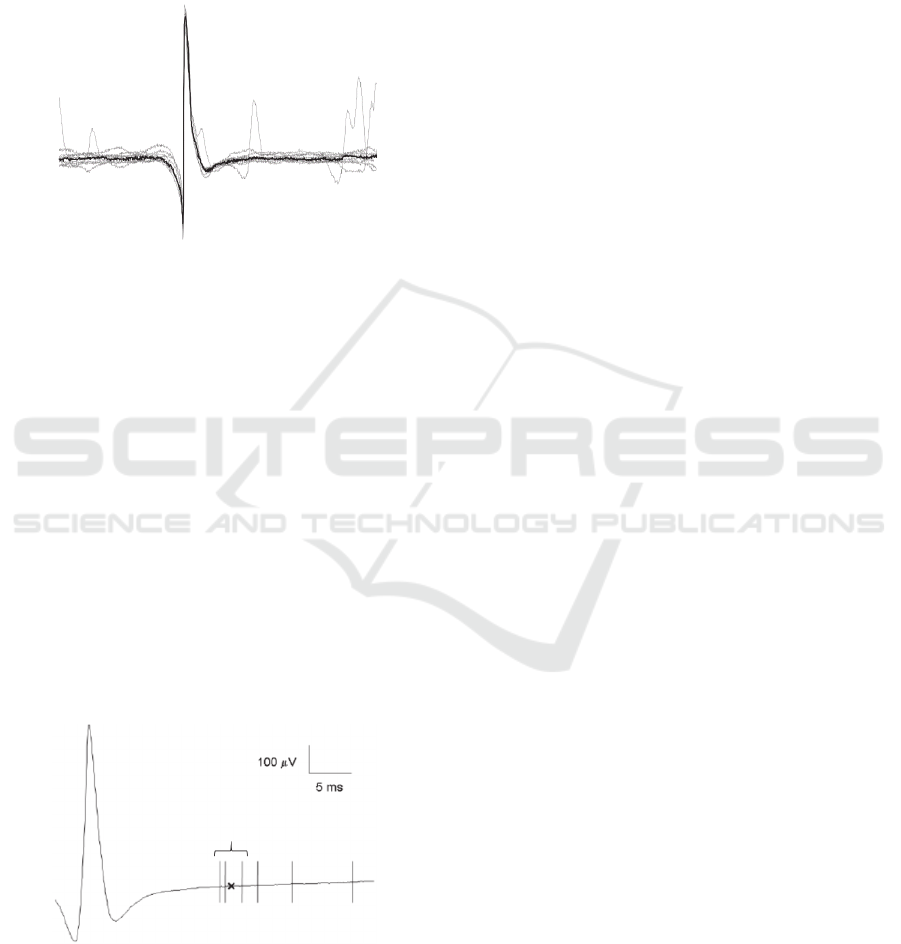
Figure 1: MUAP discharges (grey) and MUAP
representative waveform (black) obtained using a sliding
window algorithm.
This method optimizes the MUAP waveform
extraction procedure and can be applied in the
presence of low or high superposition of discharges
from other MUs (Fig. 1).
Well defined waveforms (avoiding
superimpositions, gross baseline fluctuations and
secondary potentials) of 3 to 10 (mean 9.9 and
standard deviation (SD) 0.7) discharges were selected
for each studied MUAP. All the selected MUAP
waveforms were well-defined above baseline (BL)
activity and had a “rise-time” < 1 ms (most of them
less than 500 μs). A total of 295 MUAPs were
accepted for analysis: 68 from normal deltoid
muscles, 124 from myopathic muscles, 20 from
chronic neurogenic muscles and 83 from subacute
neurogenic muscles.
Figure 2: Example of determination of the gold standard of
the duration markers positions (GSP) from six manual
marker positions for the end point (continuous vertical
lines). The GSP (x) is calculated as the mean position of the
three closest manual marker positions.
Notice that in relation to the number of analyzed
signals, the number of extracted MUAPs is reduced.
One of the reasons of this reduction is related to the
extraction process. In spite of the efficiency of the
described automatic methods for selection, alignment
and cleaning of the discharges, all the processes were
supervised and final selection were carried out
manually for ensuring the acceptation of
representative and distortion free MUAP waveforms.
3 METHODS
3.1 Determination of the Gold Standard
Duration Marker Positions
The high variability in the manual placement of
duration markers requires first to define the best
manual position among a set of several
measurements. Therefore, a method was devised by
the authors to find the “most likely” MUAP start and
end points. Over the whole set of MUAPs extracted
from the 313 recordings, two experienced
electromyographists (LGU and IGG) made each of
them three measurements of the duration, each
measurement separated by at least two weeks. To
perform this task they were provided with a software
interactive tool (designed in Matlab
TM
) that showed
the MUAP waveform and the set of the extracted
discharges in raster and superimposed modes. The
sensitivity scale was fixed at 100 μV/cm and the
sweep speed at 10 ms/cm to place the duration
markers. From the six manually marked positions for
the start or end markers, the “most likely” placement
was the mean point of the three closest positions
using a probabilistic procedure (Fig. 2) as explained
on a previous paper (Rodríguez et al., 2007a). This
was considered our gold standard position (GSP).
Among all the MUAPs extracted from the 313
recordings, we decided to select those MUAPs with a
high degree of agreement in the duration markers
manually placed. Therefore, MUAPs with a
maximum range of variation of 1 ms among all the
six manual placements for the start and also for the
end markers were selected. The mean and SD
obtained from the range of the three closest markers
were 0.02 and 0.05 ms for the start marker and 0.1
and 0.1 ms for the end marker. This confirms the GSP
markers as consistent estimates of the MUAP start
and end points. Fig. 2 illustrates the GSP
determination procedure.
Correlation-based Method for Measuring the Duration of Motor Unit Action Potentials
131

3.2 Automatic Methods for the
Measurement of MUAP Duration
Our proposed based-correlation method (CM) was
compared with two automatic methods for the
measurement of MUAP duration were used: a well-
known conventional method (Nandedkar et al., 1995),
and the wavelet-based method (WM) previously
mentioned (Rodríguez et al., 2010). The conventional
method and the WM were directly applied to the
representative MUAP waveforms (only 1 potential),
while the CM used the whole set of discharges of the
MUAP train (from 3 to 10 discharges).
3.2.1 Conventional Automatic Method
The conventional automatic method is detailed in
(Nandedkar et al., 1995), and we call it Nandedkar’s
method, NM. In NM, MUAPs are automatically
isolated, identified and classified using a multi-
MUAP system. In the referenced work from 50 to 65
discharges are extracted for each MUAP and its
representative waveform is obtained using median
averaging. To find the MUAP start and end markers
NM calculates the BL first, as the average of the first
5 ms of the window epoch. Once the BL is subtracted,
NM begins its search from the maximum MUAP
peak. From this point, the start and end markers are
calculated using thresholds related to the area under
the MUAP and to the amplitude sample values.
3.2.2 Wavelet Method
This MUAP duration estimation method was based
on the discrete wavelet transform (DWT) (Rodríguez
et al., 2007a; Rodríguez et al., 2007b; Rodríguez et
al., 2010; Rodríguez et al., 2012). In the DWT scales,
the peaks related to MUAP peaks are identified and
amplitude and slope thresholds are used to determine
MUAP start and end points. Besides, high frequency
noise and BL fluctuations can be put aside, so that BL
estimation is not necessary.
3.2.3 Correlation Method
As explained before, the time span of a set of
discharges from a MUAP train will be obtained so
that different segments of the potentials in the set will
be highly correlated to the corresponding segments in
other discharges in the set. The first thing to do is to
align the set of potentials in the time and amplitude
axes. Each potential in the train is time aligned to the
average potential by use of the standard technique of
cross correlation maximization (Proakis and
Manolakis, 1996). As for the amplitude alignment,
we simply add a constant amplitude to each potential
so that its Euclidean distance to the mean (i.e. the
average of all the potentials in the MUAP train) is
minimized.
After this, a sliding window of a certain
length (Lw) is moved along the complete length of
these discharges (50 or 100 ms in our case), with hops
of a given time length (h). We will call x
ij
to the i-th
discharges in the set as seen by the sliding window in
its j-th hop (Fig. 3).
The correlation coefficient (CC) between every
pair of segments in a given hop will be computed
(Matlab corrcoef function, which implements the
standard algorithm was used) and the average among
the CC of the different pairs will be obtained. This
will be repeated for every j-th hop, yielding a curve
of segment correlation along the complete interval
under study (50 or 100 ms in our case) (Fig. 4). This
curve usually has its maximum near the time
occurrence of the MUAP central spike, around which
a ‘plateau’ appears. Some ms at either side of the
maximum point, the curve normally declines rapidly.
To search the MUAP start marker, we will set a
threshold (Th1) and find the time instant when,
moving from the maximum peak to the left (towards
the initial part of the discharges), the correlation curve
goes below this threshold. This is tentatively our
MUAP start marker. To make the detection more
robust we will still move further to the left inspecting
if there is a second peak higher than Th2, in which
case, from this point we repeat again the search of the
point where the curves goes down below Th1 and
finally set there the MUAP start marker (Fig 4). To
obtain the MUAP end marker we repeat all this
operation, but moving from the maximum peak to the
right (towards the final part of the potentials). To
increase flexibility, different sets of parameters (Th1,
Th2, Lw and h) can be used for the detection of the
initial and the marker.
In our study, for the start marker we empirically
set Th1 and Th2 to 0.06 and 0.5, respectively, and Lw
and h to 1 and 0.1 ms, respectively. For the end
marker, Th1 and Th2 were set to 0.05 and 0.5,
respectively, and Lw and h to 2.5 and 0.25 ms,
respectively. Those values were set by visual
inspection, not by computer simulations.
3.2.4 Statistical Analysis
To assess the accuracy of the automatic methods for
MUAP duration measurement three statistical
comparative tests were performed for each method:
(a) Comparison of bias and precision. To measure the
performance of both methods, the mean and the SD
of the relative differences to the GSP were computed
BIOSIGNALS 2016 - 9th International Conference on Bio-inspired Systems and Signal Processing
132
for the start and end markers. The mean is related to
the bias of a method around the GSP and the SD is
related to its precision. The results of the methods in
each group of MUAPs were compared using a
Student’s t test.
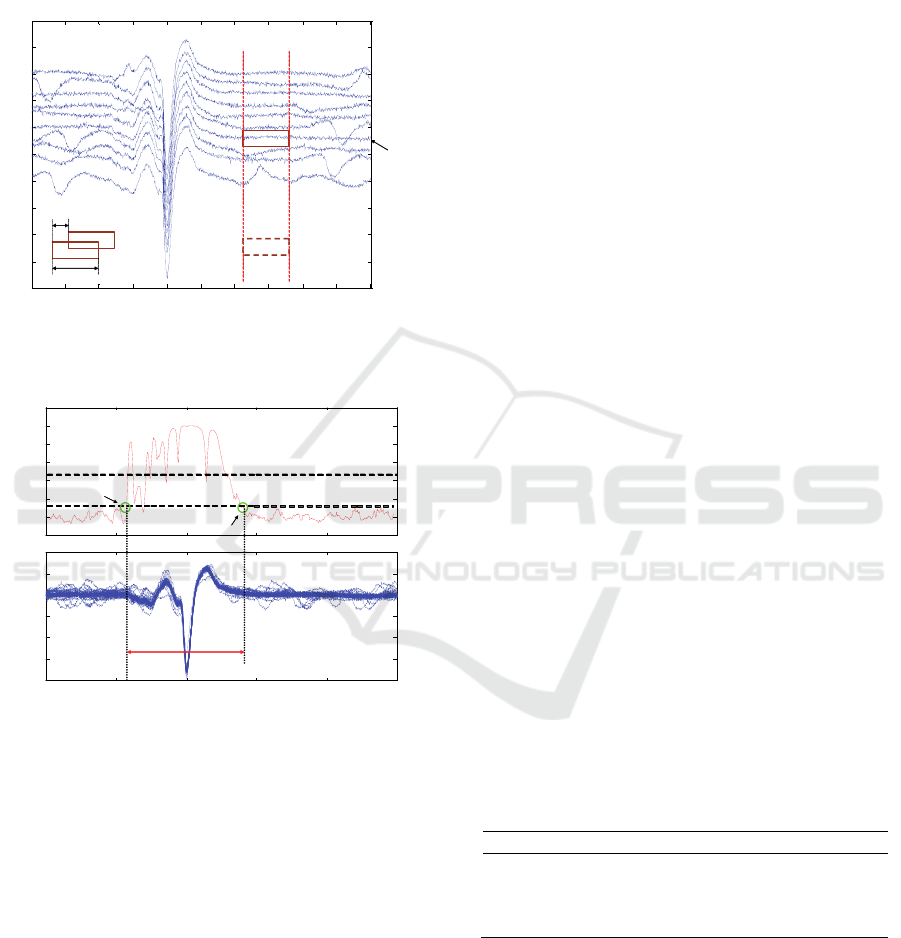
Figure 3: MUAP potentials presented in raster mode.
Sliding window for selection is shown. (Time axis is given
in samples and amplitude axis in Volts).
Figure 4: shows how the CM calculates the start and end
markers. (Time axis is given in samples and amplitude axis
in Volts).
(b) Calculation of the EMSE values. The mean of the
differences between the automatic marker position
(considering both start and end markers) and the GSP
(i.e., the bias of each method) and the standard
deviation (SD) of such differences (the precision)
were calculated. Then we calculated the estimated
mean square error (EMSE) of the differences as
follows:
enddendd
startdstartd
mean
meanEMSE
,
2
,
,
2
,
var
var
(1)
with mean
2
d,start
and var
d,start
being the square mean
and the variance, respectively, of the differences
between the start marker position of the method and
the start GSP for each MUAP group; and mean
2
d,end
and var
d,end
are equivalent measures for the end
marker. We also obtained the global EMSE value for
all the different MUAP groups using the next
equation:
TSSCC
MMNNG
NNEMSENEMSE
NEMSENEMSEEMSE
/)
(
(2)
where EMSE
N
, EMSE
M
, EMSE
C
and EMSE
S
are the
results for the normal, myopathic, chronic neurogenic
and subacute neurogenic potentials, respectively, and
N
N
, N
M
, N
C
and N
S
are the number of MUAPs of the
four different groups considered for the study, and N
T
is the total number of MUAPs from all the groups put
together.
(c) Rate of gross errors. The number of cases in which
the absolute difference between the GSP and the
automatic marker position was greater than 5 ms was
counted for each method. Such cases can be generally
considered as gross errors. The proportions of gross
errors corresponding to each method were compared
using the Chi-square test.
4 RESULTS
4.1 Comparison of Bias and Precision
The mean and the SD of the differences (bias and
precision, respectively) between the start and end
marker positions and GSPs of the three automatic
methods are respectively given in Tables 1 and 2.
Asterisks are shown to indicate significant
differences between any method and the CM.
Table 1: Differences between GSP and the start marker
positions assigned by NM and CM for the different MUAP
groups. Mean/SD (ms).* = p<0.05 (Student’s t test).
Chr=Chronic. Subac=Subacute.
MUAPs/Method NM WM CM
Normal -1.4/1.2* -0.3/1.3 -0.1/0.8
Myopathic -1.2/1.0* -0.5/1.1* 0.0/0.5
Chr. neurogenic 1.6/6.7 0.7/2.3* 0.0/0.5
Subac. neurogenic -1.3/1.4* -0.4/1.6 -0.1/0.9
Table 1 shows the results for the start marker
positions. It can be appreciated that the CM is the less
biased and the most precise method placing the start
marker, as it has simultaneously the lowest mean and
the lowest SD of differences to the GSP for all the
five MUAP groups. The CM presents significant
differences against NM in all the MUAP groups
100 200 300 400 500 600 700 800 900 1000
-1.5
-1
-0.5
0
0.5
1
1.5
2
2.5
x 10
-3
j-th hop
i-th
potential
Lw
h
0 200 400 600 800 100 0
-0 .2
0
0.2
0.4
0.6
0.8
1
1.2
0 200 400 600 800 100 0
-2
-1 .5
-1
-0 .5
0
0.5
1
x 1 0
-3
Th2
Th1
Correlation curve
MUAP discharges
Inic marker
End marker
MUAP duration
Correlation-based Method for Measuring the Duration of Motor Unit Action Potentials
133

except for the chronic neurogenic MUAPs. On the
other hand, the CM shows significant differences
against the WM in myopathic and chronic neurogenic
MUAPs.
Table 2: Differences between GSP and the end marker
positions assigned by NM and CM for the different MUAP
groups. Mean/SD (ms).* = p<0.05 (Student’s t test).
Chr=Chronic. Subac=Subacute.
MUAPs/Method NM WM CM
Normal 3.1/3.1* -0.1/3.5 -0.7/2.4
Myopathic 4.4/2.9* 0.6/2.6* -0.7/1.9
Chr. neurogenic 6.5/10.6* 1.4/7.6 -3.5/7.5
Subac. neurogenic 4..3/4.2* 0.8/4.0* -0.7/3.3
In Table 2, the results for the end marker positions
are shown. It can be appreciated that the CM presents
significant differences against the NM in all the
MUAP groups. Comparing to the WM, the CM
exhibits significant differences in myopathic and
subacute neurogenic MUAPs, with more precision
(lower SD).
From inspection of the two tables, we can notice
that in chronic neurogenic MUAPs, the bias of the
methods is higher and the precision is lower than in
other groups. This is probably a consequence of the
rare characteristics of the analysed signals, which are
the longest MUAPs and frequently present
polyphasia.
It can also be appreciated from these tables that
end marker placements present higher mean and SD
in absolute value than the start markers, which
indicates that it is more difficult for the automatic
methods to place the end markers than the start
markers.
4.2 Calculation of the EMSE Values
Table 3 shows the EMSE values of the three methods
for the four different MUAP groups and the global
EMSE. As it can be appreciated, the CM presents the
lowest EMSE in all the cases, except for the chronic
neurogenic MUAPs.
Table 3: EMSE values of NM and CM for the different
MUAP groups and EMSE
G
. Chr=Chronic.
Subac=Subacute.
MUAPs/Method NM WM CM
Normal 10.4 12.4 3.4
Myopathic 15.3 4.2 2.1
Chr. neurogenic 98.5 32.1 33.1
Subac. neurogenic 19.9 9.5 5.9
Total (EMSE
G
) 21.5 8.6 5.0
4.3 Rate of Gross Errors
The rate of gross errors for the start and end markers
of the three duration methods for the four different
MUAP groups are shown in Tables 4 and 5,
respectively.
For the start and end markers, the CM presents the
lowest rate of gross errors in all cases. Significant
differences were found between CM and the rest in
chronic neurogenic MUAPs for the start marker. For
the end marker, the CM showed significant
differences in normal, myopathic and subacute
neurogenic MUAPs against the NM, and in myopathic
MUAPs against the WM.
Table 4: Rate of automatic start marker placements in %
with differences to the GSP greater than 5 ms for NM and
CM and different MUAP groups.* = p<0.01 (Chi-square
test) Chr=Chronic. Subac=Subacute.
MUAPs/Method NM WM CM
Normal 0.0 2.9 0.0
Myopathic 1.6 0.8 0.0
Chr. neurogenic 6.9* 10.3* 0.0
Subac. neurogenic 3.6 3.6 1.2
Table 5: Rate of automatic end marker placements with
differences to the GSP greater than 5 ms for NM and CM
and different MUAP groups.* = p<0.01 (Chi-square test)
Chr=Chronic. Subac=Subacute.
MUAPs/Method NM WM CM
Normal 29.4* 11.8 7.4
Myopathic 39.5* 9.7* 3.2
Chr. neurogenic 37.9 27.6 13.8
Subac. neurogenic 42.2* 9.6 9.6
4.4 Visual Assessment
Some examples of the NM and the CM over normal
and the different pathological MUAP groups are
shown in Figure 5.
Normal MUAPs can have small or medium
amplitude (Fig. 5.a). Polyphasic serrated myopathic
MUAP is more difficult to measure (Fig. 5.b).
Chronic poten tials can have great amplitude and also
large duration (Fig. 5.c).
Finally, subacute neurogenic MUAPs can have
multiple turns and be polyphasic too (Fig. 5.d). In all
these cases the CM achieves the best results.
4.5 Computational Cost
The CPU times in ms (mean/SD) for the Matlab
implementation of the three algorithms (NM, WM
and CM) were 0.26/0.6, 5.1/2.4 and 513.3/101.4 ms,
BIOSIGNALS 2016 - 9th International Conference on Bio-inspired Systems and Signal Processing
134
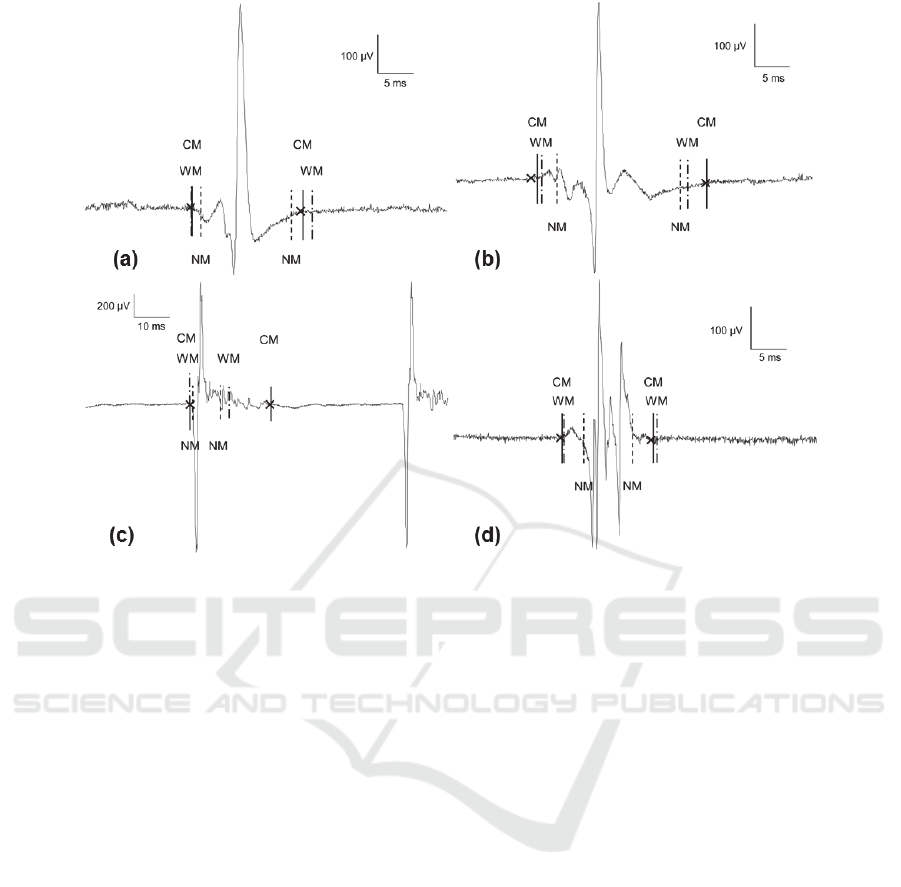
Figure 5: Examples of duration measurements of NM and CM on normal (a), myopathic (b), chronic neurogenic (c) and
subacute neurogenic (d) MUAPs. GSP are in crosses.
respectively. Therefore they are all fast enough for
any real-time application.
5 DISCUSSION
MUAP duration is a very important, yet elusive,
parameter in quantitative EMG, as it gives relevant
information about the MU generating the MUAP (the
number of fibres) and is also critical for the estimation
of other MUAP waveform parameters. In this paper
we have presented an automatic procedure to obtain
MUAP duration markers with high agreement with
the markers obtained by expert neurophysiologists in
normal and pathological signals.
The novel approach provides more accurate
duration marker placements and fewer gross aberrant
errors for normal and pathological MUAPs than the
other two tested methods. This, together with its
simplicity and low computational cost makes it a very
valuable tool for quantitative analysis of MUAPs,
reducing the requirement for electromyographists’
manual intervention. Moreover, real-time
implementations in a clinical setting could reduce
exploration time and patient discomfort.
Future works will focus on computational
approaches aimed to obtain optimum values for the
CM parameters.
ACKNOWLEDGEMENTS
This work has been supported by the Spanish
Ministry of Education, Culture and Sport, under the
TEC2014-58947-R project.
REFERENCES
Bischoff C, Stalberg E, Falck B, Eeg-Olofsson KE.
Reference values of motor unit action potentials
obtained with multi-MUAP analysis. Muscle Nerve
1994;17:842-851.
Chu J, Takehara I, Li TC, Schwartz I. Skill and selection
bias has least influence on motor unit action potential
firing rate/frequency. Electromyogr Clin Neurophysiol
2003; 43:387-392.
Campos C, Malanda A, Gila L, Segura V, Lasanta MI,
Artieda J. Quantification of jiggle in real
electromyographic signals. Muscle Nerve
2000;23:1022-1034.
Dumitru D, King JC. Motor unit action potential duration
and muscle length. Muscle Nerve 1999; 22:1188-1195.
Dumitru D, King JC, Zwarts MJ. Determinants of motor
unit action potencial duration. Clin Neurophysiol
1999;110:1876-1882.
Correlation-based Method for Measuring the Duration of Motor Unit Action Potentials
135

Gila-Useros L, Malanda-Trigueros A, Navallas-Irujo J,
Rodríguez-Carreño I, Rodríguez-Falces J, García de
Gurtubay-Gálligo I. Optimización de la extracción de la
forma de onda del potencial de acción de unidad
motora. RevNeurol 2008; 47: 438.
Florestal JR, Mathieu PA, Malanda A. Automatic
decomposition of intramuscular electromyographic
signals. IEEE Transactions on Biomedical Engineering.
Vol 53, no. 5, May 2006. pp. 832-839.
Ghosh PS, Sorenson EJ. Diagnostic Yield of
Electromyography in Children With Myopathic
Disorders. Pediatric Neurology 2014; 52(2): 215–219.
Jian F, Pan H, Zhang Z, Lin J, Chen N, Zhang L, et al.
Sphincter electromyography in diabetes mellitus and
multiple system atrophy. Neurourol Urodyn. 2015
Sep;34(7):669-74.
Lateva Z, McGill K. The physiological origin of the slow
afterwave in muscle action potentials.
Electroencephalogr Clin Neurophysiol. 1998;109:462–
469.
Malanda A, Navallas J, Gila L, Rodríguez J, Rodríguez I,
“Extraction of representative potentials in MUAP sets”,
XVIIth Congress of the International Society of
Electrophysiology and Kinesiology. Niagara Falls,
2008.
Matur Z, Baslo MB, Öge AE. Quantitative
electromyography of the frontalis muscle. J Clin
Neurophysiol. 2014 Feb;31(1):48-54.
Nandedkar S, Barkhaus P, Sanders D, Stalberg E. Analysis
of the amplitude and area of the concentric needle EMG
motor unit action potentials. Electroencephalogr Clin
Neurophysiol 1988;69:561-567.
Nandedkar S, Barkhaus P, Charles A. Multi motor unit
action potential analysis (MMA). Muscle Nerve 1995;
18:1155-1166.
Navallas J, Malanda A, Gila L, Rodríguez J, Rodríguez I,
Florestal JR, Mathieu PA. “An algorithm for optimal
discharge selection for MUAP waveform extraction”.
XVIth Congress of the International Society of
Electrophysiology and Kinesiology. Turín, 2006.
Proakis JG, Manolakis DG. Digital signal processing:
principles, algorithms and applications. London:
Prentice Hall, 1996.
Rodríguez I, Gila L, Malanda A, Gurtubay I, Mallor F,
Gómez S, Navallas J, Rodríguez J. Motor unit action
potential duration, I: variability of manual and
automatic measurements. J Clin Neurophysiol
2007a;24:52-58.
Rodríguez I, Gila L, Malanda A, Gurtubay I, Mallor F,
Gómez S, Navallas J, Rodríguez J. Motor unit action
potential duration, II: a new automatic measurement
method based on the wavelet transform. J Clin
Neurophysiol 2007b;24:59-69.
Rodríguez I, Gila L, Malanda A, Gurtubay IG, Navallas J,
Rodríguez J. Application of a novel automatic duration
method measurement based on the wavelet transform
on pathological motor unit action potentials. Clin
Neurophysiol 2010; 121:1574-1583.
Rodríguez I, Gila L, Malanda A. Motor Unit Action
Potential Duration: Measurement and Significance, in
Advances in Clinical Neurophysiology, INTECH, 2012.
Stalberg E, Andreassen S, Falck B, Lang H, Rosenfalck A,
Trojaborg W.. Quantitative analysis of individual motor
unit potentials - a proposition for standardized
terminology and criteria for measurement. J Clin
Neurophysiol, 1986; 3:313-348.
Stalberg E, Falck B, Sonoo M, Astrom M. Multi-MUP
EMG analysis-a two year experience with a quantitative
method in daily routine. Electroencephalogr Clin
Neurophysiol 1995; 97:145-154.
Stalberg E, Nandedkar S, Sanders DB, Falck B.
Quantitative motor unit potential analysis. J Clin
Neurophysiol, 1996;13:401-422.
Sonoo M, Stalberg E. The ability of MUP parameters to
discriminate between normal and neurogenic MUPs in
concentric EMG: analysis of the MUP “thickness” and
the proposal of “size index”. Electroencephalogr Clin
Neurophysiol 1993;89:291-303.
Sonoo M. New attempts to quantify concentric needle
electromyography. Muscle Nerve 2002; Suppl 11:S98-
S102.
Takehara I, Chu J, Li TC, Schwartz I. Reliability of
quantitative motor unit action potential parameters.
Muscle Nerve 2004a;30:111-113.
Takehara I, Chu J, Schwartz I, Aye HH. Motor unit action
potential (MUAP) parameters affected by editing
duration cursors. Electromyogr Clin Neurophysiol
2004b; 44:265-269.
BIOSIGNALS 2016 - 9th International Conference on Bio-inspired Systems and Signal Processing
136
