
TagSpheres: Visualizing Hierarchical Relations in Tag Clouds
Stefan J
¨
anicke and Gerik Scheuermann
Image and Signal Processing Group, Institute for Computer Science, Leipzig University, Leipzig, Germany
Keywords:
Tag Clouds, Text Visualization, Hierarchical Data.
Abstract:
Tag clouds are widely applied, popular visualization techniques as they illustrate summaries of textual data in
an intuitive, lucid manner. Many layout algorithms for tag clouds have been developed in the recent years,
but none of these approaches is designed to reflect the notion of hierarchical distance. For that purpose,
we introduce a novel tag cloud layout called TagSpheres. By arranging tags on various hierarchy levels and
applying appropriate colors, the importance of individual tags to the observed topic gets assessable. To explore
relationships among various hierarchy levels, we aim to place related tags closely. Three usage scenarios
from the digital humanities, sports and aviation, and an evaluation with humanities scholars exemplify the
applicability and point out the benefit of TagSpheres.
1 INTRODUCTION
The usage of tag clouds to visualize textual data is
a relatively novel technique, which was rarely ap-
plied in the past century. In 1976, Stanley Milgram
was one of the first scholars who generated a tag
cloud to illustrate a mental map of Paris, for which
he conducted a psychological study with inhabitants
of Paris, aiming to analyze their mental represen-
tation of the city (Milgram and Jodelet, 1976). In
1992, a German edition of “Mille Plateaux”, written
by the French philosopher Gilles Deleuze, was pub-
lished with a tag cloud printed on the cover to summa-
rize the book’s content (Deleuze and Guattari, 1992).
This idea to present a visual summary of textual data
can be seen as the primary purpose of tag clouds (Sin-
clair and Cardew-Hall, 2008). But the popularity of
tag clouds nowadays is attributable to a frequent us-
age in the social web community in the 2000s as
overviews of website contents. Although there are
known theoretical problems concerning the design of
tag clouds (Vi
´
egas and Wattenberg, 2008), they are
generally seen as a popular social component per-
ceived as being fun (Hearst and Rosner, 2008). With
the simple idea to encode the frequency of terms to
a given topic, tag clouds are intuitive, comprehensi-
ble visualizations, which are widely used metaphors
(1) to display summaries of textual data, (2) to sup-
port analytical tasks such as the examination of text
collections, or even (3) to be used as interfaces for
navigation purposes on databases.
In the recent years, various algorithms that com-
pute effective tag cloud layouts in an informative and
readable manner has been developed. One of the most
popular techniques is Wordle (Vi
´
egas et al., 2009),
which computes compact, intuitive tag clouds and can
be generated on the fly using a web-based interface.
1
Although the produced results are very aesthetic, the
different used colors do not transfer information and
the final arrangement of tags depends only on the
scale, and not on the content of tags or potential re-
lationships among them. Some approaches attend to
the matter of visualizing more information than the
frequency of terms with tag clouds – most often to
compare textual summaries of different data facets.
In this paper, we present the tag cloud design Tag-
Spheres, which endeavors to effectively visualize hi-
erarchies in textual summaries. The motivation arose
from research on philology. Humanities scholars
wanted to analyze the clause functions of an ancient
term’s co-occurrences. Querying the large database,
the scholars often face numerous results in the form
of text passages. When only plain lists are provided
to interact with the results, the discovery of significant
text passages and the analysis of the contexts in which
the chosen term was used becomes laborious. To sup-
port this task, we provide summaries of text passages
in the form of interactive tag clouds that group terms
in accordance to their distance to the search term. So,
the humanities scholar gets an overview and is able to
retrieve text passages of interest on demand.
1
http://www.wordle.net/
Jänicke, S. and Scheuermann, G.
TagSpheres: Visualizing Hierarchical Relations in Tag Clouds.
DOI: 10.5220/0005654100150026
In Proceedings of the 11th Joint Conference on Computer Vision, Imaging and Computer Graphics Theory and Applications (VISIGRAPP 2016) - Volume 2: IVAPP, pages 17-28
ISBN: 978-989-758-175-5
Copyright
c
2016 by SCITEPRESS – Science and Technology Publications, Lda. All rights reserved
17

Figure 1: Wordle of Edgar Allan Poe’s The Raven.
We designed TagSpheres in a way that various
types of text hierarchies can be visualized in an intu-
itive, comprehensible manner. To emphasize the wide
applicability of TagSpheres, we list several examples
from the digital humanities, sports and aviation.
2 RELATED WORK
Although tag clouds rather became popular in the so-
cial media, research in visualization attended to the
matter of developing various layout techniques in the
last years. A basic tag cloud layout is a simple list of
words placed on multiple lines (Vi
´
egas et al., 2007).
In such a list, tags are typically ordered by their im-
portance to the observed issue, which is encoded by
font size (Murugesan, 2007). An alphabetical order
is also often used, but a study revealed that this or-
der is not obvious for the observer (Hearst and Ros-
ner, 2008). Later, more sophisticated tag cloud lay-
out approaches that rather emphasize aesthetics than
meaningful orderings were developed. A represen-
tative technique is Wordle (Vi
´
egas et al., 2009; Jo
et al., 2015), which produces compact aesthetic lay-
outs with tags in different colors and orientations, but
both features do not transfer any additional informa-
tion. A Wordle showing the most important terms in
Edgar Allan Poe’s The Raven is given in Figure 1.
Various approaches highlight relationships among
tags by forming visual groups. In thematically clus-
tered or semantic tag clouds, the detection of tags
belonging to the same topic is supported by placing
these tags closely (Lohmann et al., 2009). Tradi-
tional, semantic word lists place clustered tags suc-
cessively (Schrammel and Tscheligi, 2014). More so-
phisticated layout methods often use force directed
approaches with semantically close terms attracting
each other (Cui et al., 2010; Wang et al., 2014; Liu
et al., 2014). After force directed tag placement, tag
cloud layouts can be compressed by removing occur-
Figure 2: TagPie supports the comparison of co-occur-
rences of the Latin terms gibbus, gibbum and gibbosus.
ring whitespaces (Wu et al., 2011).
Some methods generate individual tag clouds for
each group of related tags, and combine the resultant
multiple tag clouds to a single visual unity afterwards.
An example is the Star Forest method (Barth et al.,
2014), which applies a force directed method to pack
multiple tag clouds. Other approaches use predefined
tag cloud containers, e.g., user-defined polygonal
spaces in the plane (Paulovich et al., 2012), polygonal
shapes of countries (Nguyen et al., 2011), or Voronoi
tesselations (Seifert et al., 2011). Newsmap uses a
treemap layout (Shneiderman and Plaisant, 1998) to
group newspaper headlines of the same category in
blocks (Weskamp, 2015). Morphable Word Clouds
morph the shapes of tag cloud containers in order to
visualize temporal variance in text summaries (Chi
et al., 2015). For the comparison of the tags of var-
ious text documents, a ConcentriCloud divides an el-
liptical plane into sectors that list shared tags of sev-
eral subsets of the underlying texts (Lohmann et al.,
2015). Due to the rather independent computation
of individual tag clouds – which often leads to large
whitespaces in the final composition step – the above
mentioned methods can be seen as sophisticated small
multiples. A rather traditional small multiples ap-
proach is Words Storms (Castell
`
a and Sutton, 2014)
that supports the visual comparison of textual sum-
maries of documents.
Tag clouds also have been used to visualize trends.
Parallel Tag Clouds generate alphabetically ordered
tag lists as columns for a number of time slices and
highlight the temporal evolution of a tag placed in
various columns on mouse interaction (Collins et al.,
IVAPP 2016 - International Conference on Information Visualization Theory and Applications
18

Table 1: Characteristics of TagSpheres usage scenarios.
domain digital humanities sports aviation
(see Section 4.1) (see Section 4.2) (see Section 4.3)
task analyzing the clause func-
tions of the co-occurrences
of a search term T
comparing the performances
of teams in championships
observing all direct flights
from an airport or a city
H
1
search term T best performing teams departure airport/city
H
2
, . . . , H
n
co-occurrences in depen-
dency on the word distance
to T
teams grouped by decreas-
ing performance
direct federal (H
2
), conti-
nental (H
3
) and worldwide
flights (H
4
)
n 4 6, 8 2..4
w(t) number of (co-)occurrences
of t
number of a team’s appear-
ances
inverse distance weighting
between departure and ar-
rival airports/cities
p(t) equally labeled tag of a
higher hierarchy level
same team if already placed
on a higher hierarchy level
previously placed tag of the
same country/continent
strong tag
relations
equally labeled tags same teams if placed on
multiple hierarchy levels
departure/arrival air-
ports/cities
weak tag
relations
spelling variants N/A airports/cities of the same
country/continent
2009). In contrast, SparkClouds attach a graph show-
ing the tag’s evolution over time (Lee et al., 2010).
Other approaches overlay time graphs with tags char-
acteristic for certain time ranges (Shi et al., 2010).
Only few approaches generate multifaceted tag
cloud layouts in a single, continuous flow that in-
cludes the positioning of all tags belonging to vari-
ous groups. RadCloud visualizes tags belonging to
various groups within a shared elliptical area (Burch
et al., 2014). In Compare Clouds, tags of two media
frames (MSM, Blogs) are comparatively visualized in
a single cloud (Diakopoulos et al., 2015). To support
the comparative analysis of multiple tag groups, Tag-
Pies are arranged in a pie chart manner (J
¨
anicke et al.,
2015a). An example showing the comparative visual-
ization of the co-occurrences of Latin terms is shown
in Figure 2.
Although techniques like TagPies or Parallel Tag
Clouds are capable of visualizing sequences of tag
groups, none of the mentioned approaches endeavors
to visually encode generic hierarchical information
intuitively in a single, compact, aesthetic tag cloud.
TagSpheres – presented in this paper – are designed
to fill this gap.
3 DESIGNING TAGSPHERES
The central idea of TagSpheres is the visualization of
textual summaries that comprise hierarchical infor-
mation. This paper provides three usage scenarios
that exemplify hierarchies in textual data (see Sec-
tion 4). An overview of the characteristics of these
examples is given in Table 1.
Given n hierarchy levels H
1
, . . . , H
n
, the top hier-
archy level H
1
contains tags representing the focus of
interest of a usage scenario. All other tags are divided
into n − 1 groups in dependency on their hierarchical
distance according to the observed topic, or to the tags
on H
1
. Each tag t in TagSpheres has a weight w(t) re-
flecting its importance, and an optional predecessor
tag p(t) representing a relationship to another tag that
was placed before t and usually belongs to a higher
hierarchy level. In dependency on the observed topic,
it might be necessary to place the same tag on several
hierarchy levels to encode the change of a tag’s impor-
tance among hierarchies. In such cases, predecessor
tags help to visually link these tags.
3.1 Design Decisions
When designing TagSpheres, we use the following,
well-established design features for tag clouds:
• Font Size: Evaluated as the most powerful prop-
erty (Bateman et al., 2008), font size encodes the
weight w(t) of a tag.
• Orientation: As rotated tags are perceived
as “unstructured, unattractive, and hardly read-
able” (Waldner et al., 2013), we do not rotate tags
to keep the layout easily explorable.
• Color: Being the best choice to distinguish cat-
egories (Waldner et al., 2013), various colors are
assigned to tags belonging to different hierarchy
levels. As TagSpheres encode the distance to a
TagSpheres: Visualizing Hierarchical Relations in Tag Clouds
19

(a) Resultant color maps for n = 2, . . . , 8
hierarchy levels.
(b) Using spheres for the tags of dif-
ferent hierarchy levels.
(c) Vectors for occlusion check to
guarantee hierarchical coherence.
Figure 3: TagSpheres layout algorithm details.
(a) Placing all tags of H
1
. (b) Placing a tag without predecessor. (c) Placing a tag with predecessor.
Figure 4: Determining tag positions using an Archimedean spiral.
given topic, the usage of a categorial color map is
inappropriate. Unfortunately, suitable sequential
color maps as provided by the ColorBrewer (Har-
rower and Brewer, 2003) produce less distinctive
colors even for a small number of hierarchy levels,
so that adjacent tags belonging to different hierar-
chy levels are hard to classify. Following the sug-
gestions given by Ware (Ware, 2013), we defined
a divergent cold-hot color map using red for the
first hierarchy level and blue for tags belonging to
the last hierarchy level n. To avoid uneven visual
attraction of tags, we only chose saturated colors
that are in contrast to the white background. Ex-
ample color maps for up to eight hierarchy levels
are shown in Figure 3(a).
3.2 Layout Algorithm
In preparation, the tags are sorted by increasing hier-
archy level, so that all tags within the same hierarchi-
cal distance to H
1
are placed successively. The tags of
each hierarchy level are ordered by decreasing weight
to ensure that important tags are circularly well dis-
tributed.
To avoid large whitespaces, a problem addressed
by Seifert (Seifert et al., 2008), our method follows
the idea of the Wordle algorithm (Vi
´
egas et al., 2009)
– permitting overlapping tag bounding boxes if the
tags’ letters do not occlude – to determine the posi-
tions of tags. So, we obtain compact, uniformly look-
ing tag clouds for the underlying hierarchical, textual
data. To ensure well readable tag clouds, we use a
minimal padding between letters of different tags.
As shown in Figure 3(b), we aim to visually com-
pose tags of the same hierarchy level in the form of
spheres around the tag cloud origin at (0, 0). Ini-
tially, we iteratively determine positions for the tags
of H
1
in the central sphere using an Archimedean spi-
ral originating from (0, 0). An example is given in
Figure 4(a). For each tag t of the remaining hierarchy
levels H
2
, . . . , H
n
, we also use (0, 0) as spiral origin,
if p(t) is not provided (see Figure 4(b)). If p(t) is
defined, we use the predecessor’s position as spiral
origin (see Figure 4(c)). As a consequence, hierar-
IVAPP 2016 - International Conference on Information Visualization Theory and Applications
20

chically related tags are placed closely and visually
compose in the form of rays originating from (0, 0) as
shown in Figure 8. In contrast to other spiral based tag
cloud algorithms, we avoid to cover whitespaces with
tags of hierarchy level H
i
within spheres of already
processed hierarchy levels H
1
, . . . , H
i−1
. Dependent
on the quadrant in the plane, in which a tag shall be
placed, we search for already placed tags intersect-
ing two vectors originating from the dedicated posi-
tion as illustrated in Figure 3(c). If no intersections
are found, we place the tag. This approach coheres
all tags of a hierarchy level as a visual unity outside
the inner bounds of the previously processed hierar-
chy levels’ spheres.
3.3 Interactive Design
Implemented as an open source JavaScript library,
TagSpheres can be dynamically embedded into web-
based applications. With mouse interaction, we en-
able the user to detect hierarchically related tags
quickly. Thereby, we distinguish between strongly
and weakly related tags, which are defined in depen-
dency on the underlying usage scenario (see Table 1).
Related tags are shown on mouseover (see Figure 5).
For strongly related tags we use a black font on trans-
parent backgrounds having the hierarchy levels’ as-
signed color. In contrast, weakly related tags retain
their saturated font color, but gray, transparent back-
grounds indicate relationships.
TagSpheres provide a configurable tooltip dis-
played when hovering or clicking a tag to be used,
e.g., to list all related tags and their weights. The
mouse click function can be used for displaying ad-
ditional information. e.g., to link to external sources,
or to show text passages containing the chosen tag.
4 USE CASES
TagSpheres are applicable whenever statistics of un-
structured text shall be visualized in the form of a tag
cloud and a decent hierarchy among the tags exists.
This section illustrates usage scenarios of TagSpheres
for text-based data from three different domains: dig-
ital humanities, sports and aviation.
4.1 Digital Humanities Scenario
Within the digital humanities project eXChange,
2
his-
torians and classical philologists work with a database
containing a large amount of digitized historical texts
2
http://exchange-projekt.de/
in Latin and ancient Greek. Usually, humanities
scholars pose keyword based search queries and often
receive numerous results, which are hard to revise in-
dividually. As a consequence, the generation of valu-
able hypotheses is a laborious, time-consuming pro-
cess. To facilitate the humanities scholars’ workflows,
we develop visual interfaces that attempt to steer the
analysis of search results into promising directions.
TagPies – also developed within the eXChange
project – are tag clouds arranged in a pie chart man-
ner that support the comparison of multiple search
query results (J
¨
anicke et al., 2015a). Using a Tag-
Pie, humanities scholars analyze contextual similar-
ities and differences of the observed terms – an ex-
ample is given in Figure 2. Whereas the tags of the
same groups are placed in the same circular sectors
in TagPies to support their comparative analysis, the
intention of TagSpheres is the visualization of hierar-
chical information. This supports approaching a fur-
ther research interest of the humanities scholars: the
analysis and classification of a term’s co-occurrences
according to their clause functions. For this purpose,
the scholars required four-level TagSpheres display-
ing the following tags:
H
1
: search term T ,
H
2
: co-occurrences of T with word distance 1,
H
3
: co-occurrences of T with word distance 2, and
H
4
: co-occurrences of T with word distance 3 up to
word distance m.
The font size of T on level H
1
encodes how frequent
the search term occurs in the underlying text corpus;
the font sizes of all other terms reflect their number
of co-occurrences with T in dependency on the corre-
sponding distance. On H
4
, font sizes are normalized
in relation to the distance range m − 2. A tag on hi-
erarchy level H
i
receives a predecessor tag if the cor-
responding term occurs on one of the previous layers
H
i−1
, . . . , H
1
.
A use case provided by one of the humanities
scholars involved in the eXChange project shall il-
lustrate the utility of TagSpheres to support the clas-
sification of a term’s co-occurrences by their clause
functions. Analyzing the co-occurrences of morbo
(disease), terms in similar relationships to the given
topic were discovered and classified (see Figure 5). In
large distances, the humanities scholar found objects
in form of affected parts of the body, e.g., head (ca-
put), soul (animo) and limbs (membrorum), affected
persons, e.g., son (filius), woman (mulier) and king
(rex), and related places, e.g., Rome (romam), church
(ecclesia) and villa. Closer to morbo (most often with
distance 1 or 2), typical attributes and predicates can
be found. Whereas attributes describe the type or
TagSpheres: Visualizing Hierarchical Relations in Tag Clouds
21

Figure 5: The analysis of co-occurrences of the Latin term morbo (disease) on word distance.
IVAPP 2016 - International Conference on Information Visualization Theory and Applications
22

Figure 6: Close reading of text passages containing morbo
and comitiali with word distance 1.
intensity of the disease, e.g., pestilential (pestifero),
heavy (gravi), deadly (exitiali) and acute (acuto), the
occurring predicates illustrate the disease’s progress,
e.g., seize (correptus), dissappear (periit) and wors-
ening (ingravescente). Adjacent to morbo, specific
terms for “moral” diseases, e.g., greediness (avari-
tiae), arrogance (superbiae) and lust (concupiscen-
tiae), and actual diseases like jaundice ([morbo] re-
gio), leprosy (leprae) and two common names for
epilepsy ([morbo] comitiali, [morbo] sacro) occur.
In this usage scenario, the interaction capabili-
ties of TagSpheres are tailored according to the needs
of the humanities scholars. Hovering a tag opens a
tooltip showing the term’s number of occurrences on
all hierarchy levels as strongly related tags. Addition-
ally, variant spellings or cases of the term are listed
with their corresponding frequencies as weakly re-
lated tags to support the analysis process. An impor-
tant requirement for the humanities scholars was the
discovery of potentially interesting text passages, but
they desired a straightforward access to the underly-
ing texts in general. This so-called close reading is of-
ten reported as an important component when design-
ing visualizations for humanities scholars (J
¨
anicke
et al., 2015b). TagSpheres support close reading by
clicking a tag, which displays the corresponding text
passages containing the search term and the clicked
term with the chosen distance. An example for text
passages containing the adjacent terms morbo and
comitiali is shown in Figure 6.
4.2 Championship Performances
This scenario illustrates how TagSpheres can be used
to comparatively visualize performances in champi-
onships. An example is given in Figure 7 that illus-
trates the success of football clubs ever played in Eng-
Figure 7: Performances of English first league football
clubs from 1888/89 – 2014/15.
land’s first league. Here, we use the average rank at
the end of the seasons to cluster 68 clubs into eight
hierarchy levels, and font size encodes the number of
appearances.
For another example, we processed a dataset con-
taining the results of all national teams ever qualified
for the FIFA World Cup. We receive the following
six-level hierarchy:
H
1
: FIFA World Champions,
H
2
: second placed national teams,
H
3
: national teams knocked out in the semifinal,
H
4
: national teams knocked out in the quarterfinal,
H
5
: national teams knocked out in the second round
(second group stage or last 16), and
H
6
: national teams knocked out in the (first) group
stage.
The nations’ names are used as tags and font size en-
codes how often a national team partook a champi-
onship round without reaching the next level. There-
fore, most nations occur on various hierarchy levels.
If a tag t for a nation to be placed on H
i
was already
placed at a higher hierarchy level H
i−1
, . . . , H
1
, we use
the corresponding tag as predecessor p(t).
Figure 8 shows the resultant TagSphere. Espe-
cially this scenario illustrates the benefit of using the
positions of predecessor tags as spiral origins for suc-
cessor tags. In most cases, the various tags of a nation
are closely positioned. Hovering a tag displays the all-
time performance of the corresponding national team
for all championship rounds in a tooltip. Expectedly,
Brazil and Germany achieved very good results, es-
pecially in the last championship rounds. In contrast,
Italy was often knocked out in the first round, but in
case of reaching the semifinal (8x), Italy often became
TagSpheres: Visualizing Hierarchical Relations in Tag Clouds
23

Figure 8: Performances of all nations qualified for the FIFA World Cup.
FIFA World Champion (4x). England and Spain show
nearly equal performances. With the same number of
appearances (38x), both nations reached the semifinal
only twice. Few nations have a 100% success rate in
the group stage. Qualified three times for the FIFA
World Cup, Senegal always reached the quarterfinals.
Most nations, e.g., Sweden and Cameroon, show the
expected pattern “the higher the championship round,
the smaller the number of appearances.”
4.3 Airport Connectivity
To analyze the federal, continental and worldwide
connectivity of airports, we derived a dataset from the
OpenFlights database,
3
which provides a list of di-
3
http://openflights.org/data.html
rect flight connections between around 3,200 airports
worldwide. With the selected departure airport d (or
city) on H
1
, all other airports (or cities) reachable with
a non-stop flight cluster into three further hierarchy
levels:
H
2
: airports/cities in the same country as d,
H
3
: airports/cities on the same continent as d, and
H
4
: all other reachable worldwide airports/cities.
As tags we chose either airport names, the pro-
vided IATA codes,
4
or the corresponding city names.
In this scenario, font size encodes the inverse geo-
graphical distance between the departure airport d =
{lat
d
, lon
d
} and an arrival airport a = {lat
a
, lon
a
}. To
keep the deviation to the actual distance as small as
4
http://www.iata.org/services/pages/codes.aspx
IVAPP 2016 - International Conference on Information Visualization Theory and Applications
24
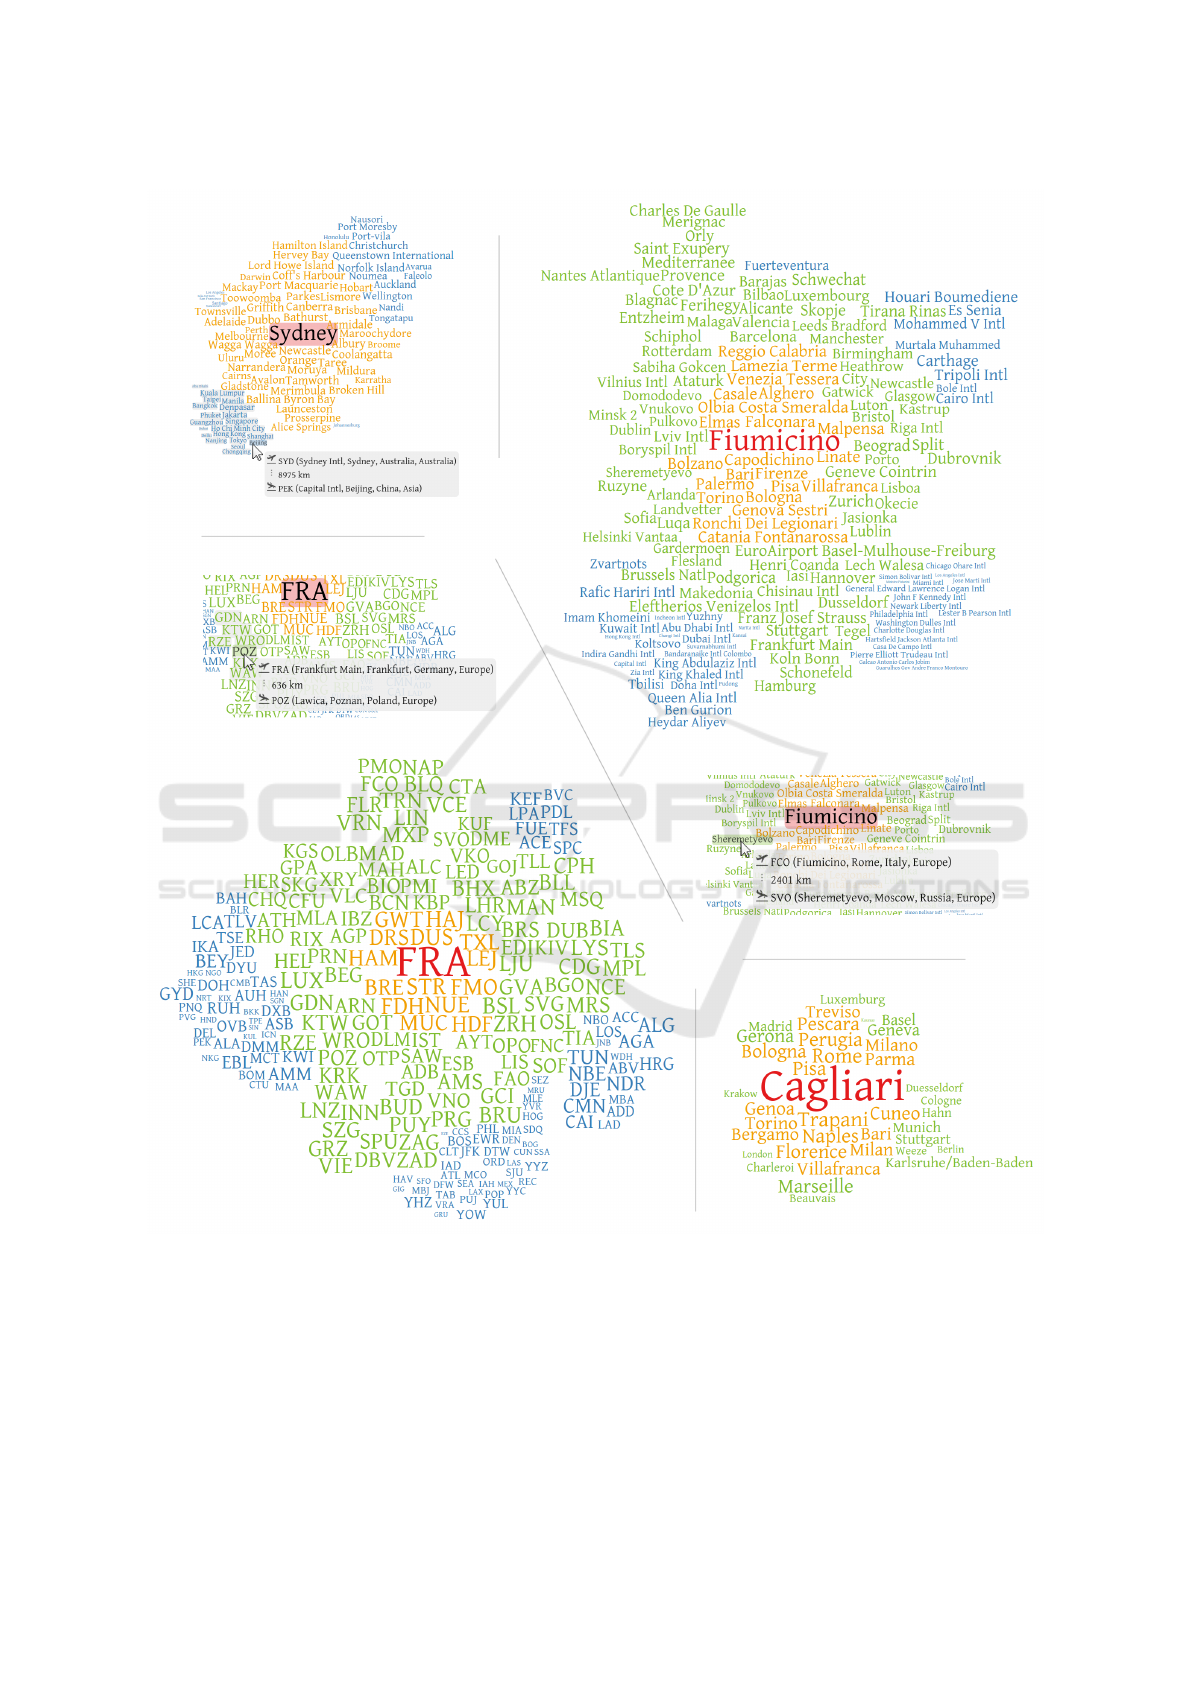
Figure 9: Direct flight connections from airports in Sydney, Rome, Frankfurt and Cagliari.
G = 6378 · arccos
sin(lat
d
) · sin(lat
a
) + cos(lat
d
) · cos(lat
a
) · cos(lon
d
− lon
a
)
(1)
possible, we apply the great circle distance G (Head,
2003), defined by Equation 1. Predecessor tags are
used to place airports or cities of the same country or
continent closely. For a tag t to be placed on H
3
, we
choose the first placed tag with the same associated
country as predecessor, if existent; for H
4
, we choose
the first placed tag with the same associated continent.
Thus, a predecessor tag p(t) in this scenario always
TagSpheres: Visualizing Hierarchical Relations in Tag Clouds
25

belongs to the same hierarchy level as t.
Figure 9 shows TagSpheres for non-stop flights
from various airports or cities. All examples show
that airports/cities of the same countries/continents
are placed closely in clusters. For Sydney, no tags
are placed on H
3
, and for Cagliari, no connections to
airports outside Europe exist. When the user hovers a
tag, the corresponding connection and the travel dis-
tance are shown in a tooltip. Clicking a tag redirects
to Google Flights
5
listing possible flight connections.
5 DISCUSSION
The original motivation to design TagSpheres was to
support humanities scholars in analyzing the clause
functions of a search terms’ co-occurrences (see Sec-
tion 4.1 for details). Some aspects of evaluating the
design during the corresponding eXChange project
are outlined below. Furthermore, we discuss general
limitations of TagSpheres.
5.1 Evaluation
To ensure creating a valuable interface for our tar-
geted user group, we closely collaborated with the hu-
manities scholars in the design phase aiming to trans-
form their notion of hierarchical distance as appropri-
ate as possible. This included project workshops and
regular meetings, where we demonstrated current pro-
totypes, and the humanities scholars were able to sug-
gest their ideas on the design, the interactivity and the
embedding of TagSpheres into their research environ-
ment. Finally, we conducted a small evaluation with
seven humanities scholars (five female, two male) –
five of them were members of the eXChange project.
Due to that small number of participants, diversified
research interests and the exploratory nature of the
humanities scholars’ tasks, a formal user study with
performance data was not viable. To encourage the
participants to intensely work with TagSpheres, we al-
lowed them to query the database with terms of their
own interest (preference data). A survey on close and
distant reading visualizations designed for humanities
scholars discusses in detail that quantitative, system-
atic evaluations are hardly realizable in digital human-
ities projects (J
¨
anicke et al., 2015b).
In a questionnaire, we asked the humanities schol-
ars for subjective ratings on several aspects concern-
ing TagSpheres. They needed to choose a value on a
Likert scale from 1 (very bad) to 7 (very good), and
we also asked them to justify their decisions. The re-
sults are shown in Figure 10.
5
https://www.google.com/flights/
Before developing TagPies (J
¨
anicke et al., 2015a),
we performed a case study on state-of-the-art tag
clouds where we found out that the aesthetics of tag
clouds plays an important role for humanities schol-
ars. The aesthetics of TagSpheres was generally per-
ceived as good. Very important for us were the opin-
ions of humanities scholars if our design would intu-
itively transmit their notion of hierarchical distance.
Only two scholars were undecided, but four schol-
ars gave the best rate stating that TagSpheres are
“easily understandable.” Especially, the chosen col-
ors “clearly visualize the word distance between co-
occurrences and the search term.” As the tags are
shown in different colors and varying font size, we
further asked for the readability of tags, which was
mostly justified positively. Although the humanities
scholars stated that “all important co-occurrences of
the search term are visible at first glance,” it was hard
for them to detect often closely positioned similar or
related terms on different hierarchy levels. But all par-
ticipants stated that the provided means of interaction
facilitate this task and overall foster the understanding
of the visualization and the explorative analysis of re-
sults. Finally, the utility of TagSpheres to support the
humanities scholars in examining research questions
regarding the clause functions of a search terms’ co-
occurrences was also rated as good.
5.2 Limitations
The main objective of the presented layout algo-
rithm is to combine a hierarchical information of tex-
tual data with the aesthetics of tag clouds. In con-
trast to the usual approach to always initialize an
Archimedean spiral at the tag cloud origin (0, 0) when
determining the position of a tag, the usage of prede-
Figure 10: TagSpheres questionnaire results.
IVAPP 2016 - International Conference on Information Visualization Theory and Applications
26

cessor tags as spiral origins slightly affects the uni-
form appearance of the result in some cases (e.g., see
Figure 9). Occasionally, little holes occur, and – at
the expense of visualizing the hierarchical structure
of the underlying data – the tag cloud boundaries get
distorted.
The proposed hot-cold color map used to visu-
ally convey hierarchical distance generates well dis-
tinguishable colors when the number of hierarchy lev-
els is small. For a larger number of hierarchies as dis-
played in Figure 7, closely positioned tags of differ-
ent levels may become visually indistinct, especially
when only few tags belong to a certain level.
The current TagSpheres design does not take the
distribution of tags throughout different hierarchy lev-
els into account. In use cases with a steadily increas-
ing or decreasing number of tags per hierarchy level
it gets possible that a considerable proportion of the
color maps’ bandwidth is used for a comparatively
small portion of tags. An assignment of colors tak-
ing the density distribution of the tags’ weights into
account could overcome this issue.
6 CONCLUSION
We introduced TagSpheres that arrange tags on sev-
eral hierarchy levels to transmit the notion of hierar-
chical distance in tag clouds. We accentuate relation-
ships between different hierarchy levels by placing hi-
erarchically related tags closely. Applied within a dig-
ital humanities project, the design of TagSpheres was
evaluated as aesthetic and intuitive, and the humani-
ties scholars emphasized the utility of TagSpheres for
their work. Further usage scenarios in sports and avi-
ation outline the inherence of hierarchical textual in-
formation in various domains and the usefulness of
TagSpheres as they provide an interesting view on this
type of data.
Despite few listed limitations, TagSpheres might
be applicable to a multitude of further research ques-
tions from other areas. Also imaginable is the combi-
nation of TagSpheres and TagPies to support the com-
parative analysis of different textual summaries with
hierarchical information.
ACKNOWLEDGEMENTS
The authors thank Judith Blumenstein for preparing
the digital humanities usage scenario. This research
was funded by the German Federal Ministry of Edu-
cation and Research.
REFERENCES
Barth, L., Kobourov, S., and Pupyrev, S. (2014). Experi-
mental Comparison of Semantic Word Clouds. In Ex-
perimental Algorithms, volume 8504 of Lecture Notes
in Computer Science, pages 247–258. Springer Inter-
national Publishing.
Bateman, S., Gutwin, C., and Nacenta, M. (2008). Seeing
Things in the Clouds: The Effect of Visual Features
on Tag Cloud Selections. In Proceedings of the Nine-
teenth ACM Conference on Hypertext and Hyperme-
dia, HT ’08, pages 193–202. ACM.
Burch, M., Lohmann, S., Beck, F., Rodriguez, N., Di Sil-
vestro, L., and Weiskopf, D. (2014). RadCloud: Vi-
sualizing Multiple Texts with Merged Word Clouds.
In Information Visualisation (IV), 2014 18th Interna-
tional Conference on, pages 108–113.
Castell
`
a, Q. and Sutton, C. (2014). Word Storms: Multi-
ples of Word Clouds for Visual Comparison of Docu-
ments. In Proceedings of the 23rd International Con-
ference on World Wide Web, WWW ’14, pages 665–
676. ACM.
Chi, M., Lin, S., Chen, S., Lin, C., and Lee, T. (2015).
Morphable Word Clouds for Time-Varying Text Data
Visualization. Visualization and Computer Graphics,
IEEE Transactions on, 21(12):1415–1426.
Collins, C., Vi
´
egas, F., and Wattenberg, M. (2009). Par-
allel Tag Clouds to explore and analyze faceted text
corpora. In Visual Analytics Science and Technology,
2009. VAST 2009. IEEE Symposium on, pages 91–98.
Cui, W., Wu, Y., Liu, S., Wei, F., Zhou, M., and Qu, H.
(2010). Context preserving dynamic word cloud vi-
sualization. In Pacific Visualization Symposium (Paci-
ficVis), 2010 IEEE, pages 121–128.
Deleuze, G. and Guattari, F. (1992). Tausend Plateaus.
Kapitalismus und Schizophrenie II. Merve Verlag.
Diakopoulos, N., Elgesem, D., Salway, A., Zhang, A., and
Hofland, K. (2015). Compare Clouds: Visualizing
Text Corpora to Compare Media Frames. In Proc. of
IUI Workshop on Visual Text Analytics.
Harrower, M. and Brewer, C. A. (2003). ColorBrewer.org:
An Online Tool for Selecting Colour Schemes for
Maps. The Cartographic Journal, 40(1):27–37.
Head, K. (2003). Gravity for Beginners. University of
British Columbia, 2053.
Hearst, M. and Rosner, D. (2008). Tag Clouds: Data Anal-
ysis Tool or Social Signaller? In Hawaii International
Conference on System Sciences, Proceedings of the
41st Annual, pages 160–160.
J
¨
anicke, S., Blumenstein, J., R
¨
ucker, M., Zeckzer, D., and
Scheuermann, G. (2015a). Visualizing the Results
of Search Queries on Ancient Text Corpora with Tag
Pies. Digital Humanities Quarterly. To appear.
J
¨
anicke, S., Franzini, G., Cheema, M. F., and Scheuermann,
G. (2015b). On Close and Distant Reading in Digi-
tal Humanities: A Survey and Future Challenges. In
Borgo, R., Ganovelli, F., and Viola, I., editors, Eu-
rographics Conference on Visualization (EuroVis) -
STARs. The Eurographics Association.
TagSpheres: Visualizing Hierarchical Relations in Tag Clouds
27

Jo, J., Lee, B., and Seo, J. (2015). WordlePlus: Expanding
Wordle’s Use through Natural Interaction and Anima-
tion. Computer Graphics and Applications, IEEE.
Lee, B., Riche, N., Karlson, A., and Carpendale, S. (2010).
SparkClouds: Visualizing Trends in Tag Clouds. Visu-
alization and Computer Graphics, IEEE Transactions
on, 16(6):1182–1189.
Liu, X., Shen, H.-W., and Hu, Y. (2014). Supporting mul-
tifaceted viewing of word clouds with focus+context
display. Information Visualization.
Lohmann, S., Heimerl, F., Bopp, F., Burch, M., and Ertl, T.
(2015). ConcentriCloud: Word Cloud Visualization
for Multiple Text Documents. In 19th International
Conference on Information Visualisation.
Lohmann, S., Ziegler, J., and Tetzlaff, L. (2009). Compari-
son of Tag Cloud Layouts: Task-Related Performance
and Visual Exploration. In Human-Computer Interac-
tion - INTERACT 2009, volume 5726 of Lecture Notes
in Computer Science, pages 392–404. Springer Berlin
Heidelberg.
Milgram, S. and Jodelet, D. (1976). Psychological Maps of
Paris. Environmental Psychology, pages 104–124.
Murugesan, S. (2007). Understanding Web 2.0. IT Profes-
sional, 9(4):34–41.
Nguyen, D. Q., Tominski, C., Schumann, H., and Ta, T. A.
(2011). Visualizing Tags with Spatiotemporal Refer-
ences. In Information Visualisation (IV), 2011 15th
International Conference on, pages 32–39.
Paulovich, F. V., Toledo, F., Telles, G. P., Minghim, R.,
and Nonato, L. G. (2012). Semantic Wordification of
Document Collections. In Computer Graphics Forum,
volume 31, pages 1145–1153. Wiley Online Library.
Schrammel, J. and Tscheligi, M. (2014). Patterns in the
Clouds - The Effects of Clustered Presentation on Tag
Cloud Interaction. In Building Bridges: HCI, Visu-
alization, and Non-formal Modeling, Lecture Notes
in Computer Science, pages 124–132. Springer Berlin
Heidelberg.
Seifert, C., Kienreich, W., and Granitzer, M. (2011). Visu-
alizing Text Classification Models with Voronoi Word
Clouds. In Proceedings of the International Confer-
ence Information Visualisation (IV), London.
Seifert, C., Kump, B., Kienreich, W., Granitzer, G., and
Granitzer, M. (2008). On the Beauty and Usability
of Tag Clouds. In Information Visualisation, 2008. IV
’08. 12th International Conference, pages 17–25.
Shi, L., Wei, F., Liu, S., Tan, L., Lian, X., and Zhou,
M. (2010). Understanding text corpora with multiple
facets. In Visual Analytics Science and Technology
(VAST), 2010 IEEE Symposium on, pages 99–106.
Shneiderman, B. and Plaisant, C. (1998). Treemaps for
space-constrained visualization of hierarchies.
Sinclair, J. and Cardew-Hall, M. (2008). The folksonomy
tag cloud: when is it useful? Journal of Information
Science, 34(1):15–29.
Vi
´
egas, F., Wattenberg, M., and Feinberg, J. (2009).
Participatory Visualization with Wordle. Visualiza-
tion and Computer Graphics, IEEE Transactions on,
15(6):1137–1144.
Vi
´
egas, F., Wattenberg, M., van Ham, F., Kriss, J., and
McKeon, M. (2007). ManyEyes: a Site for Visual-
ization at Internet Scale. Visualization and Computer
Graphics, IEEE Transactions on, 13(6):1121–1128.
Vi
´
egas, F. B. and Wattenberg, M. (2008). TIMELINES:
Tag Clouds and the Case for Vernacular Visualization.
interactions, 15(4):49–52.
Waldner, M., Schrammel, J., Klein, M., Kristj
´
ansd
´
ottir, K.,
Unger, D., and Tscheligi, M. (2013). FacetClouds:
Exploring Tag Clouds for Multi-dimensional Data.
In Proceedings of Graphics Interface 2013, GI ’13,
pages 17–24. Canadian Information Processing Soci-
ety.
Wang, J., Zhao, J., Guo, S., North, C., and Ramakrishnan,
N. (2014). ReCloud: Semantics-based Word Cloud
Visualization of User Reviews. In Proceedings of the
2014 Graphics Interface Conference, GI ’14, pages
151–158. Canadian Information Processing Society.
Ware, C. (2013). Information Visualization: Perception for
Design. Elsevier.
Weskamp, M. (2015). Newsmap. http://newsmap.jp/ (Re-
trieved 2015-11-15).
Wu, Y., Provan, T., Wei, F., Liu, S., and Ma, K.-L. (2011).
Semantic-Preserving Word Clouds by Seam Carving.
In Computer Graphics Forum, volume 30, pages 741–
750. Wiley Online Library.
IVAPP 2016 - International Conference on Information Visualization Theory and Applications
28
