
Support for the Inclusion of Domain Knowledge in Prediction Models
User Evaluations of a Tool for Generating Prediction Models for Serious Adverse
Events in Oncology
Monique Hendriks
Philips Research, High-tech Campus 34, Eindhoven, The Netherlands
Keywords: Clinical Decision Support Tools, Clinical Prediction Modeling, Inclusion of Domain Knowledge, User
Interface Design, User Evaluation, Data Visualization.
Abstract: As healthcare is becoming more personalized, prediction models have become an important tool for decision
support. In order to create sensible, understandable and useful prediction models, it is often necessary to
include domain knowledge. This requires multi-disciplinary communication which has proven to be difficult,
as the different parties involved are not always aware of each other’s information needs. This paper presents
the design process of a tool which supports the communication between clinical experts and data mining
experts. Interviews and user tests were executed on four different sites and with 14 different users from both
domains. The results from these user tests confirm the need for support on the communication process and
provide evidence that the tool presented here indeed provides support by helping both parties to understand
each other’s information needs. The tool provides a graphical user interface which guides the users through
the steps required to create a prediction model. The graphical user interface helps the clinical expert to
understand the choices to be made which rely on his/her expertise, while the fact that a ‘quick-and-dirty’ first
version of a prediction model is generated in the process, helps the data mining expert to uncover all formal
requirements for the model.
1 INTRODUCTION
As healthcare is becoming more and more
personalized, prediction models have become an
important tool for decision support. In order to create
sensible, understandable and useful prediction
models, it is often necessary to include domain
knowledge. Clinical expertise is needed in order to
clarify which outcome variable is of interest, which
features should be included in the model, to uncover
possible confounding factors, etc.
Inclusion of clinical domain knowledge requires
two experts from different domains to communicate,
namely a clinical expert who has knowledge of the
data set and a data mining expert. Such
interdisciplinary communication has proven to be
difficult, as both parties are not always aware of each
other’s information needs. The process of creating
prediction models is therefore often burdened with
the need for multiple sessions where the data mining
expert and the domain expert sit together and adapt
their current perspective on the requirements for the
model.
To facilitate the interdisciplinary communication
process and to reduce the time and effort required for
both parties to uncover the requirements for the
envisioned model, we have developed a prototype
tool aimed at users from both domains. The tool
supports a discussion session where a data mining
expert and a clinical domain expert generate a ‘quick-
and-dirty’ first version of a prediction model, to
ensure that all requirements from the clinical domain
have been made explicit. The tool instantly generates
a model based on the given requirements, such that
the clinical domain expert can review the model and
has a concrete perspective on how the model could be
applied in practice. The data mining expert can then
continue to work on the model using his own domain
knowledge to fine tune it.
The prototype is aimed at the oncology domain
and specifically at prediction models for Serious
Adverse Events (SAEs). However, the principles
Hendriks, M.
Support for the Inclusion of Domain Knowledge in Prediction Models - User Evaluations of a Tool for Generating Prediction Models for Serious Adverse Events in Oncology.
DOI: 10.5220/0005656201830188
In Proceedings of the 9th International Joint Conference on Biomedical Engineering Systems and Technologies (BIOSTEC 2016) - Volume 5: HEALTHINF, pages 183-188
ISBN: 978-989-758-170-0
Copyright
c
2016 by SCITEPRESS – Science and Technology Publications, Lda. All rights reserved
183
applied may be useful in other healthcare domains as
well.
The development process of the SAE prediction
tool is steered by evaluations with potential end users
of both domains. This iterative development process
helps us to obtain more fine-grained requirements
regarding useful features and the design of the user
interface in each cycle. The evaluations consist of
interviews with users regarding their current way of
working and issues they run into as well as a guided
execution of a representative task. This paper presents
the results of the first sets of user evaluations.
2 BACKGROUND
The work presented here is part of the EURECA
project (www. http://eurecaproject.eu/) and builds on
the framework developed within this project. The
goal of the EURECA project is to integrate data from
research and clinical practice such that the integrated
data can be leveraged upon, among others, to derive
new knowledge or to find support for existing
hypotheses. The EURECA framework supports
uniform and secure access to the data and tools have
been built to query the data.
The SAE Prediction tool is the result of a scenario
based on a concrete need of one of the clinical
partners in the project, a university hospital’s
paediatric oncology department. The scenario asked
for the analysis of relations between patient and
treatment characteristics and the SAE Veno-
Occlusive Disease (VOD). While discussing this
scenario, it became clear that this sort of inquiries for
data analysis were made more often, but it was
difficult to find the resources to do the data analysis.
The tools used for data analysis at this site were
Excel, Access and SQL and SPSS. The obstacles that
were encountered when doing data analysis using
these tools ranged from difficulties in extracting the
right data, in understanding the data model, to making
sure that there were no mistakes in e.g. the SQL
queries and that the right methods were applied in
SPSS. The site has no dedicated data analysis experts.
3 THE SAE PREDICTION TOOL
The SAE prediction tool is a prototype supporting
domain experts and data mining experts to clarify the
requirements for a prediction model in one session,
where they use the tool to generate a ‘quick-and-
dirty’ first version of a prediction model. This first
version will ensure that the data mining experts is
aware of all requirements for the model, allowing
him/her to work alone to improve the model, without
having to confer with the clinical expert.
The tool uses the EURECA framework (Medina
et al., 2014) for uniform access to heterogeneous,
multisource data. Due to the EURECA common data
model and the uniform access tools, the SAE
prediction tool can provide a set of generic operations
on the data in order to obtain a prediction model for
any SAE and any set of features recorded in the data.
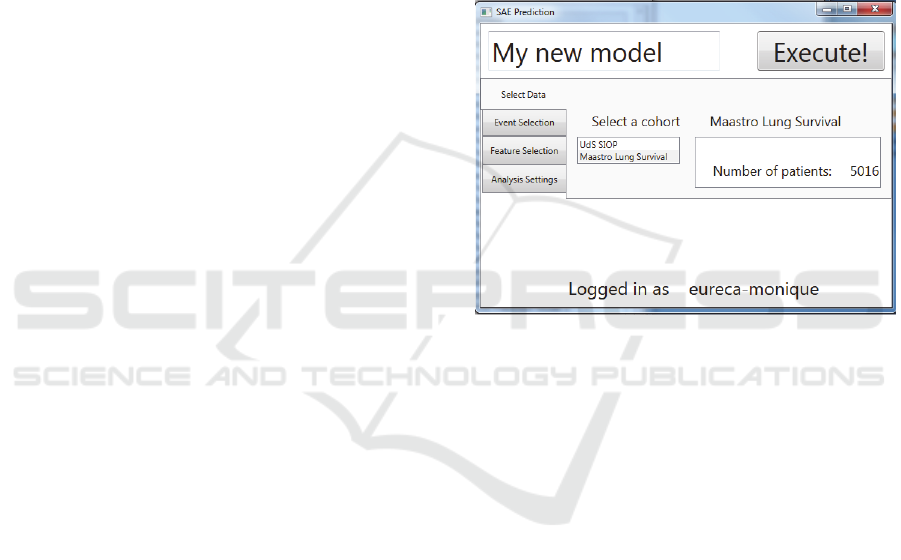
The tool guides the user through the process of
creating a prediction model in four steps: selection of
Figure 1: Screenshot of the SAE Prediction tool. Selection
of the data set.
the data set (Figure 1), selection of the SAE (the
outcome variable), feature selection and specific
analysis settings.
For each included feature, the required pre-
processing to be undertaken should be discussed with
the domain expert. E.g. date of birth should be
converted to age at time of treatment, continuous
scale variables can be discretized, missing values may
be imputed, etc. The tool provides a number of basic
pre-processing options. These methods can be applied
to the data set directly and a preview of the result is
shown to the users (see Figure 2 and Figure 3).
Once all requirements for the prediction model are
provided, the tool will generate a first version of the
model, as shown in Figure 4. The model can be
applied to different patients, in order to explore its
applicability, as shown in Figure 5.
A detailed description of the tool is available in
(Hendriks et al., 2014).
HEALTHINF 2016 - 9th International Conference on Health Informatics
184
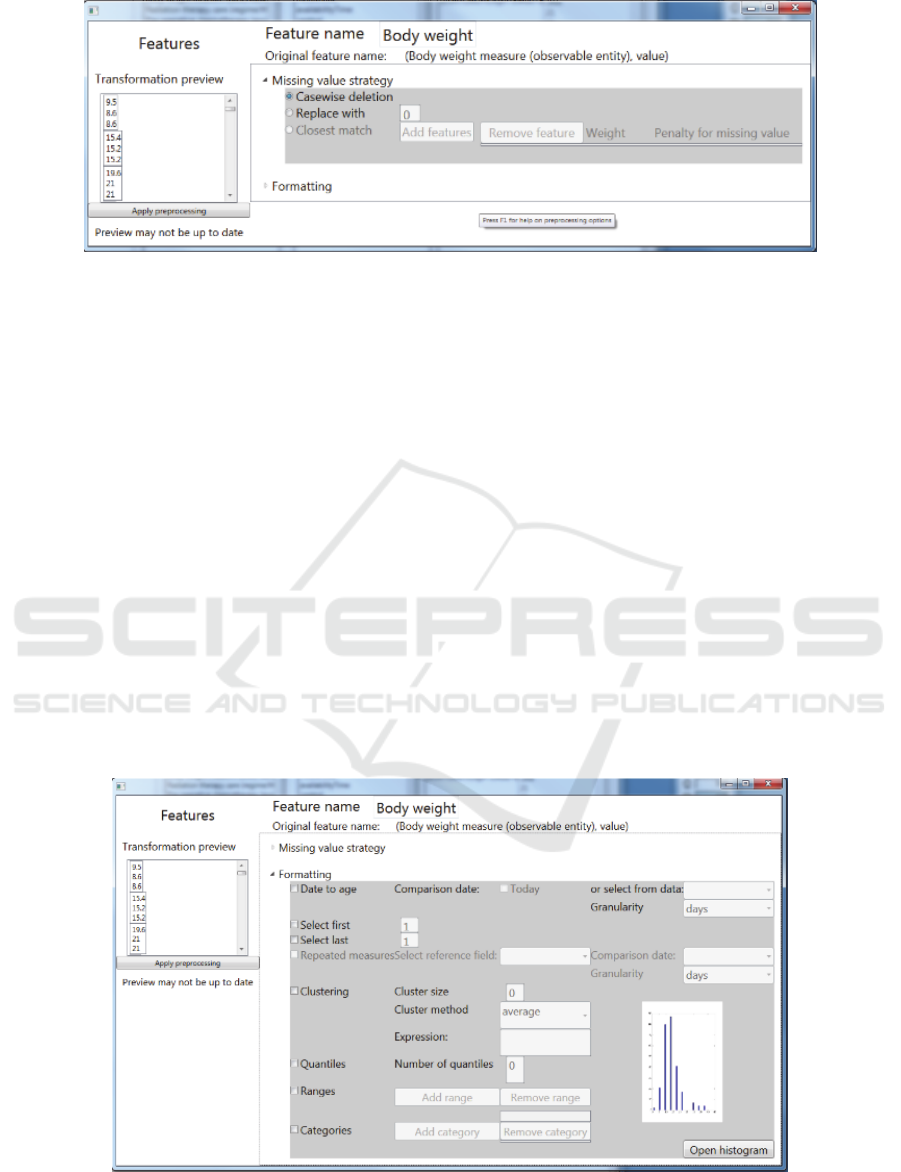
Figure 2: Screenshot of the SAE Prediction tool. Selection of a missing value strategy.
4 PROTOCOL AND
PARTICIPANTS
Two different versions of the tool have been
evaluated at four sites and with 14 potential end users
from both domains (data mining experts as well as
clinical experts). Table 1 lists the participants, their
relevant domain knowledge and the site at which they
are located. The first version of the tool has been
discussed in informal, unstructured interviews with
four potential end-users at three different sites. The
second version has been evaluated in a think aloud
protocol. This protocol consisted of a short
description of a use case and a description of the steps
to be taken in order to define a prediction model for
this use case. The use case was based on a data set
acquired during a trial testing the effectiveness of
different treatment protocols for Wilm’s tumor. The
users were asked to use the tool to construct a
prediction model for the adverse event Veno-
occlusive disease (VOD). The prediction model
should include censors for premature end of treatment
(lost to follow-up), relapse or death, as these may bias
the results. The features to be included in the model
were the patient’s age and body weight, the location
of the tumor, the location of radiation therapy and the
dosages of chemotherapy drug Actinomycin D. If
necessary, due to the lack of background knowledge
regarding statistics or data mining or due to the lack
of knowledge regarding this specific use case, the
user was guided by the executer of the test. Reports
were written on the way in which the users executed
the test protocol as well as their comments on the
usefulness and usability of the tool. The most
important conclusions from these reports are
summarized in the next section.
Figure 3: Screenshot of the SAE Prediction tool. Selection of pre-processing options.
Support for the Inclusion of Domain Knowledge in Prediction Models - User Evaluations of a Tool for Generating Prediction Models for
Serious Adverse Events in Oncology
185
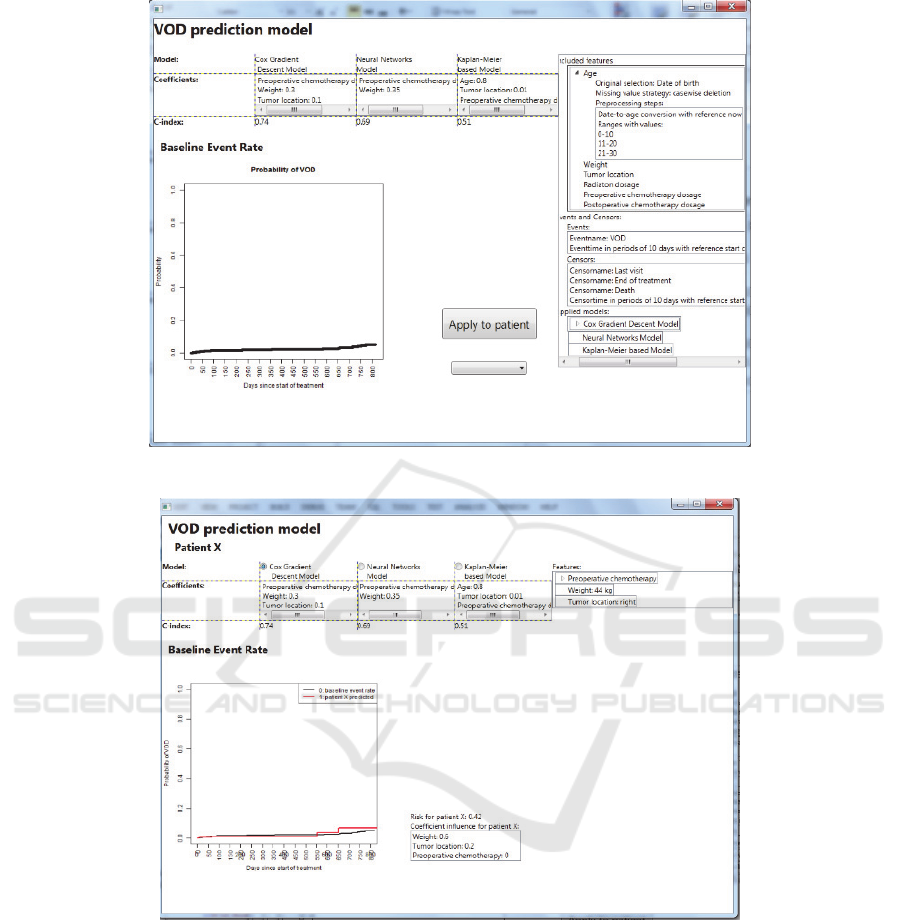
Figure 4: Screenshot of the SAE Prediction tool. The resulting ‘quick-and-dirty’ prediction model.
Figure 5: Screenshot of the SAE Prediction tool. The resulting ‘quick-and-dirty’ prediction model applied to an individual
patient.
5 RESULTS
Here, we present the most important conclusions
from the informal interviews as well as the user tests
conducted on the first and second version of the SAE
prediction tool.
5.1 Informal Interviews
Initially, the tool was intended for use by clinicians
only, enabling them to define prediction models on
their own, which could then be refined by data mining
experts. From the first informal interviews, it was
concluded that this task was too difficult for a non-
expert, even with a specialized graphical user
interface. However, the difficulty of the
communication across the domains of data mining
and clinical knowledge was recognized. All users
indicated that the process often involved a lot of back
and forth between discussing and updating the model
HEALTHINF 2016 - 9th International Conference on Health Informatics
186
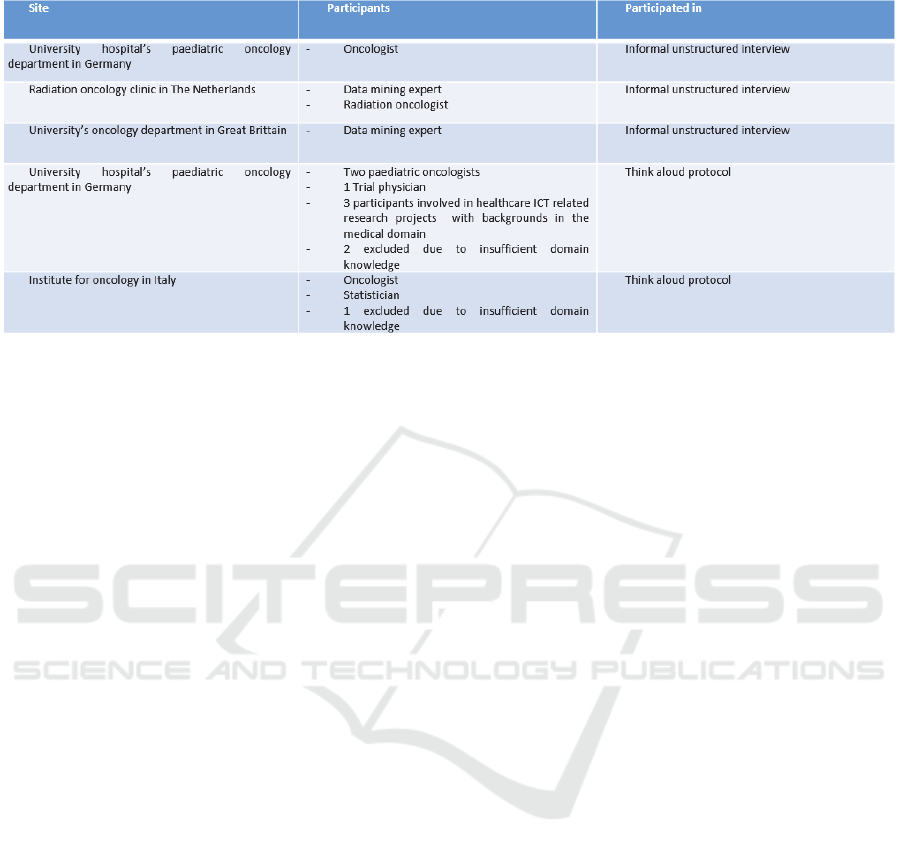
Table 1: Overview of participants to the evaluations of the SAE Prediction Tool.
before arriving at the desired end result. Therefore,
the focus of the development was shifted towards use
of the tool by a clinical expert together with a data
mining expert, the added value of the tool consisting
of a reduction in time and effort required to obtain the
exact formal requirements for a prediction model.
The tool could support this interdisciplinary
communication by allowing the data mining expert to
immediately show the effect of certain choices on the
data set and/or the resulting prediction model and
how it can be applied to new patients.
The two oncologists both indicated that using this
tool would result in an increased understanding of the
model, and therefore in greater trust in the model.
This would mean that use of the tool could increase
the chances of adoption of a prediction model.
The two data mining experts both indicated a need
for data inspection and visualization. If the
distribution of certain features could be shown
instantly, it is easier to discuss pre-processing details,
e.g. strategies for dealing with missing values and
outliers, for discretizing continuous variables, etc,
and also to discuss the possibility of biasing
conditions in the data.
The detailed results of the informal interviews can
be found in EURECA deliverable 6.7 (Huang et al.,
2015).
5.2 Test Protocol
The user tests at the university hospital and the
institute for oncology showed that the tool forces
users to go through all of the steps of defining a
prediction model, including formally defining a goal
variable (the SAE), specifying the predictors and
formally defining the best method for dealing with
missing values and the pre-processing operations
required to create meaningful predictors from
features selected from the data.
The tests showed that the approach supported by
the tool helped bring up the right questions; questions
that would otherwise have been overlooked in a first
discussion between a data mining expert and a
clinical domain expert.
For example, one user with a medical background,
who had some experience in statistics, indicated that
in order to deal correctly with missing values, one
would need to involve a domain expert to make sure
that the reasons values may be missing are clear (i.e.
if values for radiation therapy dosages are missing,
this may also mean that no radiation therapy was
received by the patient), but also someone with a
background in statistics to make sure no bias is
introduced.
Another user, who has a strong medical
background and who was familiar with the data set,
remarked that in this particular case, the value to be
predicted, the occurrence of the SAE veno-occlusive
disease (VOD), should be looked for not only as
recorded VOD events, but also in a combination of
recorded symptoms, because VOD can only be
confirmed with autopsy, so it is not always recorded
as a (suspected) VOD event). He suggested to also
mark patients with abdominal pain,
thrombocytopenia and elevated liver enzymes for
possible VOD events, and even patients with
treatment delay where the stated reason is a suspected
VOD event.
Another user with strong medical background and
familiarity with the data set indicated that if we
wanted to include chemotherapy dosages, it would
make sense to investigate dosages related to a
subsequent VOD event within a time frame of two or
three weeks, as VOD is an acute toxicity. Use of the
tool also triggered this user to be more specific about
Support for the Inclusion of Domain Knowledge in Prediction Models - User Evaluations of a Tool for Generating Prediction Models for
Serious Adverse Events in Oncology
187

his interest in the effect of radiotherapy on the risk for
a VOD event. He was interested in finding out
whether the risk would be increased if radiotherapy
was applied on the right side compared to
radiotherapy applied only to the left side. However,
in order to find out on which side radiotherapy was
applied, one would need to look up first on which side
the tumor was located, because radiation site was only
recorded in terms of whether it was applied only at
the tumor site, at the lymph nodes or on the whole
abdomen.
These results show that the tool was successful in
helping to uncover a larger part of the formal
requirements for a prediction model in a first
discussion with a domain expert.
With respect to future development, it was noted
that all seven users showed an explorative attitude
towards the data. One oncologist indicated that even
to explore his own data, he would currently need the
help of a data mining expert and he found this very
frustrating. The tool already supported him to some
extent to start exploring the data on his own. This
explorative attitude stresses the importance of
investigating other data visualization options, besides
providing histograms for each included feature, such
as visualizations to help explore ranges and units as
well as distributions, and interlinking of features (e.g.
showing body weight and chemotherapy drug doses
in the same graph/table).
It should also be noted that the user interface of
the tool was still quite complicated. This seemed to
be mainly related to the fact that the user interface
does not show the effects of certain actions on the end
result instantaneously; the resulting prediction model
is only shown after filling in all the required
information. Providing more immediate feedback
would improve the usability to a great extent.
Furthermore, the user tests indicated that it is also
very important to invest in a clear (annotated) data
model, from which the meaning of the recorded
values is immediately clear.
Detailed reports of the user tests at the university
hospital and the institute for oncology can be found
in EURECA deliverable 8.5 (Koumakis et al., 2015)
and EURECA deliverable 8.6 (Gleave et al., 2015)
respectively.
6 CONCLUSIONS AND FUTURE
WORK
The first user tests reported here indicate a strong
need for a tool such as the SAE prediction tool
presented here, to help reduce the time and effort
needed to uncover the formal requirements for a
prediction model by supporting the communication
between a data mining expert and a domain expert.
At all sites where the tool was discussed, it was
mentioned that the tools used currently for building
prediction models were too difficult to be used by
non-experts, allowing non-experts only to use verbal
communication with the data mining expert and to
provide feedback on the models once they are
complete.
These tools that are currently used are too
complex for non-experts due to their genericity.
Restricting to the domain of oncology and to
prediction models for SAE’s allowed us to simplify
the process by standardizing the steps and presenting
them in a graphical user interface, so that the domain
expert can understand the process. The use of the
EURECA common data model and the tools for
uniform data access allowed us to create generic
operations on the data, routinely used in data mining
and to include these operations in the graphical user
interface. Including a preview of the effect of an
operation on the data furthers the understanding of the
domain expert of the process involved in generating
the prediction model and helps the data mining expert
to obtain the formal requirements for the model more
quickly.
The first user tests uncovered that future work
should focus on supporting more explorative
functionality as well as providing immediate
feedback of any step in the definition of the prediction
model on the end result.
ACKNOWLEDGEMENTS
The work presented in this paper is partially funded
by the European Commision under the 7
th
Framework
Programme (FP7-ICT-2011-7).
REFERENCES
Hendriks, M., Graf, N., Chen, N, 2014. A Framework for
the Creation of Prediction Models for Serious Adverse
Events. In IEEE International Conference on
Bioinformatics and Biomedicine.
Huang, Z., et. al., 2015. Refined Services, EURECA
deliverable 6.7.
Koumakis, L., et. al., 2015. Report on the evaluation and
validation of the EURECA environment and services,
EURECA deliverable 8.5.
Gleave, R., et. al., 2015, Report on the user workshops at
clinical sites, EURECA deliverable 8.6.
Medina, S. P., et. al., 2014, Initial prototype of the semantic
interoperability framework, EURECA deliverable 4.4.
HEALTHINF 2016 - 9th International Conference on Health Informatics
188
