
Analysis of an Electrocardiographic Multilead System by Means of
Artificial Neural Networks
Study of Repolarization During Premature Ventricular Stimulation
Drago Torkar
1
and Pedro David Arini
2,3
1
Joˇzef Stefan Institute, Jamova Cesta 39, 1000 Ljubljana, Slovenia
2
Instituto de Ingenier´ıa Biom´edica, Facultad de Ingenier´ıa, Universidad de Buenos Aires, Buenos Aires, Argentina
3
Instituto Argentino de Matem´atica, ’Alberto P. Calder´on’ CONICET, Buenos Aires, Argentina
Keywords:
Electrocardiography, Transmural Dispersion, Mapping, ANN, Pacing.
Abstract:
The ventricular repolarization dispersion (VRD) has been shown to increase with premature stimulation.
Moreover, several differences between left ventricular and right ventricular, such as the anatomic properties
and fibrillation threshold have been reported. However, few data exist regarding the influence of the site of
stimulation on modulation of VRD measure by electrocardiographic. In the present work, several ECG indices
of VRD, as a function of the coupling interval and the site of stimulation, were studied in an isolated heart
rabbit preparation (n=18), using ECG multilead (5 rows x 8 columns) system with Artificial Neural Networks.
In both ventricles, results have shown significant decreases in early repolarization duration, while in the left
ventricle we have found significant increases of transmural dispersion. Also, we have observed that when
the premature stimuli were applied to the left ventricle, the ventricular repolarization dispersion changes were
detected using only one preferential electrode (row1-column3). When stimuli were elicited at the right ventri-
cle, changes of VRD were detected by three electrodes (row3-column1, row2-column1 and row3-column8).
Finally, a different ventricular repolarization dispersion was found as a function of the site of stimulation.
1 INTRODUCTION
Heterogeneity of ventricular repolarization is a mea-
sure of nonhomogeneousrecovery of excitability dur-
ing the repolarization phase. This ventricular hetero-
geneity is mainly attributable to differences in activa-
tion times and action potential duration (APD) in dif-
ferent myocardium areas. The APDs differs not only
between cardiac cells of different ventricular layers
(Yan and Jack, 2003) but also between posterior and
anterior endocardial layers, apex and base (Noble and
Cohen, 1978), and left and right ventricles (Di Diego
et al., 1996).
Clinical and experimental studies haveshowna re-
lationship between ventricular repolarization disper-
sion (VRD) and severe ventricular arrhythmia and/or
sudden cardiac death (Surawicz, 1997) (Kuo et al.,
1983). In this way, changes in VRD values that
are higher than normal have been linked with an in-
creased risk of developing reentrant arrhythmias (Han
and Moe, 1964; Shimizu and Antzelevitch, 1998).
Some authors have shown that alterations in VRD
are correlated with changes in the total repolariza-
tion duration (T
RD
) or T-wave width (Fuller et al.,
2000). Our study has also shown that T-wave widen-
ing can result from a differential shortening or length-
ening of the APD in both apex-base and transmural
(Arini et al., 2008). Moreover, the T-wave peak-to-
end (T
PE
) interval has been suggested as a marker
of transmural repolarization dispersion (Antzelevitch
et al., 2007; Smetana et al., 2011), consequently the
interval between the J-point and the T-wave peak po-
sition has been considered as the full repolarization
of epicardium or early repolarization duration (E
RD
).
The translation of these concepts to the standard ECG
is not straightforward, making it difficult the inter-
pretation of the relationship between T-wave peak-to-
end and transmural dispersion in a clinical population
(Smetana et al., 2011).
In this regard, several investigations showed that
premature ventricular stimulation (PVS) produce a
significantly increased of the VRD and that these
changes were markedly associated with an increase
in the induction of ventricular arrhythmias (Kuo
et al., 1985; Rosenbaum et al., 1991; Yuan et al.,
1996). Also, ventricular vulnerability, as evaluated
34
Torkar, D. and Arini, P.
Analysis of an Electrocardiographic Multilead System by Means of Artificial Neural Networks - Study of Repolarization During Premature Ventricular Stimulation.
DOI: 10.5220/0005663200340041
In Proceedings of the 9th International Joint Conference on Biomedical Engineering Systems and Technologies (BIOSTEC 2016) - Volume 4: BIOSIGNALS, pages 34-41
ISBN: 978-989-758-170-0
Copyright
c
2016 by SCITEPRESS – Science and Technology Publications, Lda. All rights reserved

by the ventricular fibrillation threshold technique, was
shown different when studied at the left ventricle (Lv)
or at the right ventricle (Rv). The left ventricular epi-
cardium presented higher fibrillation threshold when
compared with left ventricular endocardium or both
epicardium and endocardium of right ventricular, re-
spectively (Horowitz et al., 1981).
Because a different ventricular fibrillation thresh-
old and differences in the anatomic properties may
exist between both ventricles, we hypothesized that
there also would be differences in the E
RD
, T
PE
and
T
RD
values depending on the site where premature
ventricular stimuli were elicited.
The aims of this work were to: (1) Determine
the preferential electrode, in a multilead ECG system,
to detect changes of ventricular repolarization disper-
sion using Artificial Neural Networks. (2) Evaluate
ECG indices associated to the ventricular repolariza-
tion dispersion depending on the site of pacing during
premature ventricular stimulation.
2 MATERIALS AND METHODS
2.1 Isolated Heart Rabbit Preparation
This study conformed to the Guide for the Care and
Use of Laboratory Animals published by the US Na-
tional Institutes of Health (NIH Publication No. 85-
23, revised 1996). To obtain isolated Langendoff-
perfused rabbit hearts, male New Zealand white rab-
bits of 2.8-3.8 Kg (n = 18) were heparinized (500
U/Kg IV) and anesthetized by the intramuscular in-
jection of a combination of lidocaine (5 mg/Kg) and
ketamine (35 mg/Kg). The rabbits were euthanized
by cervical dislocation. The chest was opened via a
median sternotomy and, immediately, the heart was
removed with scissors and immersed in cold Ty-
rode’s solution. After the remaining connective tis-
sue, lungs, and pericardium were removed, the heart
was placed in a vertical Langendorff device through
cannulation of the aorta. Time from chest opening
to cannulation of the aorta oscillated between 2 to 3
minutes. The heart was retrogradely perfused through
the aorta with Tyrode’s solution and immersed in a
tank filled with the same solution (Zabel et al., 1995).
The temperature of both solutions were maintained
at 38
o
± 0.5
o
C and bubbled with O
2
using a flow of
700-900 ml/h at a pressure of 70 mmHg. To regulate
the flow rate of the aortic perfusion, a variable speed
roller pump (Extracorporeal, 2102 Infusion Pump)
was used. Care was taken to fix the hearts in the same
position by alignment of the left anterior descending
coronary artery (LAD) with the electrode matrix ref-
erence system on the tank (see Figure 1).
The composition of Tyrode’s solution was (in mM):
140 NaCl, 5 KCl, 1 MgCl
2
, 0.33 NaH
2
PO
4
, 5 Hepes,
11.1 glucose and 2 CaCl
2
. The pH was adjusted to
7.4 using NaOH. The sinus node was destroyed by
applying radiofrequencyenergy through a customized
device.
The artificial pacemaker was a rectangular pulse
that had a 2 ms duration and twice the diastolic thresh-
old stimuli amplitude. In the premature ventricular
stimulation (PVS) experimental protocol, the bipo-
lar pacing electrodes made of Teflon-coated stainless-
steel wires were positioned in the middle of the base
of each ventricle, belowthe auricle appendage(Figure
1). To ensure stability in the preparation, the heart ac-
tivity was monitored for 30 min to determine that the
heart was arrhythmia-free, stable in amplitude, and
had no manifest ischemia. We used an In Vitro rab-
bit heart model because it provides advantages such
as a high level of experimental reproducibility, has a
greater throughput compared to complicated in vivo
models, provides a better evaluation over a range of
concentrations and different combinations of drugs to
be tested. In addition, it can be manipulated to mimic
clinical conditions, such as hypokalemia and brady-
cardia that support these comments. Also, it has been
well established that with PVS beats (Laurita et al.,
1998) a significant increase in ventricular repolariza-
tion dispersion is induced.
2.2 Thorax Rabbit Model
The experimental model consisted of the In Vitro sys-
tem, which used a multiple recording system to obtain
the beat-to-beat electrical activity of isolated rabbit
heart. The PVS protocol used a circular tank (diam-
eter = 7 cm, height = 7 cm) that had 40 silver-silver
chloride electrodes (diameter = 2 mm) distributed ho-
mogeneously within an array of 5 rows and 8 columns
(see Figure 1). The distance between electrodes was
10 mm and the angular distance was 45
o
. The dimen-
sions of the tank simulated a rabbit’s thorax. Four ad-
ditional electrodes were allocated in an “Einthoven-
like” configuration (Figure 1). Two of them were po-
sitioned on the base of the tank and the other two were
on the upper left and right side of the tank wall and
served as arm electrodes. The four electrodes were
designed to build the electrical reference by configur-
ing the Wilson Central Terminal.
2.3 Experimental Protocol
In this study VRD was modified by premature ventric-
ular stimulation. Due to heterogeneous distribution
Analysis of an Electrocardiographic Multilead System by Means of Artificial Neural Networks - Study of Repolarization During Premature
Ventricular Stimulation
35
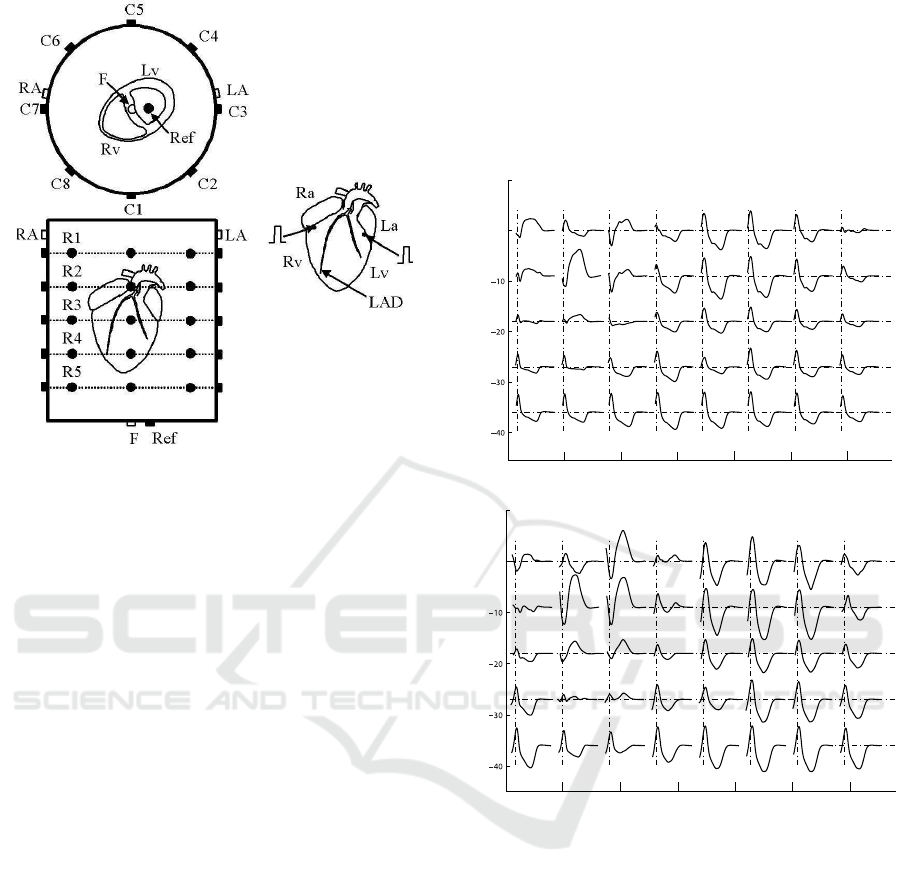
Figure 1: ECG multilead system: 40-electrodes configu-
ration for electrocardiographic recording in the premature
ventricular stimulation protocol. Schematic view showing
the superior and frontal 5× 8 matrix electrodes, as well as
the standard lead foot (F), left arm (LA), right arm (RA),
and reference (Ref). Also are shown the positions of both
the stimulating electrodes located in the base of the Lv and
Rv, below the atrial appendages.
of APD lengthening induced by potassium-channel
blocking drugs (Zabel et al., 1997; Spear and Moore,
2000) or the heterogeneous shortening of APD caused
by the heterogeneous distribution of restitution kinet-
ics (Laurita et al., 1998), a real increase in VRD phe-
nomena can be obtained. Besides, it can be noted that
we measured the increase in VRD, not dispersion as
an absolute value, so our gold standard was the same
heart in the control condition in each experiment.
In the PVS protocol, the heart was stimulated from
the right ventricle (Rv) or left ventricle (Lv) at basal
frequency during a train (S1) of 49 beats. After that
train, at beat number 50
th
, a premature beat was gen-
erated at a coupling interval that corresponded to the
Effective Refractory Period (E
rp
) plus 5 ms. In each
case, E
rp
was estimated prior to the PVS application.
To estimate E
rp
, premature coupling intervals (dis-
tance from the last beat to the premature stimulation
time) were diminished step by step at 5 ms until pe-
riod refractoriness was reached. We used the average
of 48
th
and 49
th
beats from each S1 as control. The
premature beat (50
th
) was elicited to generate VRD
paced either at Rv or Lv. During the protocol, the
heart was paced using an artificial pacemaker (DTU
101, Bloom Associates Ltd. Reading, PA, USA).
In the PVS protocol (n = 18), the hearts were
paced from the Rv (n = 9) or the Lv (n = 9) by stim-
uli trains at a basic cycle length of 430 ms for con-
trol condition. Then, single premature stimuli were
applied after a pulse train at a frequency equal to
E
rp
+5 ms (167±7.2 ms for Rv stimulation (RVS) and
168±11.5 ms for Lv stimulation (LVS); p value =
NS).
0 500 1000 1500 2000 2500 3000
0
10
row 1
row 2
row 3
row 4
row 5
column
1
column
2
column
3
column
4
column
5
column
6
column
7
column
8
Time (ms)
Amplitude (mV)
0 500 1000 1500 2000 2500 3000
0
10
row 1
row 2
row 3
row 4
row 5
column
1
column
2
column
3
column
4
column
5
column
6
column
7
column
8
Time (ms)
Amplitude (mV)
Figure 2: 40 ECG recordings from the control situation (top
panel) and their respective E
rp
+5 ms (bottom panel) during
PVS from the left ventricle. The stimulating electrode was
located at the base of the left ventricle.
2.4 Acquisition of ECGs Signals
ECG data were recorded using instrumentation am-
plifiers that had a gain factor of 1000 and a band-
width of 0.05-300 Hz. The signals were digitalized
at a sampling rate f
s
= 1 KHz and 12-bit resolution
using a digital acquisition board (Lab PC+, National
Instruments, Austin, TX, USA). When necessary, a
band-stop filter was used to remove 50-Hz. The base-
line movement was compensated using a cubic spline
(Meyer and Keiser, 1977) algorithm. All of the data
were acquired and monitored using customized soft-
ware made in C++.
BIOSIGNALS 2016 - 9th International Conference on Bio-inspired Systems and Signal Processing
36

2.5 Construction of Data Matrix
The ECGs from the first row of leads were recorded
simultaneously, and the same procedure was applied
sequentially to the remaining rows. The i
th
beat was
selected in the ECG recordings of each r
th
row, r =
1, .. . , 5, obtaining the i
th
r
beat. After selecting and seg-
menting the i
th
r
beat from each row, a signal, x
c,r
(n),
n = 0, . . . , N − 1, was determined for each channel
characterized by the (c, r) pair, where c is the column
in the electrode matrix (c = 1, . . . , 8) and r is the row.
, being M = 5× 8 the number of register electrodes in
each experimental protocol, respectively. Expressing
that signal as a vector, x
c,r
, we obtain
x
c,r
= [x
c,r
(0), . . . , x
c,r
(N − 1)]
T
(1)
The five i
th
r
selected beats were aligned using the
QRS complex maximum upstroke slope. The beats
extend a time window composed of N samples cor-
responding to 400 ms, and include the repolariza-
tion phase. For each experimental condition (con-
trol and E
rp
+5 ms), recordings were obtained from 40
ECG leads for the experimental protocol. Expressing
in matrix notation the selected segmented signals, X
(M × N), we obtain
X = [x
1,1
, . . . , x
L,1
, . . . , x
1,5
, . . . , x
L,5
]
T
(2)
From X, the ECG-derivedparameters were measured.
A matrix X characterize each experimental condition.
2.6 ECG Indices
The QRS fiducial points (QRS
ON
and QRS
END
) and T-
wave location (T
END
, T
PEAK
) were obtained from the
ECG delineation system based on the Wavelet Trans-
form (Mendieta, 2012). Also, ECG indices have been
computed to describe the characteristics of VRD on
the electrocardiographic multilead system. For each
i
th
beat, we have computed as:
1) Ventricular depolarization index: the Q
RS
in-
terval measured in milliseconds from the onset of the
Q wave to the offset of the S wave, has been calcu-
lated as;
Q
RS
i
= QRS
END
i
− QRS
ON
i
(3)
2) Total ventricular repolarization duration index
(measured in milliseconds): the T
RD
quantifying the
total ventricular repolarization time, has been com-
puted as;
T
RD
i
= T
END
i
− QRS
END
i
(4)
3) Early repolarization duration index (measured
in milliseconds): the E
RD
which several authors have
linked to the full repolarization of epicardium, has
been calculated as;
E
RD
i
= T
PEAK
i
− QRS
END
i
(5)
4) T-wave peak-to-end interval index (measured in
milliseconds): the T
PE
associated to transmural ven-
tricular repolarization (Antzelevitch et al., 2007), has
been computed as;
T
PE
i
= T
END
i
− T
PEAK
i
(6)
2.7 Artificial Neural Network
The measured ECG indices depend on the premature
coupling interval between S1 pulse train and the pre-
mature beat. The question is, if it is possible to rec-
ognize the coupling interval from ECG values, or in
other words how successfully we can separate ECG
indices values corresponding to E
rp
+5 ms coupling
interval from those corresponding to control stimu-
lation. Furthermore, we wanted to know the signals
from which electrodes can be most successfully clas-
sified, since this would indicate the preferential elec-
trode positions in the tank (thorax rabbit model) most
suitable to perform measurements. There were 572
samples from 9 rabbit hearts (63.5 samples/heart) for
Lv stimulation (LVS) and 535 samples also from 9
rabbit hearts (59.4 samples/heart) for Rv stimulation
(RVS) available. The data was reasonably balanced
with 50.87% E
rp
+5 ms and 49.13% control samples
in Lv stimulation data, and 48.22% E
rp
+5 ms and
51.78% control samples in Rv stimulation data. The
LVS and RVS data were processed separately. Each
dataset was divided into 3 sets: the training set (60%),
the cross-validation set (20%) and the test set (20%).
Table 1: Lv stimulation (LVS) and Rv stimulation (RVS)
ANN parameters determined by genetic algorithm after 100
generations. Step size 1 refers to weights between input and
hidden layer, step size 2 refers to weights between hidden
and output layer.
LVS RVS
hidden layer neurons 25 21
step size 1 0.07 0.49
step size 2 0.41 0.44
momentum rate 0.70 0.70
The two class classification procedure was per-
formed by employment of artificial neural networks
(ANN). We used a multi-layered perceptron with one
hidden layer and a backpropagation training algo-
rithm. This is a fully connected feed-forward only
ANN architecture with weighted neuron connections
from the input towards the output (Figure 3).
Analysis of an Electrocardiographic Multilead System by Means of Artificial Neural Networks - Study of Repolarization During Premature
Ventricular Stimulation
37

input layer output layer
hidden layer
inputs
Q
RS
T
RD
E
RD
T
PE
outputs
control
E +5
RP
Figure 3: ANN topology with input and output signals used
for classification of ECG data.
During the training process these weights are au-
tomatically adjusted by a backpropagation algorithm
so that the difference between the actual and the de-
sired output is minimal. The momentum learning rule
and the logistic sigmoid transfer function were ap-
plied in all layers.The number of hidden layer neu-
rons, the learning step size and the momentum rate
were determined using optimization with genetic al-
gorithm (see Table 1).
The input data was randomized before training.
The genetic optimization took place throughout 100
generations. In every genetic iteration the ANN was
trained with 1000 epochs. The ANN outputs corre-
spond to an individual class and each one produces
a numbers between 0 and 1. The posterior deci-
sion function classified a particular sample into the
class which corresponded to the output that had big-
ger value. The classification score was measured by
the standard measure: classification accuracy (Eq. 7),
calculated from 4 standard quantities: true positive
(TP), true negative (TN), false positive (FP), false
negative (FN). Other standard measures like sensitiv-
ity, specificity and precision take the same values due
to a two class problem and the selected decision func-
tion. The whole training and the classification of all
available data was repeated ten times and the results
were averaged.
CA =
(TP + TN)
(TP+ TN + FP+ FN)
(7)
Classification accuracy was then calculated for
each measuring electrode and the ones with the best
scores were identified as preferential. The contour
maps were generated using these classification scores
showing the preferential areas in the matrix of elec-
trodes.
2.8 ECG Recording Stability
To quantify the stability of ECG recordings we have
measured the coefficient of variation (C
V
) parameter
(Rosner, 1994) for each feature, the Q
RS
, T
RD
, E
RD
and T
PE
. These variables were repeatedly measured
at each electrode of the multi-lead ECG recording
system every 20 min during an hour.
The C
V
is defined as
C
V
=
q
σ
2
× 100% (8)
and the σ
2
(variance within) is estimated as
σ
2
=
k
∑
i=1
n
i
∑
j=1
(y
ij
−
y
i
)
2
n− k
(9)
For each variable evaluated (Q
RS
, T
RD
, E
RD
and
T
PE
) we assume that there are k groups of measure-
ments with n
i
measurements in the ith group. The jth
measurements in the ith group will be denoted by y
ij
and n =
∑
k
i=1
n
i
. The term (y
ij
−
y
i
) represents the de-
viation of an individual measurement from the group
mean for that measurement and is a clue of within
group variability.
2.9 Statistical Analysis
In order to quantify the discrepancy between the pa-
rameters’ distribution and the Gaussian distribution,
we have analyzed the normality of these values us-
ing the D’AgostinoPearson test. It has been observed
that the underlying variables’distribution was Gaus-
sian. Data were expressed as mean value ± stan-
dard deviation (SD). Comparison between ECG in-
dices were performed by means of paired or unpaired
Student t-test for normally distribution variables. Sig-
nificance was considered at a value of p <0.05.
3 RESULTS
In some experiments, we have evaluated the C
V
for
each variable. The C
V
was < 2% for Q
RS
, < 2% for
E
RD
, < 3% for T
PE
and < 3% for T
RD
. So, we have
verified that the estimated variables have not shown
significant statistical differences over the 1-h In Vitro
experiment.
It can be observed in Figure 2, a representative
example the 40 ECG recordings from the control sit-
uation and its respective premature ventricular stimu-
lation at E
rp
+5 ms from the left ventricle.
The classification results have shown that there is
one preferential electrode during LVS. It has been lo-
cated in row #1 and column #3 and so called as r1c3.
Moreover, we have observed three preferential elec-
trodes during RVS. These have been located in row
#3 and column #1 (denominated as r3c1); row #2 and
column #1 (so called as r2c1) and row #3 and column
#8 (denominated as r3c8).
BIOSIGNALS 2016 - 9th International Conference on Bio-inspired Systems and Signal Processing
38

Table 2: Mean values ± standard deviation of the experiments (n=8 during LVS and n=9 during RVS) showing all dispersion
ECG indices measured in control and in E
rp
+5 ms. The values were computed in the preferential electrodes during stimulation
in Lv (n=8) and Rv (n=9), respectively.
control E
rp
+5 ms. stimulation site preferential electrode p-value
Q
RS
76.50±7.33 100.13±85.50 Lv r1c3 0.0006
76.50±6.37 105.00±17.02 Rv r3c1 0.0002
73.00±10.17 101.33±18.61 Rv r2c1 0.0470
72.11±6.07 99.50± 20.35 Rv r3c8 0.0015
E
RD
119.00±17.70 85.50±21.42 Lv r1c3 0.0018
114.14±17.09 107.50±8.54 Rv r3c1 NS
115.50±15.02 85.67±0.58 Rv r2c1 0.0202
122.63±18.30 94.40±26.82 Rv r3c8 0.0441
T
PE
52.38±5.07 72.13± 21.26 Lv r1c3 0.0201
57.57±18.37 57.25±15.39 Rv r3c1 NS
58.00±7.62 79.67± 15.04 Rv r2c1 NS
54.75±9.62 56.00± 17.16 Rv r3c8 NS
T
RD
171.38±18.15 157.63±16.75 Lv r1c3 0.0019
173.50±15.57 158.50±18.09 Rv r3c1 NS
173.50±10.79 165.33±15.01 Rv r2c1 NS
174.67±20.21 153.75±18.07 Rv r3c8 0.0409
Mean and standard deviation of Q
RS
, T
RD
, E
RD
and T
PE
indices during the control condition and dur-
ing LVS and RVS are presented in Table 2. It can be
observed that these results were computed for prefer-
ential leads in each kind of stimulation, LVS and RVS
respectively.
On the other hand, with the aim to localize the
spatial position of the preferential electrode in the 5 x
8 matrix electrodes, we have shown a colored contour
maps, as we can see in Figure 4.
We have tested the trained ANNs with all the
datasets available (Table 3). The lowest classifica-
tion accuracy achieved was on the test set of LVS data
which is expected since the test set was not exposed
to ANN during training. The RVS data exhibit better
result on all datasets used. One reason for this might
be better quality of RVS measurements in compari-
son to LVS measurements. All available data has been
used to calculate the CA of every individual electrode.
The preferential electrodes exhibited 100% CA which
means that the signals from these electrodes can be
certainly distinguished one from another at all times
and thus they show the ventricular repolarization ac-
tivity most clearly. This is our most important result
obtained.
4 DISCUSSION
A total of 40 unipolar leads, in 18 isolated heart rabbit
preparation, were studied using Artificial Neural Net-
works with the aim to analyze: the preferential elec-
trode to detect VRD during premature stimuli (E
rp
+5
Table 3: Classification accuracy (CA) for different data sets,
Lv stimulation (LVS) and Rv stimulation (RVS).
dataset CA LVS CA RVS
training set 0.83 0.86
cross-validation 0.85 0.89
test 0.78 0.87
all data 0.82 0.87
ms) and evaluate which ECG indices are dependent
on the site of pacing during premature ventricular
stimulation.
We have observed that when the premature stim-
uli were applied to the Lv, the VRD changes were
detected using only one preferential electrode (r1c3).
When stimuli were elicited at the Rv, changes of
VRD were detected by three electrodes (r3c1, r2c1
and r3c8). Moreover, we have observed that preferen-
tial electrode during stimulation of Lv is located op-
posite of this ventricle. At the same way the prefer-
ential electrodes during stimulation of Rv are located
exactly opposite of the right ventricle. It can be ob-
served these positions in Figure 1. Also, it is impor-
tant to highlight that all hearts were fixed in the same
position, as we have describe in Section 2.1.
Otherwise, we have observed, in both Lv or Rv
premature stimulation (E
rp
+5 ms), a statistical signif-
icant increase of Q
RS
index duration (see Table 2).
We have concluded that depolarization cardiac phase
did not seem to be different when the stimuli were
elicited from either the Lv or Rv, because both ven-
tricles exhibited a similar response to the premature
ventricular stimulation.
Regarding the T
PE
index, associated to transmu-
Analysis of an Electrocardiographic Multilead System by Means of Artificial Neural Networks - Study of Repolarization During Premature
Ventricular Stimulation
39
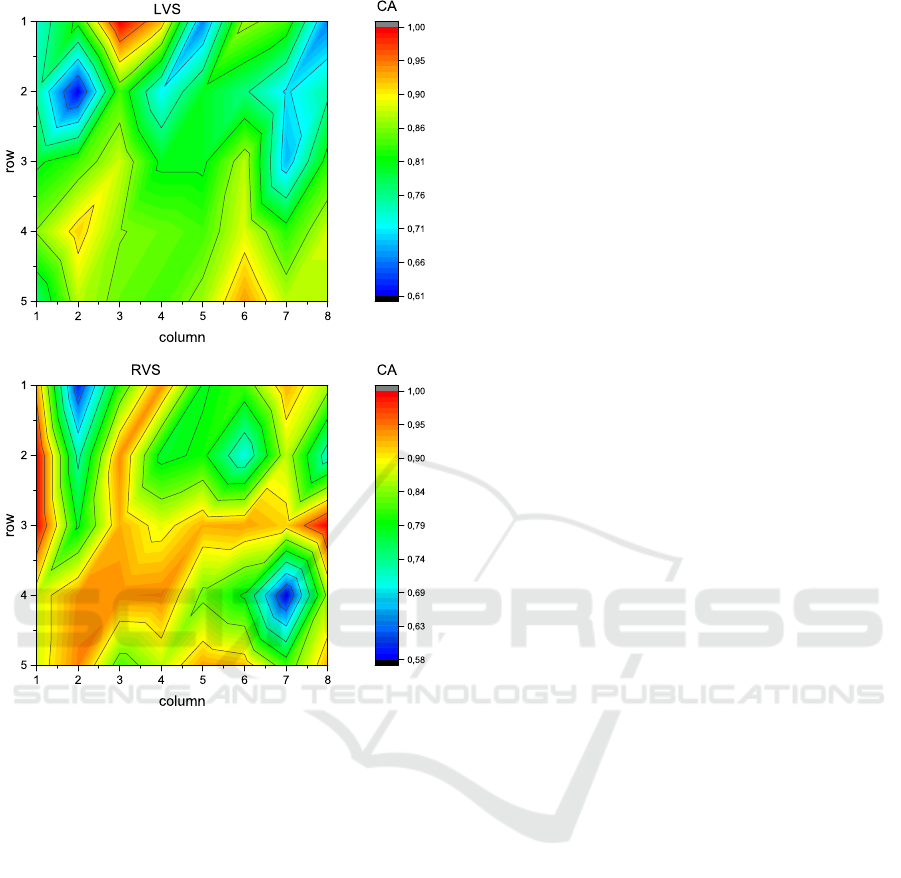
Figure 4: Contour maps of accuracies (CA) distributed over
the 5x8 matrix electrodes. Top panel: one preferential elec-
trode during Lv stimulation (LVS), located in row #1 and
column #3 (red area). Bottom panel: three preferential elec-
trodes during Rv stimulation (RVS), located in row #3 and
column #1, row #2 and column #1 and row #3 and column
#8 (red area).
ral ventricular repolarization dispersion, we have only
found statistically significant increases during prema-
ture stimuli (E
rp
+5 ms.) in the Lv (see Table 2).
Moreover, the E
RD
index have shown statistically sig-
nificant decreases in premature ventricular stimula-
tion of the Lv and the Rv (except in electrode r3c1,
see Table 2). Conversely, no significant changes in
T
RD
(only in r3c8 and with a p-value near to 0.05)
has been observed. We denoted that the T
RD
index
did not change because the T
PE
index increase and
E
RD
decrease its values, simultaneously (see Table
2).
Artificial neural network is one of the machine
learning classification tools which are most widely
used in biomedical applications due to good results
obtained (Dreiseitl and Ohno-Machado, 2002; Cai
and Jiang, 2014; Chen et al., 2015; Shaikhina et al.,
2015). It is a nonlinear non-parametric model which
can mimic from very simple to very complex prob-
lems. It possesses ability to implicitly detect com-
plex nonlinear relationships between dependent and
independent variables. The electrocardiographic mul-
tilead system seems to be an appropriate one to be
analysed by ANN. Of course, we could have picked
some other classification algorithm but since there is
no way to select the most suitable method in advance
there should be performed a thorough comparison of
the methods which is beyond the scope of this paper
and is left for future work.
Moreover, the mechanism responsible for differ-
ent response by premature stimulation depending on
the site of pacing is not clearly explainable only
with the present results. There are anatomic differ-
ences between ventricles, such as the 3D structure or
the anisotropic properties linked with dissimilar wall
thickness and cardiac fibers orientation. We have con-
cluded that all of these parameters might contribute to
the different results obtained between both ventricles.
Finally, the present results have shown that changes
of VRD during premature stimuli can be very well
captured by means of artificial neural networks in a
multilead ECG system
5 STUDY LIMITATIONS
No attempt was made to measure ventricular repolar-
ization dispersion on the epicardial surface or endo-
cardial muscle layers. We have limited our analysis to
ECG signals obtained from recording electrodes em-
bedded in the tank wall.
6 CONCLUSIONS
During premature ventricular stimulation we have ob-
served significant decreases in early repolarization
duration for both ventricles, while in the Lv we have
observed significant increases of transmural disper-
sion. Moreover, we havefound preferential electrodes
to detect VRD, when the premature ventricular stim-
uli were elicited from left or right ventricles.
ACKNOWLEDGEMENTS
This work were supported by Consejo Nacional de In-
vestigaciones Cient´ıficas y T´ecnicas (CONICET) and
Slovenian Research Agency.
BIOSIGNALS 2016 - 9th International Conference on Bio-inspired Systems and Signal Processing
40

REFERENCES
Antzelevitch, C., Viskin, S., Shimizu, W., Yan, G., Kowey,
P., Zhang, L., Sicouri, S., Di Diego, J., and Burash-
nikov, A. (2007). Does Tpeak-Tend provide an index
of transmural dispersion of repolarization? Hearth
Rhythm, 4(8):1114–1119.
Arini, P. D., Bertr´an, G. C., Valverde, E. R., and Laguna, P.
(2008). T-wave width as an index for quantification
of ventricular repolarization dispersion: Evaluation in
an isolated rabbit heart model. Biomed. Signal Proc.
Control, 3:67–77.
Cai, B. and Jiang, X. (2014). A novel artificial neural
network method for biomedical prediction based on
matrix pseudo-inversion. J. of Biomed. Informatics,
48:114–121.
Chen, F., Pan, Y., Li, K., Cheng, K., and Huan, R. (2015).
Standard 12-lead ECG synthesis using a GA opti-
mized BP neural network. 7th International Confer-
ence on Advanced Computational Intelligence, 7:289–
293.
Di Diego, J. M., Sun, Z. Q., and Antzelevitch, C. (1996).
Ito and action potential notch are smaller in left vs.
right canine ventricular epicardium. A. J. Physiol.,
271:H548.
Dreiseitl, S. and Ohno-Machado, L.(2002). Logistic regres-
sion and artificial neural network classification mod-
els: a methodology review. J. of Biomed. Informatics,
35:352–359.
Fuller, M. S., S´andor, G., Punske, B., Taccardi, B.,
MacLeod, R. S., Ershler, P. R., Green, L. S., and Lux,
R. L. (2000). Estimates of repolarization and its dis-
persion from electrocardiographic measurements: di-
rect epicardial assesment in the canine heart. J. of
Electrocardiol., 33:171–180.
Han, J. and Moe, G. K. (1964). Nonuniform recovery of
excitability in ventricular muscle. Circ. Res., 14:44–
54.
Horowitz, L., Spear, J., and Moore, E. (1981). Relation
of endocardial and epicardial ventricular fibrillation
thresholds of the right and left ventricles. Am. J. Car-
diol., 48:698–701.
Kuo, C. S., Atarashi, H., Reddy, P., and Suracwicz, B.
(1985). Dispersion of ventricular repolarization and
arrhythmia: Study of two consecutive ventricular pre-
mature complexes. Circ., 72:370–376.
Kuo, C. S., Munakata, K., Reddy, P., and Surawicz, B.
(1983). Characteristics and possible mechanism of
ventricular arrhytmia dependent on the dispersion of
action potential. Circ., 67:1356–1367.
Laurita, K. R., Girouard, S. D., Fadi, G. A., and Rosen-
baum, D. S. (1998). Modulated dispersion explains
changes in arrhythmia vulnerability during premature
stimulation of the heart. Circ., 98:2774–2780.
Mendieta, J. G. (2012). Algoritmo para el delineado
de se˜nales ECG en un modelo animal empleando
t´ecnicas avanzadas de procesamiento de se˜nales.
Master Thesis. , Facultad de Ingenier´ıa de la Univer-
sidad de Buenos Aires.
Meyer, C. R. and Keiser, H. t. (1977). Electrocardiogram
baseline noise estimation and removal using cubic
spline and state-space computation techniques. Comp.
and Biomed. Res., 10:459–470.
Rosenbaum, D. S., Kaplan, D. T., Kanai, A., Jackson, L.,
Garan, H., Cohen, R. J., and Salama, G. (1991). Repo-
larization inhomogeneities in ventricular myocardium
change dynamically with abrupt cycle length shorten-
ing. Circ., 84:1333–1345.
Rosner, B. (1994). Fundamentals of Biostatistics. Duxbury
Press, fourth edition edition.
Shaikhina, T., Lowe, D., Daga, S., Briggs, D., Higgins, R.,
and Khovanova, N. (2015). Machine learning for pre-
dictive modelling based on small data in Biomedical
Engineering. IFAC-PapersOnLine, 48:469–474.
Shimizu, W. and Antzelevitch, C. (1998). Cellular basis
for the ECG features of the LQT1 form of the long
QT syndrome. efects of β adrenergic agonist and an-
tagonist and sodium channel blockers on transmural
dispersion of repolarization and torsades de pointes.
Circ., 98:2314–2322.
Smetana, P., Schmidt, A., Zabel, M., Hnatkova, K., Franz,
M., Huber, K., and Malik, M. (2011). Assessment of
repolarization heterogeneity for prediction of mortal-
ity in cardiovascular disease: peak to the end of the
T wave interval and nondipolar repolarization compo-
nents. J Electrocardiol, 44:301–308.
Spear, J. and Moore, E. (2000). Modulation of arrhyt-
mias by isoproterenol in a rabbit heart model of d-
Sotalol induced long QT intervals. American J. Phys-
iol, (279):H15–H25.
Surawicz, B. (1997). Ventricular fibrillation and disper-
sion of repolarization. J. Cardiovasc. Electrophysiol.,
8:1009–1012.
Noble, D. and Cohen, I. (1978). The interpretation of the
T wave of the electrocardiogram. Cardiovasc. Res.,
12:13–27.
Yan, G. and Jack, M. (2003). Electrocardiographic T wave:
A symbol of transmural dispersion of repolarization
in the ventricles. J. of Cardiovasc. Electrophysiol.,
14:639–640.
Yuan, S., Blomstr¨om-Lundqvist, C., Pherson, C., Wohl-
fart, B., and Olsson, S. B. (1996). Dispersion of
ventricular repolarization following double and triple
programmed stimulation: A clinical study using the
monophasic action potential recording technique. Eur.
Heart J., 17:1080–1091.
Zabel, M., Hohonloser, S. H., Beherens, S., Woosley, R. L.,
and Franz, M. R. (1997). Differential effects of d-
Sotalol, quinidine and amiodarone on dispersion of
ventricular repolarization in the isolated rabbit heart.
J. Cardiovascular Electrophysiol., 8:1239–1245.
Zabel, M., Portnoy, S., and Franz, M. R. (1995). Electro-
cardiographic indexes of dispersion of ventricular re-
polarization: An isolated heart validation study. J. Am.
Coll. Cardiol., 25:746–752.
Analysis of an Electrocardiographic Multilead System by Means of Artificial Neural Networks - Study of Repolarization During Premature
Ventricular Stimulation
41
