
Visualizing Network Flows and Related Anomalies in Industrial
Networks using Chord Diagrams and Whitelisting
Mikel Iturbe, I
˜
naki Garitano, Urko Zurutuza and Roberto Uribeetxeberria
Electronics and Computing Department, Faculty of Engineering, Mondragon University, Arrasate-Mondrag
´
on, Spain
Keywords:
Industrial Networks, Security Visualization, Chord Diagrams, Flow Monitoring.
Abstract:
Industrial Control Systems are the set of specialized elements that monitor and control physical processes.
Those systems are normally interconnected forming environments known as industrial networks. The par-
ticularities of these networks disallow the usage of traditional IT security mechanisms, while allowing other
security strategies not suitable for IT networks. As industrial network traffic flows follow constant and repeti-
tive patterns, whitelisting has been proved a viable approach for anomaly detection in industrial networks. In
this paper, we present a network flow and related alert visualization system based on chord diagrams. The sys-
tem represents the detected network flows within a time interval, highlighting the ones that do not comply the
whitelisting rules. Moreover, it also depicts the network flows that, even if they are registered in the whitelist,
have not been detected on the selected time interval (e.g. a host is down). Finally, the visualization system is
tested with network data coming from a real industrial network.
1 INTRODUCTION
Industrial Control Systems (ICSs) refer to the group
of specialized elements that monitor and control phys-
ical processes (C
´
ardenas et al., 2008). As such, they
are responsible for controlling and automating a wide
range of processes, both in various industrial sectors
and in Critical Infrastructures (CIs) (Stouffer et al.,
2011), typically in networked environments known as
Industrial Networks. CIs are defined as the assets or
systems that are of vital importance for the correct
functioning and well-being of modern societies. Ex-
amples of CIs include power stations, transportation
systems, water supply and critical manufacturing fac-
tories.
Traditionally, Industrial Networks have been iso-
lated environments, with proprietary protocols, soft-
ware and hardware. However, ICSs have evolved
into using Commercial off-the-shelf (COTS) software
and standard communication systems. Thus, nowa-
days, industrial networks share a growing number of
similarities with regular, computer-based Information
Technology (IT) networks, and are getting increas-
ingly connected to enterprise networks.
This means that the traditional isolation and ob-
scurity principles industrial networks have relied on
for security do no longer apply. Security incidents
regarding industrial networks have shown the impact
that a successful attack can cause, ranging from eco-
nomic loss, environmental damage or even loss of
human lives (Miller and Rowe, 2012). The rise of
Advanced Persistent Threats (APTs) and targeted at-
tacks like Stuxnet (Falliere et al., 2011), Night Dragon
(McAfee, 2011) or Havex (Hentunen and Tikkanen,
2014), specifically targeted to sabotage or steal infor-
mation from ICSs emphasizes even more the need to
protect these assets.
Although industrial networks and IT networks
share a common set of technologies, the different na-
ture of the networks require that security solutions
have to be tailored to suit each type of network. The
differences between both types of networks and its
impact on designing security solutions is exposed by
Cheminod et al. (Cheminod et al., 2013).
Interestingly, when compared to IT networks, the
network topology of industrial networks is static,
while the control traffic itself is by nature repetitive
and predictable, as most traffic is created by auto-
mated processes (Cheminod et al., 2013; Barbosa
et al., 2013). Having these traits in mind, we can
leverage them to tailor security solutions for industrial
networks. Specifically, flow whitelisting
1
, has been
1
Whitelisting refers to the practice of registering the set
of network flows that are allowed in a network, raising an
alarm or disallowing connections that have not been explic-
itly allowed.
Iturbe, M., Garitano, I., Zurutuza, U. and Uribeetxeberria, R.
Visualizing Network Flows and Related Anomalies in Industrial Networks using Chord Diagrams and Whitelisting.
DOI: 10.5220/0005670000990106
In Proceedings of the 11th Joint Conference on Computer Vision, Imaging and Computer Graphics Theory and Applications (VISIGRAPP 2016) - Volume 2: IVAPP, pages 101-108
ISBN: 978-989-758-175-5
Copyright
c
2016 by SCITEPRESS – Science and Technology Publications, Lda. All rights reserved
101

advocated by industry as an effective method for se-
curing industrial networks (Stouffer et al., 2011; Nor-
wegian Oil and Gas Association, 2009). In this di-
rection, Barbosa et al. (Barbosa et al., 2013) demon-
strated that whitelisting is a viable approach to detect
network flow-related anomalies.
1.1 Contributions and Paper
Organization
In this paper we propose a novel visualization tech-
nique for network flows and flow-related anomalies,
aiming at industrial networks. Our main contribution
consists of a set of chord diagrams that visually render
existing flows in a given time interval, visually high-
lighting the anomalous ones that either have not been
whitelisted in the industrial network traffic model or
have not been detected even if they should. Conse-
quently, we aim to fill the void of security visualiza-
tions designed with ICSs in mind in the scientific lit-
erature, as well as representing model violations in an
efficient and aesthetically pleasing manner.
The rest of the paper is organized as follows. Sec-
tion 2 introduces chord diagrams and related works.
Section 3 presents the structure of our visualization
system. Section 4 tests the aforementioned system in
an environment with real industrial traffic. Finally,
Section 5 draws some conclusions about the realized
work.
2 RELATED WORK
Chord diagrams, also known as Circos diagrams, are
circular diagrams that represent relationships between
different entities. Though originally conceived for ge-
nomics (Krzywinski et al., 2009), the usage of dia-
grams has expanded into a wide variety of fields.
Typically, the visualized entities are arranged in
a circular manner. Each entity occupies a given arc
length of the circle mentioned. This length is pro-
portional to the weight the entity has compared to the
rest.
Chords are links that match the entities that form
the circle between them. Each chord generally links
two different entities, and the width of the chord at
both ends denotes the nature of the link. The wider
chord end belongs to the entity that is dominant in the
relationship between both entities linked by the chord.
For instance, in the case that the chord represents a
trade relationship between two countries, the country
with the wider chord end sells more goods to the other
country than vice versa.
The main advantage in the usage of chord dia-
grams to represent network flow data, even under nor-
mal network operation conditions, is that diagrams
can provide situational awareness to operators in a di-
rect manner, whereas traditional text-based alarm sys-
tems can not. This way, network operators can easily
check how each host is interacting with the rest of the
network.
Moreover, when using chord diagrams, it is not
only possible to visualize relationships between dif-
ferent entities, but also their prominence when com-
pared to the rest of the network. When visualizing
network flows, it is possible to represent their activ-
ity through the size of the chords. For instance, ac-
tive flows can be depicted using larger chords. Other
types of visualizations, such as bi-partite graphs, lack
this magnitude feature.
Communication patterns between hosts are fixed
in Industrial Networks, as in this type of networks
each host usually only communicates with a small
subset of the hosts present in the network. There-
fore, few chords are necessary to represent all pos-
sible flows, and diagrams are kept simple enough to
be meaningful, even in large networks.
Chord diagrams are considered to scale well
(Mazel et al., 2014; Krzywinski et al., 2009). How-
ever, if an industrial network is complex enough to
render a unique chord diagram too confusing, sim-
pler chord diagrams can be computed for each of the
network segments. Industrial Networks are hierarchi-
cal, vertical and segmented by nature(Galloway and
Hancke, 2012), so it is possible to use different chord
diagrams to represent the traffic in a network segment.
Another approach to tackle potential scalability issues
might be to use the multi-scale approach proposed by
Zeng et al. (Zeng et al., 2013).
In the field of network security, chord diagrams
have been used in diverse types of visualization sys-
tems, but its usage is not as widespread as other types
of diagrams.
Mazel et al. (Mazel et al., 2014) use chord di-
agrams to perform a visual comparison of different
Anomaly Detection Systems and their detection per-
formance.
The work of Layton et al. (Layton et al., 2012)
represents the relationships between clusters of phish-
ing websites with chord diagrams.
OCEANS (Chen et al., 2014) uses chord dia-
grams (dubbed as Ring Graphs) for visualizing net-
work flows between subnets. However, OCEANS is
centered in traditional IT networks and lacks the ad-
ditional information that can be gathered from indus-
trial networks, where whitelisting policies can not be
as strict as in industrial networks. Moreover, the color
IVAPP 2016 - International Conference on Information Visualization Theory and Applications
102

Industrial
Network
Flow
Collector
Network
Flows
Tagged
Flows
Whitelists
Chord
Diagrams
Flow packets
Learning phase
Flow data
Detection phase
Visualization
phase
Online
Offline
Figure 1: Overview of the flow monitoring system.
code used in OCEANS’ chord diagrams is by the log-
ical location of the host or subnet (internal or external
IP), not by the nature of the connection (normal or
anomalous).
To the best of our knowledge, no flow and
security-oriented visualization system has been devel-
oped for industrial networks, let alone using chord
diagrams. Nevertheless, some advances have been
made to ease process monitoring visualization (Tack
et al., 2014).
3 PROPOSED VISUALIZATION
SYSTEM
Figure 1 shows the workflow of the flow monitoring
and visualization system.
First, flow-enabled networking devices inside an
industrial network send network flow packets to a
flow collector.
Once flow collection has started, the flow collec-
tor is queried to generate offline, a model of detected
flows. The model contains a whitelist of allowed net-
work traffic flows. We call this phase the learning
phase. Once a model has been created, the system
queries the collector for new flow records and com-
pares them to the model online, detecting flows that
do not comply with the policies and tagging each in-
dividual detected flow as valid or anomalous. This
corresponds to the detection phase. Finally, once the
tagged dataset is available, the system builds a set of
chord diagrams to represent the results. This is the vi-
sualization phase. While the learning phase happens
once per network, the detection and the visualization
phases occur periodically.
3.1 Learning phase
In this phase, a model is automatically created from
the flows that have been detected in the network in
a given time frame. The length of this time frame
to build the model depends on the nature of the con-
trolled process. For instance, a process that consists in
small batches will require shorter learning time than
longer, continuous processes, as the cyclical network
patterns will be shorter. The collected network flows
in this time window are considered legitimate and are
used to build the model.
The whitelist that models the network flow behav-
ior is stored in a human-readable Comma-Separated
Values (CSV) file. This way, it is possible for an op-
erator to add missing flows to the modeled whitelist,
or, on the contrary, to delete flows that should be con-
sidered anomalous.
In our approach, we store the following data on
the whitelist per flow: source IP address, destina-
tion IP address, server port, IP protocol and registered
number of packets in the flow in the given time. For
whitelisting purposes, the client port is not registered
as it is assigned randomly and taking it into account
would yield false positives. Barbosa et al. (Barbosa
et al., 2013) do not take the number of packets in the
flow into account. However, we consider packet num-
ber an important aspect to be recorded for two main
reasons: (1) on the one hand, it is a good metric to be
used with chords in the visualization (e.g. to depict
the more active flows as wider chords), allowing the
operator the identification of the main network flows.
(2) On the other hand, this approach allows the sys-
tem to detect flow anomalies that relate to its size (e.g.
Denial of Service attacks or a downed host).
Visualizing Network Flows and Related Anomalies in Industrial Networks using Chord Diagrams and Whitelisting
103

3.1.1 Whitelisting with Time-dependent Flow
Data
As useful as might be, taking into account the number
of packets complicates the usage of whitelists. As the
number of packets in a flow is time-dependent (the
longer the time, the higher the number of registered
packets), it is necessary to establish the time frame
in which the whitelist is valid when comparing this
value. In other words, a whitelist is only relevant if
the capture time that has been used to build it is the
same as the time length of the incoming flow data.
For instance, if a whitelist records the first ten min-
utes of the flow data from an industrial network, it is
necessary to poll the network in intervals of ten min-
utes in order to be able to correctly compare packet
numbers.
There are two approaches that can be followed:
1. A single whitelist is created, with recorded flow
data from a specific time frame. All incoming
flow data is collected and later, when querying it,
it is divided in chunks where the capture duration
of each chunk is the same as the time the whitelist
has used upon creation. The latest chunk of flow
data and the whitelist are compared and a single
visualization is created.
2. Various whitelists are created, each containing
data belonging to different time frames. Flow data
is collected, and when querying it, the chunk size
varies to the duration of the specific whitelist it is
being compared to. Latest chunks of flow data are
compared with each correspondent whitelist and
different visualizations are created, each showing
the information of the last time frame belonging
to the chunk and whitelist.
The second option is a better option, as it offers
more granularity and increases the ability to detect
flow anomalies that might not be easy to detect with
a single, fixed-length whitelist. For instance, let us
assume a host that sends a large number of packets in
short bursts but within the packet number limits of the
whitelist with short time frames. If this bursts should
decline after a short time, but for whatever reason they
do not, the unique whitelist system will not be able to
detect the anomaly, as it is not able to check the sys-
tem in the long run and the packet number is correct
in each of the short time frames.
If the opposite case, where the whitelisting time
frame is too long, we might not be able to detect short
bursts of a high number packets that might not change
much the whole number of packets in the long run.
Therefore, in our approach we propose a system
where whitelists of different time length are consid-
ered. Nonetheless, the optimal number of whitelists
and the time length of each of them is process-
dependent and should be studied for each network.
However, it is important to note that with longer learn-
ing periods, the probability of whitelisting malicious
traffic gets higher.
3.2 Detection Phase
In this phase, the different created whitelists are used
to evaluate new flow data. This flow data is queried
from the flow collector with different time lengths in
order to match each of the time lengths registered with
the whitelists. Later, this new flow data is compared
to the whitelist corresponding to the same time frame.
This way, the packet number of each flow is kept con-
sistent, as comparing data collected in different time
lengths would raise a high number of false positives.
This process is repeated constantly in a batch manner.
The mechanisms checks if the flow data matches
the one in the whitelist. In the case of source and des-
tination addresses, server port and protocol, the flow
information must match exactly. In the case of the
registered number of packets in the time frame there
is an exception: both numbers do not have to match
exactly, but do not have to differ vastly either. The
detector gives the possibility of setting a user-defined
threshold for packet number tolerance in terms of per-
centage. Flows that are above or below this percent-
age threshold are considered anomalous, while the
ones that are within the limits are considered valid.
If the flow is whitelisted, no alarm is raised and the
flow is tagged as legitimate. Still, if a non-whitelisted
flow is detected, the system raises an alarm and the
flow is tagged as anomalous. In addition, the system
also checks if all the flows registered in the whitelist
also happen during the given time frame. If a flow
registered in the whitelist has not been detected in the
given time frame the flow is tagged as missing and an
alarm is raised. This gives the opportunity of detect-
ing a downed host or connection.
We have created the following tags in the detector,
based on the comparisons the system does between
whitelists and new flow data:
Whitelisted Flow. The flow is considered legitimate
according to the whitelist.
Anomalous Network Flow. Two hosts communi-
cate between them but according to the whitelist,
these two hosts are not allowed to do so. All flows
regarding a previously unknown host are marked
as such.
Incorrect Port. A host tries to access a different port
than the usual on a host it is allowed to communi-
cate with.
IVAPP 2016 - International Conference on Information Visualization Theory and Applications
104

Incorrect Protocol. A network flow is detected us-
ing a different IP protocol to the whitelisted one.
Missing Flow. A flow contemplated on the whitelist
has not been detected on the collected flow data.
Anomalous Flow Size. The packet number on the
designated flow is either higher or lower than the
defined threshold when compared to the whitelist.
Each of this tags is used to give information about
the cause of the anomaly both in the raised alarm and
in the rendered chord diagram.
Once the data has been tagged, the system trans-
lates known IP addresses into host names in the
tagged dataset in order to make flow data easier to
understand to the user.
Finally, after the detection phase, we have a fully
tagged flow dataset. This tagged information is later
used in the visualization phase to build the chord
diagram that depicts the network flows and related
anomalies in the industrial network.
3.3 Visualization Phase
In this phase, each of the tagged flow datasets is ren-
dered visually in the form of a chord diagram.
First, each of the active hosts in the network is
given an arc section of the circle of the chord diagram.
The arc length is given by the number of packets the
host has sent on the measured time frame; more ac-
tive senders have wider arcs than more silent hosts.
The nature of the host determines its color; each type
of host has an identifying color (e.g. PLCs are blue)
while individual hosts are differentiated by having a
different shade of the same color.
In our case, Programmable Logic Controllers
(PLCs) are depicted with blue colors, control servers
are green, Human Machine Interfaces (HMIs) are pur-
ple and, finally, different network devices (gateways,
switches etc.) are colored in orange.
Once the hosts have been located, it is necessary
to represent network flows between them. This is
achieved by using chords: each bidirectional network
flow is rendered as a single chord that links two dis-
tinct hosts. If two hosts have different network flows
(for instance, a host communicates with two differ-
ent services offered by another host), only a single
chord is created in the diagram. The width of each
chord end is given by the number of packets the re-
lated host sends. For example, if in a given flow Host
A sends more packets to Host B than vice versa, the
chord will be wider at the Host A’s end. Similarly,
more busy flows are depicted as wider chords than the
almost-inactive counterparts. Later, each of the legit-
imate flow chords is filled with the color of the more
active host in the communication.
Figure 2 shows a completed chord diagram where
all the registered flows have been tagged as legitimate.
Note that hosts of the same type share similar col-
ors. In chord diagrams where network flow data is
shown, all chords will link distinct hosts, as when a
host accesses a local service, the network communi-
cation is carried out through the loopback interface
and the data does not travel over the network. When
the user hovers over an specific flow, the visualization
shows basic information about the flow, such as the
name of the involved hosts and the number of packets
that take part in each direction of the network flow.
Since under normal operation conditions legiti-
mate traffic flows represent most of the traffic of an in-
dustrial network, the reproduction of each traffic flow
by a selection of a color-range makes easier to dis-
tinguish between different flows. Thus, the network
operator can determine if the traffic tagged as legiti-
mate is behaving as expected.
Figure 2: Chord diagram depicting a set of legitimate net-
work flows.
In case of non-legitimate flows, the chord is filled
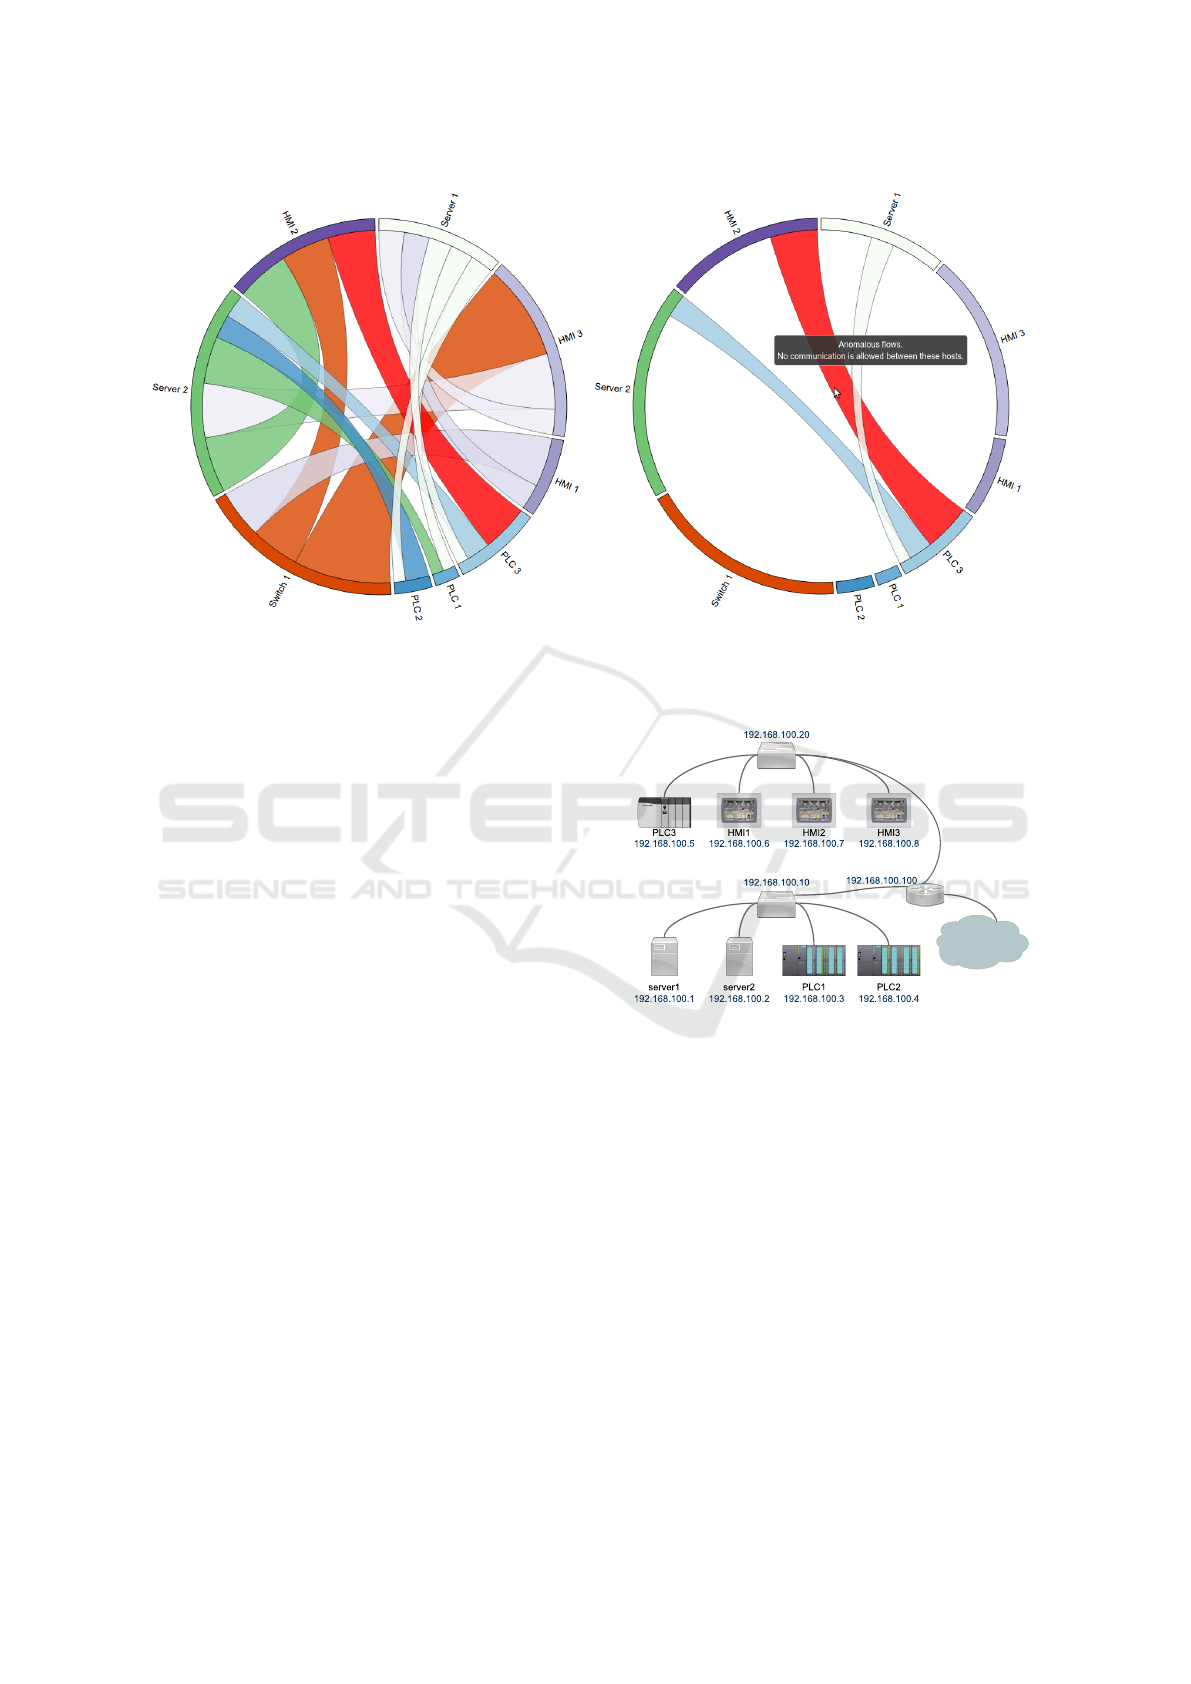
with red color, as it can be seen in Figure 3. On
the one hand, Figure 3a represents how the red color
stands out over the rest of chords when the diagram
is rendered. On the other hand, Figure 3b shows how
the diagram filters the information concerning a single
host when hovering the mouse over it, to highlight re-
lated information and ease visualization. As it is also
shown, when hovering over the anomalous flow, the
diagram shows additional information about the flow,
regarding the reason why it has been flagged as such.
As stated before, this information is contained in the
tag assigned in the detection phase. In this case, no
traffic between the PLC 3 and HMI 2 is allowed ac-
cording to the whitelist.
With the exception of the “Missing flow” tag, all
detected non-legitimate network flows are dyed in red
Visualizing Network Flows and Related Anomalies in Industrial Networks using Chord Diagrams and Whitelisting
105
(a) Anomalous flow between PLC 3 and HMI 2. (b) Detail of the flow when hovering the mouse over it.
Figure 3: Representation of an anomalous network flow.
to visually highlight it from the rest of the flows.
However, due to the different nature of the “Missing
flow” tag, these flows are rendered in black (see Fig-
ure 7). These flows are as well the only flows that
are rendered with the data from the whitelist instead
of the collected flows, as no data regarding them has
been retrieved from the network.
4 APPLICATION IN AN
INDUSTRIAL NETWORK
MONITORING DASHBOARD
This section tests the previously described system
within an industrial network.
4.1 Test Network
As security testing on a live network can have un-
expected consequences, such as malfunctioning or
safety issues (Duggan et al., 2005), and currently, to
the best of our knowledge, there is no network flow
data for industrial networks, we have duplicated the
network of a real industrial installation in our labora-
tory. The original network is the control network of a
car painting line in a manufacturing facility.
Figure 4 shows the topology of our test network.
Both network switches are the network agents that
send flow packets to the collector. In our case, we
use Cisco’s NetFlow, version 5. Moreover, Switch 1
is also the DNS Server of the network.
Switch 2
Switch 1
Gateway
Figure 4: Network topology of the test industrial network.
There are three Programmable Logic Controllers
(PLCs) in the network that are responsible for control-
ling the industrial process. Two supervisory control
servers poll process data from all the PLCs. Commu-
nication between servers and PLCs is done through
the Modbus/TCP protocol.
There are also three Human Machine Interfaces
(HMIs) present in the network, that enable operators
to overview the process through the representation of
process data in a visual, accessible manner. HMI
1 gathers data from Server 1, HMI 2 renders data
from Server 2 and finally, HMI 3 visualizes data from
both servers. Communication between HMIs and the
servers is done using the OPC protocol.
A gateway gives the industrial network access to
external hosts, such as the network flow collector.
IVAPP 2016 - International Conference on Information Visualization Theory and Applications
106
4.2 System Implementation
For our tests, we use Cisco’s Netflow (version 5) as
network flow system to send data to the flow collec-
tor. The switches from the network send flow data to
a Logstash
2
agent that receives it, parses it and later
indexes it in an ElasticSearch
3
cluster. This approach
allows potential large-scale usage of the monitoring
system and fast querying of the flow data to render vi-
sualization. The visualization system that builds these
chord diagrams has been developed using the D3 (Bo-
stock et al., 2011) library.
4.3 Cases
In this section we show rendered chord diagrams in
three different anomalous cases: a Denial of Service
(DoS) attack, a network scan that aims to enumerate
hosts in the network, and a network outage where
a host goes down. For test purposes, all the next
chord diagrams have been created with data taken at
ten minute intervals, using their equivalent whitelist
and with a threshold of 20% variation tolerance in the
number of packets in the flow.
4.3.1 Denial of Service
Denial of Service (DoS) attacks occur when an at-
tacker tries to obstruct the normal functioning of a
host or service by making it unavailable to legitimate
users. In industrial networks, where availability is the
primary security concern and latency issues can create
significant network problems, DoS attacks are a real
problem. In our case we mimic a DoS attack from
the HMI 3 to Server 1 by making a great number of
illegitimate network requests.
Figure 5 shows the rendered result. The flow with
the attack is painted in red, as it has surpassed the
established threshold for network packages. As the
sent number of packets gets higher, HMI 3 also gets
a wider arc in the chord diagram circle, as well as the
chord’s end in its side.
4.3.2 Host Discovery
Host discovery is one of the first steps an attacker per-
forms when obtains access to an unknown network in
order to gather insight about it. Port scanning is one
of the most used techniques for host discovery. For
our test, conducted a TCP Connect scan with Nmap
from the host HMI 3.
2
https://github.com/elastic/logstash
3
smallhttps://github.com/elastic/elasticsearch
Figure 5: Visualization of a Denial of Service attack.
Figure 6 shows the chord diagram depicting the
attack. All flows regarding HMI 3 are flagged as ma-
licious, either because it is communicating with non
whitelisted hosts (e.g. PLCs) or because it uses differ-
ent protocols and/or ports with hosts that it is actually
allowed to communicate with.
Figure 6: Visualization of a port scan.
4.3.3 Host Down
Finally, we consider the case when a host goes down
from the network and it is not able to receive or send
packets. In this case, we have physically disconnected
Server 1 from the network.
Figure 7 shows how the system shows the downed
host, with black chords representing that we are deal-
ing with missing flows. In order to be able to render
the diagram, data is taken from the whitelist, as no
real data has been collected from the network regard-
ing these flows.
Visualizing Network Flows and Related Anomalies in Industrial Networks using Chord Diagrams and Whitelisting
107

Figure 7: Visualization of a downed host.
5 CONCLUSIONS
We have presented a novel pipeline to network data
analysis that enables to visually monitor industrial
networks by using whitelists and chord diagrams. To
do so, first we build a time-based industrial traffic
model which whitelists allowed network flows. More-
over, the model considers packet throughput, in addi-
tion to host addresses, server ports and IP protocols
that makes possible to detect additional flow-related
anomalies (DoS attacks and downed hosts). Each
entry of the model whitelists an specific duration of
gathered flow data. In the same way, every new flow
data is compared against the traffic model to see if
it fits an entry. All flows are tagged according to its
nature (legitimate, anomalous, incorrect port or pro-
tocol, missing and anomalous flow size).
This tagged data is used to build chord diagrams
that represent network flow relationships between dif-
ferent hosts. The size of the chords represents the
amount of network packets in the flow, used as the
main metric to build the diagram. The tagging system
provides a color code to highlight anomalous flows
(in red and black) and also provides feedback about
its nature.
REFERENCES
Barbosa, R. R. R., Sadre, R., and Pras, A. (2013).
Flow Whitelisting in SCADA Networks. Interna-
tional Journal of Critical Infrastructure Protection,
6(3):150–158.
Bostock, M., Ogievetsky, V., and Heer, J. (2011). D
3
data-driven documents. Visualization and Computer
Graphics, IEEE Transactions on, 17(12):2301–2309.
C
´
ardenas, A., Amin, S., and Sastry, S. (2008). Research
Challenges for the Security of Control Systems. In
HotSec.
Cheminod, M., Durante, L., and Valenzano, A. (2013). Re-
view of Security Issues in Industrial Networks. IEEE
Transactions on Industrial Informatics, 9(1):277–293.
Chen, S., Guo, C., Yuan, X., Merkle, F., Schaefer, H., and
Ertl, T. (2014). OCEANS: online collaborative explo-
rative analysis on network security. In Proceedings
of the Eleventh Workshop on Visualization for Cyber
Security, pages 1–8. ACM.
Duggan, D., Berg, M., Dillinger, J., and Stamp, J.
(2005). Penetration testing of industrial control sys-
tems. Technical Report SAND2005-2846P, Sandia
National Laboratories.
Falliere, N., Murchu, L. O., and Chien, E. (2011).
W32.Stuxnet dossier. White paper, Symantec Corp.,
Security Response.
Galloway, B. and Hancke, G. (2012). Introduction to Indus-
trial Control Networks. IEEE Communications Sur-
veys & Tutorials, 15(2):860–880.
Hentunen, D. and Tikkanen, A. (2014). Havex Hunts
For ICS/SCADA Systems. [Online]. Avail-
able: http://www.f-secure.com/weblog/archives/
00002718.html (Retrieved: 2015-11-19).
Krzywinski, M., Schein, J., Birol, I., Connors, J., Gas-
coyne, R., Horsman, D., Jones, S. J., and Marra, M. A.
(2009). Circos: an information aesthetic for compara-
tive genomics. Genome Research, 19(9):1639–1645.
Layton, R., Watters, P., and Dazeley, R. (2012). Unsu-
pervised authorship analysis of phishing webpages.
In Communications and Information Technologies
(ISCIT), 2012 International Symposium on, pages
1104–1109. IEEE.
Mazel, J., Fontugne, R., and Fukuda, K. (2014). Visual
comparison of network anomaly detectors with chord
diagrams. In Proceedings of the 29th Annual ACM
Symposium on Applied Computing, pages 473–480.
ACM.
McAfee (2011). Global Energy Cyberattacks: “Night
Dragon” (white paper). Technical report, McAfee.
Miller, B. and Rowe, D. (2012). A survey of SCADA and
Critical Infrastructure incidents. In Proceedings of
the 1st Annual conference on Research in information
technology, pages 51–56. ACM.
Norwegian Oil and Gas Association (2009). 104 - Recom-
mended guidelines for information security baseline
requirements for process control, safety and support
ICT systems.
Stouffer, K., Falco, J., and Scarfone, K. (2011). Guide to In-
dustrial Control Systems (ICS) Security, Special pub-
lication 800-82. Technical report, National Institute of
Standards and Technology.
Tack, T., Maier, A., and Niggemann, O. (2014). On Visual
Analytics in Plant Monitoring. In Informatics in Con-
trol, Automation and Robotics, pages 19–33. Springer.
Zeng, W., Fu, C.-W., Arisona, S. M., and Qu, H. (2013). Vi-
sualizing interchange patterns in massive movement
data. In Eurographics Conference on Visualization
(EuroVis), volume 32, pages 271–280.
IVAPP 2016 - International Conference on Information Visualization Theory and Applications
108
