
The Role of Machine Learning in Medical Data Analysis. A Case Study:
Flow Cytometry
Paolo Rota
1
, Florian Kleber
1
, Michael Reiter
1
, Stefanie Groeneveld-Krentz
2
and Martin Kampel
1
1
Computer Vision Lab (CVL), TU Wien, Vienna, Austria
2
Charit
´
e - Universitaetsmedizin, Berlin, Germany
Keywords:
Flow Cytometry, Leukemia (ALL), Deep Learning, Stacked Auto Encoders, GMM.
Abstract:
In last years automated medical data analysis turned out to be one of the frontiers of Machine Learning. Medi-
cal operators are still reluctant to rely completely in automated solutions at diagnosis stage. However, Machine
Learning researchers have focused their attention in this field, proposing valuable methods having often an out-
come comparable to human evaluation. In this paper we give a brief overview on the role of Computer Vision
and Machine Learning in solving medical problems in an automatic (supervised or unsupervised) fashion, we
consider then a case study of Flow Cytometry data analysis for MRD assessment in Acute Lymphoblastic
Leukemia. The clinical evaluation procedure of this type of data consists in a time taking manual labeling that
can be performed only after an intensive training, however sometimes different experience may lead to dif-
ferent opinions. We are therefore proposing two different approaches: the first is generative semi-supervised
Gaussian Mixture Model based approach, the latter is a discriminative semi-supervised Deep Learning based
approach.
1 INTRODUCTION
One of the recurrent questions is how Computer Vi-
sion and Machine Learning techniques are actually
making the difference in the daily routine. Learn-
ing based applications have been successfully em-
ployed for word and image search (Zheng et al.,
2015), semantic retrieval (Hofmanninger and Langs,
2015; Ramanathan et al., 2015), object classification
(Gonzalez-Garcia et al., 2015) etc. These outstanding
results have contributed to increase the consciousness
of the potential of Machine Learning, directing the re-
searcher’s attention on other topics, targeting different
applications where the error is by far less tolerated.
These area of interest span from Video Surveillance to
Medical Applications, crossing Biometrics and Bioin-
formatics.
Medical data analysis is a topic where human su-
pervision has still a central position in every phase of
the process, from diagnosis to each stage of the treat-
ment. However research groups have focused their
attention on medical data analysis with the purpose
of automating different stages of the medical process
(Yoo et al., 2012).
Image based medical data analysis often relies
on Magnetic Resonance Imaging (MRI) or Positron
Emission Tomography (PET). In (Zhu et al., 2014)
the authors propose a joint regression and classifica-
tion for Alzheimer’s disease and Mild Cognitive Im-
pairment diagnosis, analyzing the features in a novel
framework composed by similarity matrix and loss
sparse function reaching accuracy close to 100%. In
(Hofmanninger and Langs, 2015) they use medical
imaging in order to find correspondences between im-
age segmentation and radiology reports bridging se-
mantics to medical data. However MRI and PET are
not the only possible source of information for high
standard medical data analysis. In (Qureshi et al.,
2014; Staal et al., 2004) the authors uses 2D color im-
ages of the retina in order to detect diabetes. In (Zhou
et al., 2014) the authors focus their attention on multi-
spectral images observed by the microscope in order
to perform cell classification. Alternative technolo-
gies are used in order to extract important information
from cellular tissue, one of the most popular is the
Flow Cytometry (FCM), since it is a fast and cheap
methodology for cell analysis. FCM is a laser-based
biophysical technology that measures physical (size
and granularity) and biological (different cell types
can be detected with different markers) characteris-
tics of single cells in fluid stream passing through a
laser beam. FCM is currently widely used by oncol-
Rota, P., Kleber, F., Reiter, M., Groeneveld-Krentz, S. and Kampel, M.
The Role of Machine Learning in Medical Data Analysis. A Case Study: Flow Cytometry.
DOI: 10.5220/0005675903030310
In Proceedings of the 11th Joint Conference on Computer Vision, Imaging and Computer Graphics Theory and Applications (VISIGRAPP 2016) - Volume 3: VISAPP, pages 305-312
ISBN: 978-989-758-175-5
Copyright
c
2016 by SCITEPRESS – Science and Technology Publications, Lda. All rights reserved
305
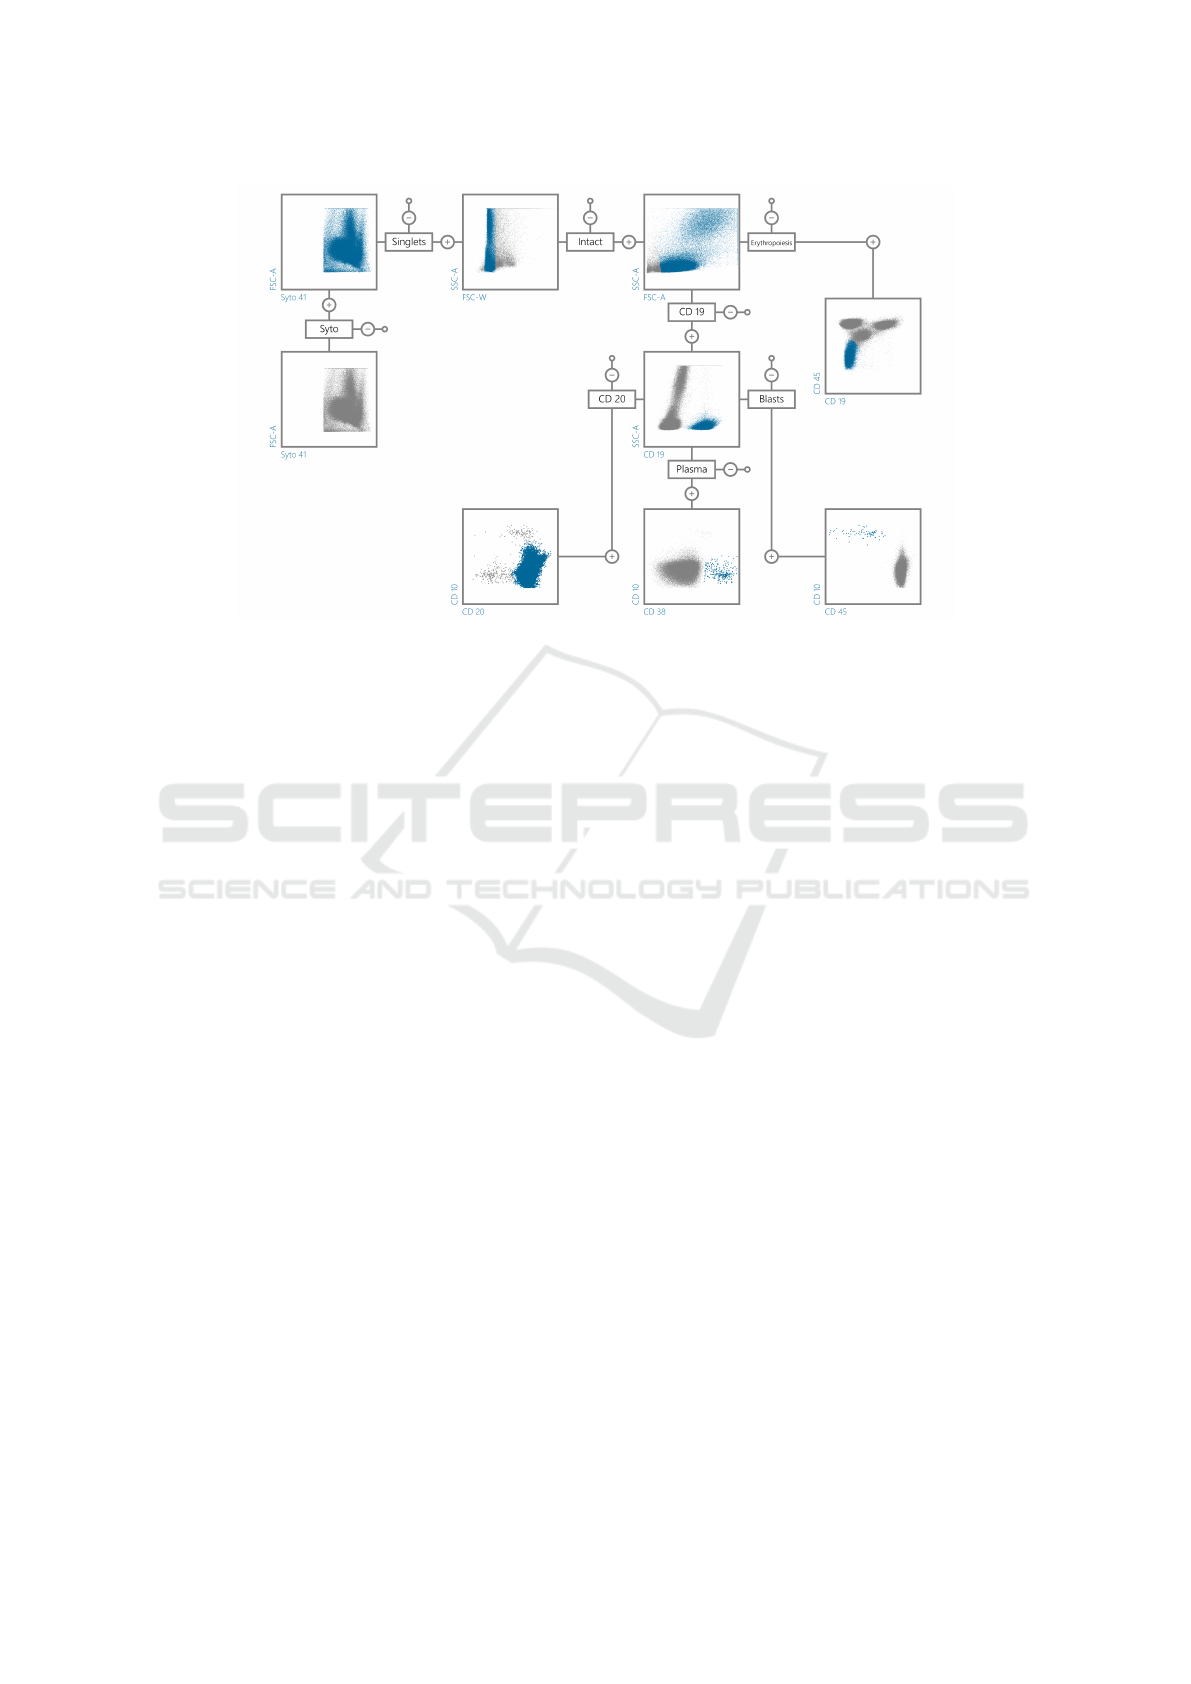
Figure 1: Example of gating hierarchy used for manual minimal residual disease assessment in B-ALL.
ogists to manually detect remaining leukemic cells in
the bone marrow sample of a patient. Up to now anal-
ysis of FCM data is done manually.
In this paper we give an overview of the FCM
technique, describing the data and the acquisition
process, with particular interest to the Acute Lym-
phoblastic Leukaemia of type B (B-ALL) data. We
focus on the criticalities of the FCM data analysis,
examining the medical process highlighting the prob-
lems connected to the application of Machine Learn-
ing techniques on this type of data. The manual la-
beling strategy consists in a hierarchical procedure
named gating that strongly relies on the skills and ex-
pertise of the FCM operator. To overcome this sub-
jectivity issue we propose two automated, efficient
and objective approaches to evaluate the FCM data;
the first is supervised, based on deep learning and a
second generative semi-supervised based on Gaussian
Mixture Model (GMM). Minimal Residual Disease
(MRD)is the number of remaining leukemic cells at
certain time points during the treatment, allowing the
doctors to tailor therapy intensity according to the re-
sponse of each patient. The challenge of this method-
ology is that often certain cell populations are very
small compared to the overall sample size (sometimes
less than 0.1%).
The paper is structured as follows: in Sec. 2 is
described the FCM data acquisition procedure and
the way the assessment is performed by clinicians. In
Sec. 3 we outline the two proposed methods to assess
MRD in patients affected by B-ALL. In Sec. 4.1 we
give a brief description of the dataset used for the
evaluation stage which is described in Sec. 4. In Sec.
5 the results are presented and conclusions are drawn.
2 FLOW CYTOMETRY
In this section we describe briefly the FCM data from
the acquisition to the MRD assessment in B-ALL.
In order to perform the acquisition, the bone mar-
row sample must be prepared, this procedure is called
staining and consists in adding a proper panel of con-
jugates (fluorochrome/antibodies combination) to the
sample. The antibodies are ideally specifics to the
protein expression of a certain cell type. The fluo-
rophores attached to the antibodies, are excited by the
laser beam of the Flow Cytometer. The stained cells
inside the sample are pushed through in a single flow
and measured by lasers with different wavelengths.
Due to the possibility of noise, each measurement is
called event. The fluorophores excitement is captured
by an electronic sensor. The device will also produce
physical measurement; the Forward Scatter (FSC, for
size measurement) and the Side Scatter (SSC, for
granularity measurement). A data value compensa-
tion is necessary due to the partial overlapping of the
fluorescence spectra of the different fluorochromes,
it is called spillover compensation and contributes in
building the statistical independence of the data. The
described procedure produces multiparameter read-
ings for each event present in the sample.
In order to ease the comprehension to not famil-
iar readers we propose a short description of the data
generated by the flow cytometer:
VISAPP 2016 - International Conference on Computer Vision Theory and Applications
306
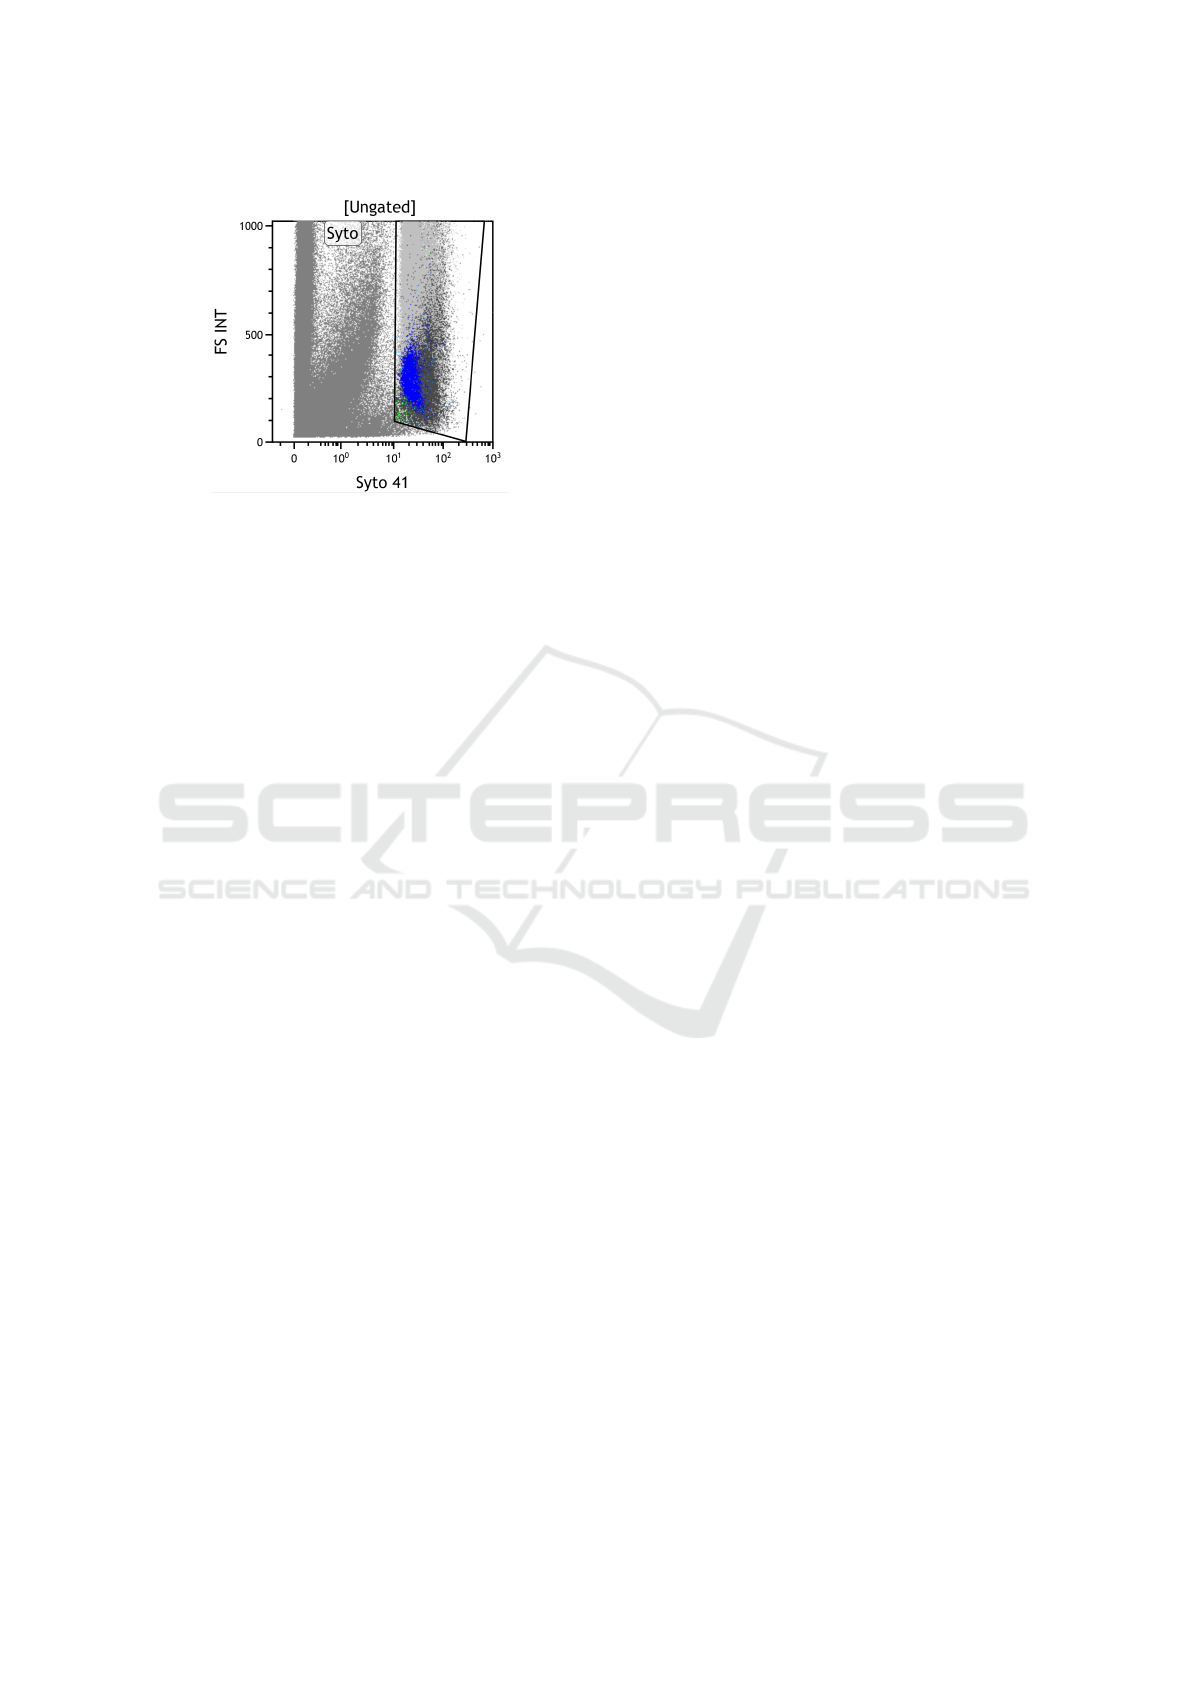
Figure 2: A sample as it is generated by the flow cytome-
ter. The figure is representing the Syto gate on the entire
set of cells in the 2D dimension composed by Syto 41 and
Forward Scatter parameters.
• Sample. A sample is the outcome of the mea-
surement of a stained bone marrow sample, at a
specific time point (an entire sample is shown in
Fig. 2).
• Event/Cell. Every measurement sensed by the
flow cytomenter during the analysis of a sample.
Generally, an event refers to a cell. In Fig. 2 each
point is an event.
• Gate. The labeling phase is performed manu-
ally by experts, it consists in drawing polygons
on 2D scatter plots (see Fig. 2) following a hierar-
chical procedure (an example of gating hierarchy
used for MRD assessment in ALL is shown in Fig.
1.The main criticality of the gating procedure that
can affect the results is the operator subjectivity,
which is shown in clinical ring trials and present
deviations in MRD values (Dworzak et al., 2008).
• Blasts. The name blasts is referred to all the
cells that have been considered leukemic by ex-
pert. The medical assessment is therefore per-
formed counting the blasts events in relation to the
whole test sample (MRD value).
2.1 Related Works
In last few years there has been an increasing number
of approaches aiming at automating the FCM analysis
process (Bashashati and Brinkman, 2009; Aghaeep-
our et al., 2013). The main objectives of these algo-
rithms is to automatically assign each event to a spe-
cific biologically meaningful population, sometimes
relatively small (i.e. ten events out of two millions).
Unlike the manual gating, the automated methods per-
form the event clustering considering the whole mul-
tidimensional space at once. The outcome can be used
in the clinical routine or for further automatic inter-
pretation of the data. Most of the existing approaches
are unsupervised clustering methods adapted to be
very sensitive for small populations i.e. (Naim et al.,
2014). In this paper the authors propose a revised
GMM integrated with a splitting and merging proce-
dure that is particularly suitable to outline small bio-
logically meaningful populations. (Pyne et al., 2009)
is an EM-based multivariate finite mixture model al-
gorithm. The authors observed that the data clusters
are often skew and heavily-tailed, for this reason they
proposed a method that employs skew-t distributions.
In (Finak et al., 2009) the authors use an adapted ver-
sion of flowClust (Lo et al., 2008) to identify cell sub-
populations, allowing the user to define the number of
distinct cell populations.
Regarding he automatic leukemic cell detection,
in the work proposed by Costa et al. (Costa et al.,
2010), the authors propose a supervised approach
where new events are classified using a nearest neigh-
bor classification in the 2D-principal subspace, ob-
tained by principal component analysis of a labeled
training set. In (Toedling et al., 2006), the authors
propose a Support Vector Machines based frame-
work to automate leukemic cell detection in cytom-
etry where conventionally diagnosed data are used to
train the classifiers. As in (Toedling et al., 2006), our
interest is in classifying each event not only for dis-
criminating different populations but also to identify
that subset of events that corresponds to the blast pop-
ulation.
3 AUTOMATIC CELL
CLASSIFICATION
In this section we give a detailed description of the
two approaches proposed to estimate the MRD in
FCS data. The first in Section 3.1 is fully discrimi-
native and based on deep architecture of Neural Net-
works, the second is a generative approach based on
the Gaussian Mixture Model and it is proposed in Sec-
tion 3.2.
3.1 Stacked Auto-encoders Approach
Recently, in the computer vision community, the Con-
volutional Neural Networks (CNN) have shown suc-
cess in many important tasks such as object recog-
nition (Zhang et al., 2015; Krizhevsky et al., 2012;
He et al., 2014), image segmentation (Cimpoi et al.,
2015; Hariharan et al., 2014), head pose estimation
(Conigliaro et al., 2015), to name a few. Although
this architectures are successfully used on images and
The Role of Machine Learning in Medical Data Analysis. A Case Study: Flow Cytometry
307
Input Layer Output LayerDecoder LayersEncoder Layers
1000 nodes
10 nodes
input
10 nodes
output
1000 nodes
500 nodes 500 nodes
250 nodes 250 nodes
30 nodes
(a)
Input Layer Encoder Layers
2 Fully-connected
Layers
P
non-blasts
P
blasts
1000 nodes
500 nodes
250 nodes
30 nodes
15 nodes
10 nodes
input
(b)
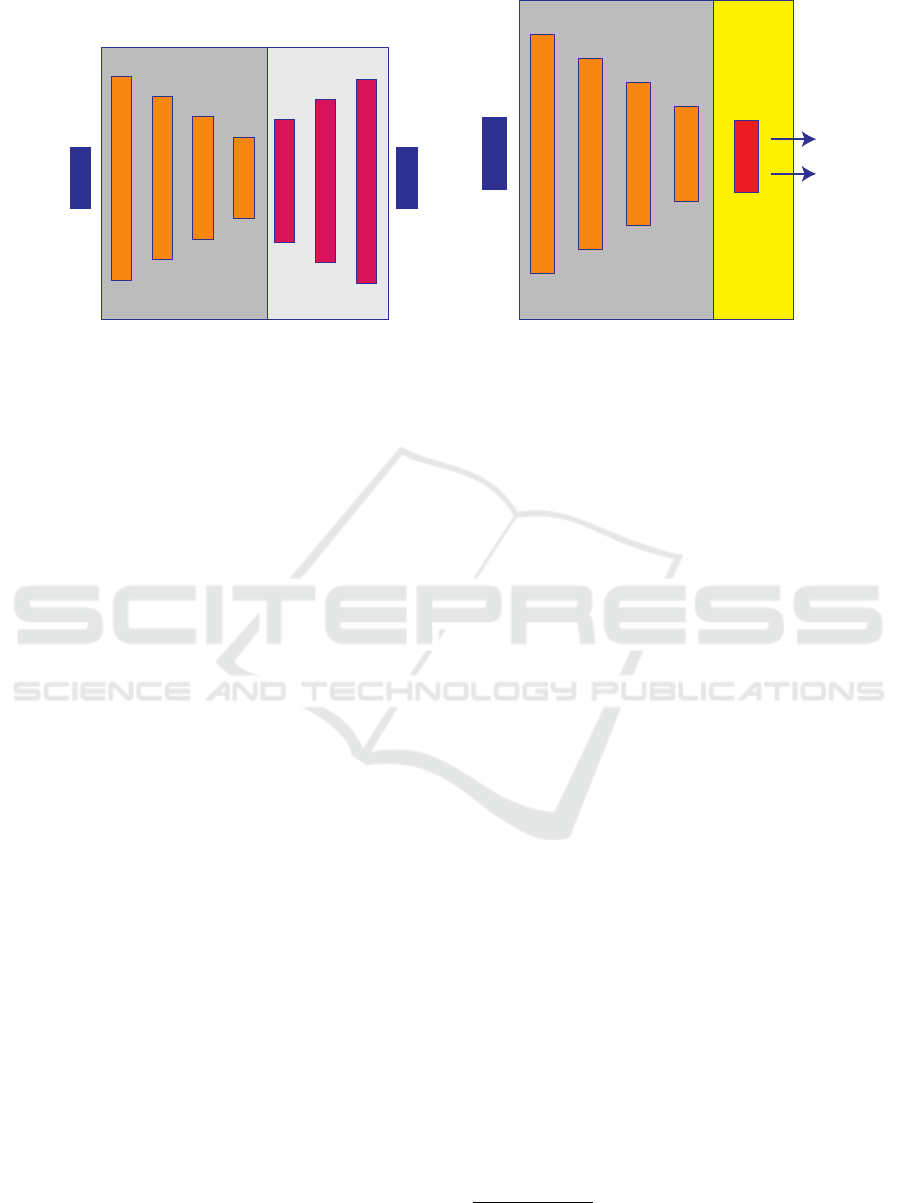
Figure 3: Scheme of the model adopted for the Stacked Auto-Encoders. On upper part (a) the unsupervised phase where the
first 4 layer are learned directly from the data. In the sketch at the bottom (b) the supervised part of the network with two
extra fully connected layers in cascade to the encoders is shown.
videos, in FCM data this approach is not yet estab-
lished. In images, neighboring pixels are highly re-
lated to each other, this spacial property is not present
in FCM data. Parameters, in this domain, are indeed
standalone features concatenated without specific and
predefined order in an one-dimensional array. The
combination of those features lead to the detection of
meaningful populations that are not always positioned
in the same location of the feature space.
In order to give a deep description of FCM data we
propose an approach based on a deep network based
on a Stacked layout of Auto-Encoders (SAE) (Ben-
gio, 2009; Vincent et al., 2010). This network, unlike
the CNN is more general and easily applicable to dif-
ferent type of data. There are two major reasons for
our choice: Firstly, this neural network, unlike CNN,
has more general purpose and it is easy to apply on
different types of data. The second reason is that this
type of neural network is extremely useful in discov-
ering interesting structure in the data (Bengio, 2009).
The proposed SAE architecture is composed by the
input layer of size 10x1, that is the number of param-
eters used to describe an event, this means that tis ap-
proach is event oriented, and we are trying to find a
multi-dimensional hyperplane capable to separate the
two final classes (details on the structure are noted in
Fig. 3). The training phase of the network consists of
two steps: firstly an unsupervised approach, in which
the network is forced to learn the data structure from
the training proposing a new interpretation of the in-
put features. The second is the supervised step, in
which the output of the net is forced to the labels in
order to adapt the weights to produce the final infer-
ence.
3.2 Gaussian Mixture Model Approach
In our particular case, the cardinality of the dataset,
would make too computational demanding an ap-
proach based on kernel model estimation. A vi-
able solution is to estimate the model approximat-
ing the training set with a distribution generated by
a parametrized distribution. The Gaussian Mixture
Model (GMM) is widely used approach to fulfill this
task
1
. Because of its flexibility in FCM data analy-
sis, in particular for population clustering (Naim et al.,
2014), the GMM leads to very good results. This gen-
erative approach has the ability of fitting point cloud
distributions reducing the number of parameters com-
paring to a kernel based method.
In ALL data, as mentioned in Sec. 1, the blasts
population is often very small with respect to the
whole set of events. In order to avoid losing infor-
mation on the small populations and to semantically
give meaning to those distributions, we learned two
different models for blasts and non-blasts separately.
The estimation of such model is performed by a mod-
ified Expectation Maximization (EM) algorithm sim-
ilar to (Naim et al., 2014). The two distributions are
generated by 10 and 2 gaussians for blasts and non-
blasts populations respectively. These values are the
empirical results of tests as an acceptable compromise
between accuracy and computation burden. The fi-
nal model is the result of merging the two distribu-
tions by averaging their components. The resulting
distribution is shown in Fig. 4. Unlike (Naim et al.,
2014) our interest is not only in discriminating dif-
1
We remand to (Bishop, 2006) for the theoretical de-
scription of the model.
VISAPP 2016 - International Conference on Computer Vision Theory and Applications
308
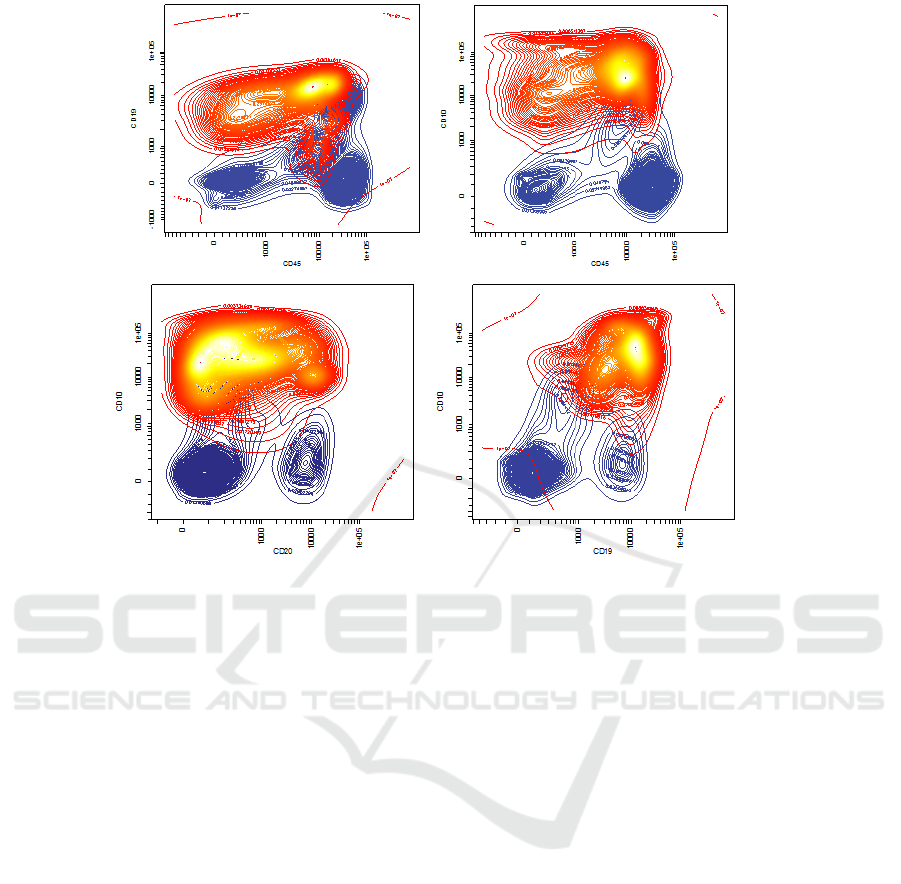
Figure 4: The result of the modeling performed by the GMM, we can distinguish in red the blasts population and in blue the
non-blasts.
ferent populations but also in the blasts identification,
therefore the classification of observations of a new
sample is done by a Bayes decision using the pos-
teriors obtained from the GMM components, where
the priors are set according to the average relative fre-
quencies of leukemic events in the training set. In Fig.
5 we can see a 2D projection of the samples with re-
spective gates drawn (A), and a GMM approximation
of the point distribution (B), the model of non blasts
(C) and blasts (D) respectively highlighted.
4 EVALUATION
MRD is the relative frequency between the blasts cells
and the overall number of events in a sample as it is
stated in Eq. (1)
MRD
(i)
= N
(i)
blasts
/N
(i)
events
(1)
where i refers to the i-th sample.
4.1 Dataset Description
In order to evaluate the performance of the algo-
rithms, we collected FCM-MRD measurements from
200 ALL patients treated according to the AIEOP-
BFM 2009 protocol. MRD was measured in bone
marrow samples of treatment day 15. Sample prepa-
ration and MRD assessment was performed following
the current international standard operating procedure
for 6color FCM-MRD detection. All FCM datasets
were gated manually by experienced operators using
a uniform gating procedure that is depicted in Fig. 1,
however, the parameters on which the blasts gate is
defined may change among samples according to the
appearance of the sample and operator experience.
The FCM output provides for each individual cell
10 different parameters (three optical [FSC-A, FSC-
W, SSC-A] and seven fluorescence based parame-
ters [CD20, CD10, CD45, CD34, SYTO 41, CD19,
CD38]). Each cell parameter becomes/represents a
dimension in the multidimensional data space.
For the evaluation the dataset has been divided in
two groups, training and test composed by 184 and
16 samples respectively. The division has been per-
formed randomly pooling the whole set of data. Vali-
dation for parameter tuning has been performed on a
random 30% of the training set. This operation has
been performed for 11 times in order to enlarge the
test set, resulting in a final test set composed by 176
samples.
The Role of Machine Learning in Medical Data Analysis. A Case Study: Flow Cytometry
309
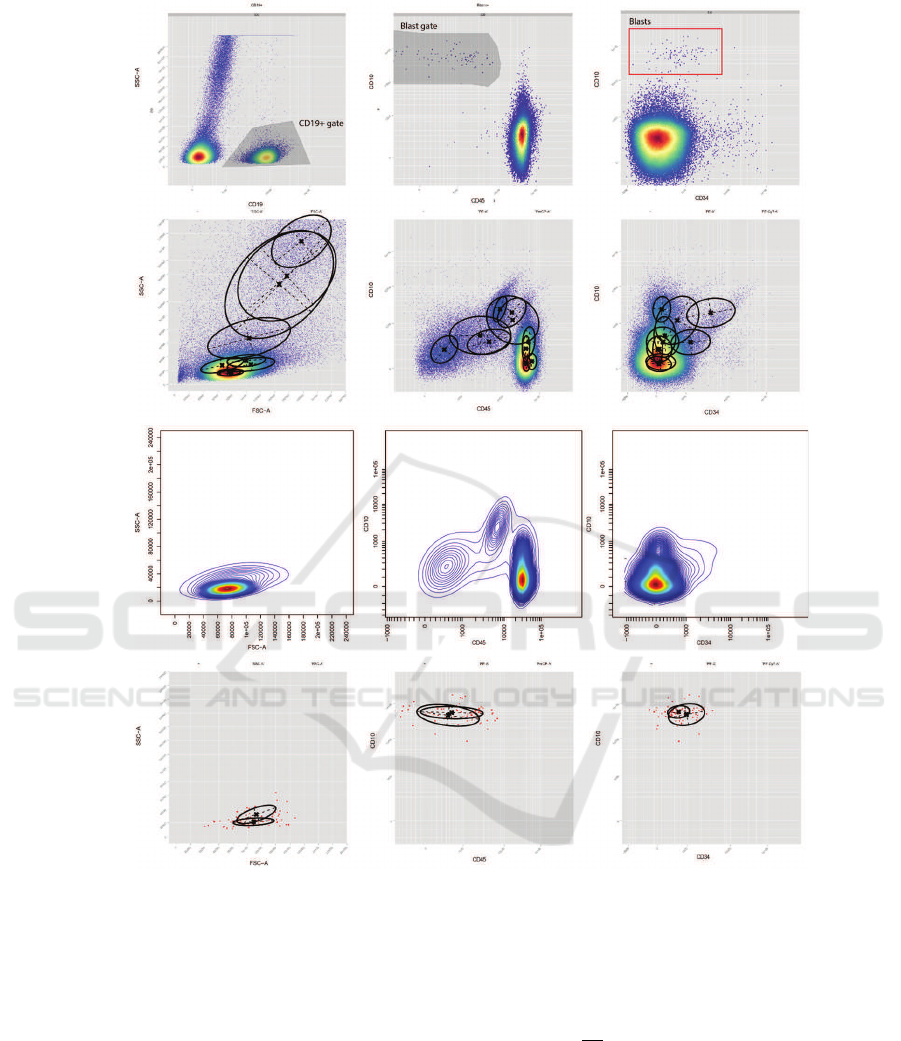
A
B
C
D
Figure 5: In row (A) is shown the gating as it has been performed manually by medical experts. In row (B) the GMM
components are sketched as they are trained by the EM process. In row (C) a representation of the PDF related to the non-
blasts population while in row (D) the model for blasts is shown along with the classified events.
4.2 Results
In order to fairly compare the approaches presented
in this paper, we show the results in two different
forms: graphical and numerical. The results proposed
in graphical form are scatter plots, where each point
represents one sample. The 2D coordinates of each
point are the values of true blasts in relation with the
predicted quantity. An ideal algorithm will produce a
scatter plot with samples disposed along the line y = x
(see Fig. 6).
In order to assess numerically the performance of
the algorithms we propose a comparison in terms of
mean square error (MSE) of the blast cells found in
each sample:
1
N
e
∑
N
e
(Blasts
t
− Blasts
p
)
2
(2)
where N
e
is the overall number of test samples, B
t
and B
p
are the number of true and predicted blasts in
the single sample. Numerical results are proposed in
Tab. 1
VISAPP 2016 - International Conference on Computer Vision Theory and Applications
310
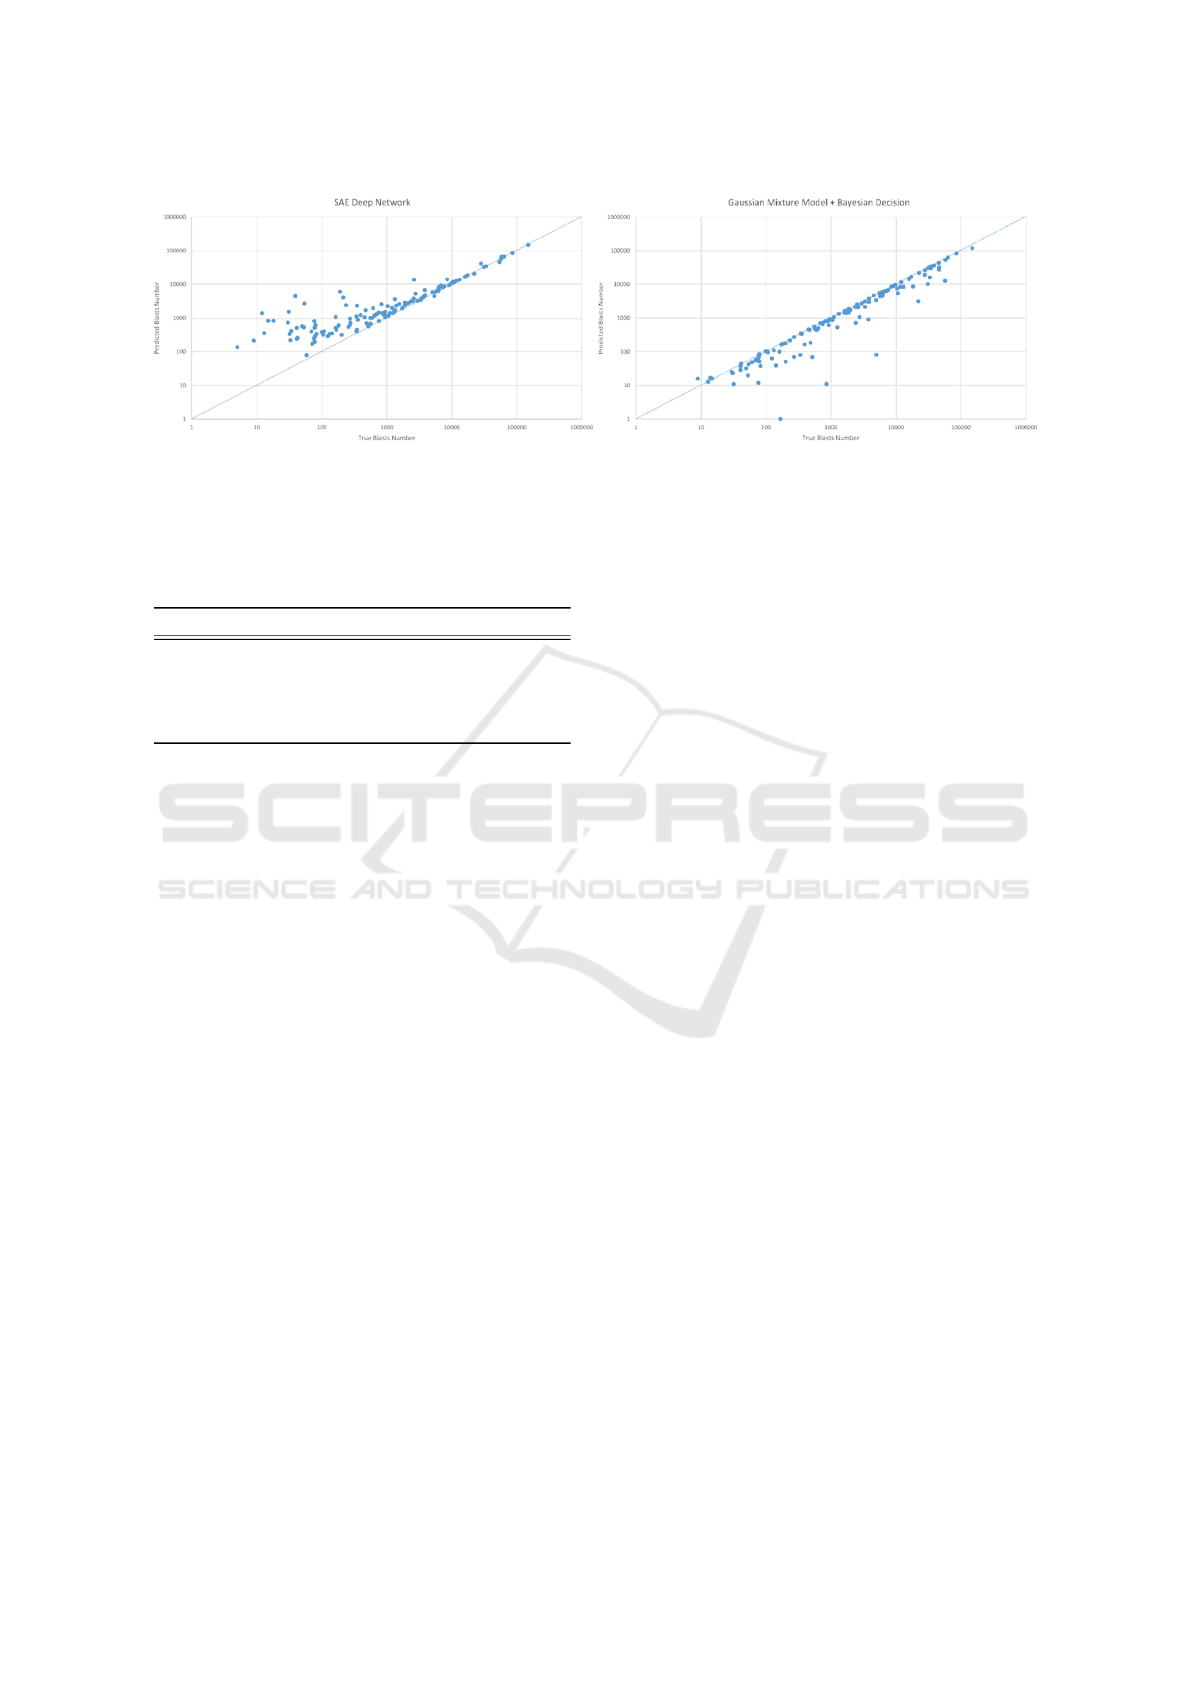
(a) (b)
Figure 6: Resulting graphs for the three approaches: (a) SAE and (c) the GMM based approach.
Table 1: The numerical results of the baseline compared to
the proposed method. The mean and variance are referred to
the absolute value of the difference between the automated
MRD and the true MRD.
Method MSE MSE Variance
SVM 0.01467 0.000637
SAE Deep Net-
work
0.00508 0.000121
GMM + Bayes
Decision
0.00891 0.000739
5 DISCUSSION
Performing an accurate MRD estimation in FCM data
with an automatic algorithm turns out to be a hard
undertaking, either using discriminative or generative
approaches. In the latter method we notice an impor-
tant tendency to underestimate the number of blasts in
the sample. This might be caused by the criticality in
finding a unique value for the component priors of the
model.
A critical drawback of the methods employed in
this work is that they construct fix decision regions,
no adaptation is provided for new unseen and com-
plicated cases. Medical experts, use interpretation,
based on their expertise in order to draw the correct
gating around the blasts events, as result of several
consideration about the whole sample. Because of
this fact, the blasts gate can be drawn in a totally
different position with respect to a similar sample.
This leads to a non negligible error from an automatic
classifier based on fix decision. This last observation
stands in favor of the generative approach since it is,
unlike the Deep Network, sample oriented, while the
other two are event oriented. In this work the Deep
network are considering all training events as part of
an unique huge sample, this becomes a drawback dur-
ing the test phase since no sample structure is learned.
In all three cases however, the resolution of the algo-
rithms, in terms of accuracy at low MRD levels (be-
low 1000 events) is not sufficient for the clinical rou-
tine.
In conclusion, as future work, we will consider an
extension of these approaches that, using the trained
model as a starting point, it will adapt to the new sam-
ple refining the inference also in the most critical zone
of the graph.
ACKNOWLEDGEMENT
AutoFLOW project is supported by the European
Commission FP7-PEOPLE-2013-IAPP 610872. We
also gratefully acknowledge NVIDIA Corporation for
the donation of the Titan X GPU used for this re-
search.
REFERENCES
Aghaeepour, N., Finak, G., Hoos, H., Mosmann, T. R.,
Brinkman, R., Gottardo, R., Scheuermann, R. H.,
Consortium, F., Consortium, D., et al. (2013). Critical
assessment of automated flow cytometry data analysis
techniques. Nature methods, 10(3):228–238.
Bashashati, A. and Brinkman, R. R. (2009). A survey of
flow cytometry data analysis methods. Advances in
bioinformatics, 2009:584603–584603.
Bengio, Y. (2009). Learning deep architectures for ai. Ma-
chine Learning, 2(1):1–127.
Bishop, C. M. (2006). Pattern recognition and machine
learning. springer.
Cimpoi, M., Maji, S., and Vedaldi, A. (2015). Deep fil-
ter banks for texture recognition and segmentation. In
Conference on Computer Vision and Pattern Recogni-
tion. IEEE.
Conigliaro, D., Rota, P., Setti, F., Bassetti, C., Conci, N.,
Sebe, N., and Cristani, M. (2015). The s-hock dataset:
Analyzing crowds at the stadium. In Conference on
Computer Vision and Pattern Recognition. IEEE.
The Role of Machine Learning in Medical Data Analysis. A Case Study: Flow Cytometry
311

Costa, E., Pedreira, C. E., Barrena, S., Lecrevisse, Q., Flo-
res, J., Quijano, S., Almeida, J., del Carmen Garcia-
Macias, M., Bottcher, S., Van Dongen, J., et al. (2010).
Automated pattern-guided principal component anal-
ysis vs expert-based immunophenotypic classification
of b-cell chronic lymphoproliferative disorders: a step
forward in the standardization of clinical immunophe-
notyping. Leukemia, 24(11):1927–1933.
Dworzak, M. N., Gaipa, G., Ratei, R., Veltroni, M., Schu-
mich, A., Maglia, O., Karawajew, L., Benetello, A.,
P
¨
otschger, U., Husak, Z., et al. (2008). Standardiza-
tion of flow cytometric minimal residual disease eval-
uation in acute lymphoblastic leukemia: Multicentric
assessment is feasible. Cytometry Part B: Clinical Cy-
tometry, 74(6):331–340.
Finak, G., Bashashati, A., Brinkman, R., and Gottardo, R.
(2009). Merging mixture components for cell popu-
lation identification in flow cytometry. Advances in
Bioinformatics, 2009.
Gonzalez-Garcia, A., Vezhnevets, A., and Ferrari, V.
(2015). An active search strategy for efficient object
class detection. In Conference on Computer Vision
and Pattern Recognition. IEEE.
Hariharan, B., Arbel
´
aez, P., Girshick, R., and Malik,
J. (2014). Hypercolumns for object segmenta-
tion and fine-grained localization. arXiv preprint
arXiv:1411.5752.
He, K., Zhang, X., Ren, S., and Sun, J. (2014). Spatial pyra-
mid pooling in deep convolutional networks for visual
recognition. In European Conference of Computer Vi-
sion. Springer.
Hofmanninger, J. and Langs, G. (2015). Mapping visual
features to semantic profiles for retrieval in medical
imaging. In Conference on Computer Vision and Pat-
tern Recognition. IEEE.
Krizhevsky, A., Sutskever, I., and Hinton, G. E. (2012). Im-
agenet classification with deep convolutional neural
networks. In Advances in neural information process-
ing systems, pages 1097–1105.
Lo, K., Brinkman, R. R., and Gottardo, R. (2008). Auto-
mated gating of flow cytometry data via robust model-
based clustering. Cytometry Part A, 73(4):321–332.
Naim, I., Datta, S., Rebhahn, J., Cavenaugh, J. S., Mos-
mann, T. R., and Sharma, G. (2014). Swift - scal-
able clustering for automated identification of rare cell
populations in large, high-dimensional flow cytometry
datasets, part 1: Algorithm design. Cytometry Part A,
85(5):408–421.
Pyne, S., Hu, X., Wang, K., Rossin, E., Lin, T.-I.,
Maier, L. M., Baecher-Allan, C., McLachlan, G. J.,
Tamayo, P., Hafler, D. A., et al. (2009). Auto-
mated high-dimensional flow cytometric data analy-
sis. Proceedings of the National Academy of Sciences,
106(21):8519–8524.
Qureshi, T. A., Hunter, A., and Al-Diri, B. (2014). A
bayesian framework for the local configuration of reti-
nal junctions. In Conference on Computer Vision and
Pattern Recognition. IEEE.
Ramanathan, V., Li, C., Deng, J., Han, W., Li, Z., Gu, K.,
Song, Y., Bengio, S., Rossenberg, C., and Fei-Fei, L.
(2015). Learning semantic relationships for better ac-
tion retrieval in images. In Conference on Computer
Vision and Pattern Recognition. IEEE.
Staal, J., Abr
`
amoff, M. D., Niemeijer, M., Viergever, M.,
Van Ginneken, B., et al. (2004). Ridge-based vessel
segmentation in color images of the retina. Medical
Imaging, IEEE Transactions on, 23(4):501–509.
Toedling, J., Rhein, P., Ratei, R., Karawajew, L., and Spang,
R. (2006). Automated in-silico detection of cell popu-
lations in flow cytometry readouts and its application
to leukemia disease monitoring. BMC bioinformatics,
7:282–282.
Vincent, P., Larochelle, H., Lajoie, I., Bengio, Y., and
Manzagol, P.-A. (2010). Stacked denoising autoen-
coders: Learning useful representations in a deep net-
work with a local denoising criterion. The Journal of
Machine Learning Research, 11:3371–3408.
Yoo, I., Alafaireet, P., Marinov, M., Pena-Hernandez, K.,
Gopidi, R., Chang, J.-F., and Hua, L. (2012). Data
mining in healthcare and biomedicine: a survey of the
literature. Journal of medical systems, 36(4):2431–
2448.
Zhang, Y., Sohn, K., Villegas, R., Pan, G., and Lee, H.
(2015). Improving object detection with deep convo-
lutional networks via bayesian optimization and struc-
tured prediction. In Conference on Computer Vision
and Pattern Recognition. IEEE.
Zheng, L., Wang, S., Tian, L., He, F., Liu, Z., and Tian, Q.
(2015). Query-adaptive late fusion for image search
and person re-identification. In Conference on Com-
puter Vision and Pattern Recognition. IEEE.
Zhou, Y., Chang, H., Barner, K., Spellman, P., and Parvin,
B. (2014). Classification of histology sections via
multispectral convolutional sparse coding. In Con-
ference on Computer Vision and Pattern Recognition.
IEEE.
Zhu, X., Suk, H.-I., and Shen, D. (2014). Matrix-
similarity based loss function and feature selection for
alzheimer’s disease diagnosis. In Conference on Com-
puter Vision and Pattern Recognition. IEEE.
VISAPP 2016 - International Conference on Computer Vision Theory and Applications
312
