
Modeling Human Motion for Predicting Usage of Hospital Operating
Room
Ilyes Sghir and Shishir Shah
Department of Computer Science, University of Houston, 4800 Calhoun Road, Houston, Texas, U.S.A.
Keywords:
Hospital Operating Room Analysis, Human Motion Modeling.
Abstract:
In this paper, we present a system that exploits existing video streams from a hospital operating room (OR) to
infer OR usage states. We define OR states that are relevant for assessing OR usage efficiency. We adopt a
holistic approach that involves the combination of two meaningful human motion features: gestures or upper
body movements computed using optical flow and whole body movements computed through motion trajecto-
ries. The two features are independently modeled for each of the defined OR usage states and eventually fused
to obtain a final decision. Our approach is tested on a large collection of videos and the results show that the
combination of both human motion features provide significant discriminative power in understanding usage
of an OR.
1 INTRODUCTION
The Operating Room (OR) is by far the most com-
plex and expensive environment within any hospital.
With the advent of technology and the increase in the
number of minimally invasive surgeries, ORs have
become high costs / high revenues assets. Nonethe-
less, their effective utilization hasn’t been fully real-
ized. Although no published formal data assessing
their performance can be found, it was estimated in
2003 that ORs generated almost half of a hospital’s
revenues while running at only 68% of their capac-
ity (Association et al., 2003). Assessing workflow
performance would significantly improve quality of
healthcare delivery and increase financial outcomes
for a hospital.
Unplanned events, inefficient supply chain man-
agement, but most importantly, lack of operational
discipline can highly affect OR performance. In fact,
start-time delays (Ciechanowicz and Wilson, 2011;
Does et al., 2009; Schuster et al., 2013), as well as,
unregulated turnover time (Kodali et al., 2014; As-
sociation et al., 2003) have been identified as major
causes of OR inefficiency. Does et al. (Does et al.,
2009) focused on the start-time delay of the first op-
eration of the day and harvested 4-weeks of data from
13 hospitals in Belgium and the Netherlands. By
defining the start-time as the time of the first inci-
sion, they concluded that delays range from 25 mins
to 103 mins (Does et al., 2009). Turnover time or
the time-lapse between 2 different surgeries lasts 30
mins on average, while in best practice it should last
only 15 mins (Association et al., 2003). Macario es-
timated in 2010 that, in US hospitals, a running OR
costs about $20/min in material supplies while gener-
ating on average $60/min in revenue (Macario, 2010).
If we approximate start-time morning delays to be 60
mins and the cost of an OR to be $2000/hour, then
a hospital with 10 ORs running 250 days a year, can
potentially save 5 million dollars each year.
According to Ciechanowicz and Wil-
son (Ciechanowicz and Wilson, 2011), regular
local audit of OR usage is important to optimize the
clinical processes within the OR and the perioperative
environment. Nonetheless, studies performed until
now have been primarily based on manual data
acquisition by nurses. Daily and automated infor-
mation about OR efficiency would be of high value
at the administrative level for continuous quality
improvement. In this paper, we present a system
that exploits existing video streams from a hospital
operating room (OR) to infer OR usage states. We
define OR states that are relevant for assessing OR
usage efficiency. We adopt a holistic approach that
involves the combination of two meaningful human
motion features: gestures or upper body movements
computed using optical flow and whole body move-
ments computed through motion trajectories. The
two features are independently modeled for each of
the defined OR usage states and eventually fused to
328
Sghir, I. and Shah, S.
Modeling Human Motion for Predicting Usage of Hospital Operating Room.
DOI: 10.5220/0005678003280335
In Proceedings of the 11th Joint Conference on Computer Vision, Imaging and Computer Graphics Theory and Applications (VISIGRAPP 2016) - Volume 4: VISAPP, pages 328-335
ISBN: 978-989-758-175-5
Copyright
c
2016 by SCITEPRESS – Science and Technology Publications, Lda. All rights reser ved

obtain a final decision. Our approach is tested on a
large collection of videos and the results show that the
combination of both human motion features provide
significant discriminative power in understanding
usage of an OR.
2 RELATED WORK
The more general problem of workflow monitor-
ing is already being addressed in more constrained
industrial environments such as car manufactur-
ing (Voulodimos et al., 2011; Veres et al., 2011;
Arbab-Zavar et al., 2014). In 2014, Arbab-Zavar et
al. (Arbab-Zavar et al., 2014) exploited shape and mo-
tion features extracted from an overhead video in or-
der to identify highly structured tasks and activities
within a car manufacturing plant. A Markov tempo-
ral structure based decision system has been proposed
in (Behera et al., 2014) to model spatio-temporal re-
lationships during object manipulations tasks and has
been tested for continuous activity recognition in as-
sembling a pump system. Yet, in ORs, dozens of
tasks are carried out by many different people and
cannot be defined as easily as in strictly designed in-
dustrial environments. Various solutions have been
proposed in the literature for enhancing OR through-
put by facilitating its management. In 2007, one of
the systems used at the MIT General Hospital was
the OR-Dashboard, which is a solution offered by a
company called LiveData (the NYP Wall of Knowl-
edge and manager, ). OR-Dashboard displays infor-
mation about the patient and the surgical procedure.
Other commercial solutions can be found such as OR-
BIT (Lange et al., 2010) or AwareMedia (Bardram
et al., 2006). More recently, in 2011, Niu et al. (Niu
et al., 2011) proposed a simulation model for perfor-
mance analysis of the OR. Unfortunately, all these so-
lutions rely on human intervention and manual data
entry.
To address this inconvenience, alternative ap-
proaches consist of leveraging electronic signals
present in the OR in order to identify automatically
its usage state without human intervention. In 2005,
Xiao et al. (Xiao et al., 2005) proposed to use patient’s
vital signs in order to monitor when the subject is in
the OR. Later on, in 2007, Bhatia et al. (Bhatia et al.,
2007) designed a system analyzing video streams to
automatically recognizing the OR state using Ma-
chine learning algorithms (SVM and HMM). In 2009,
Padoy et al. (Padoy et al., 2009) exploited a multiple-
camera system for extracting low level 3D motion fea-
tures that are ultimately fed into a workflow-HMM.
In 2010, Lange et al. (Lange et al., 2010) proposed
a phase recognition system using sensor technology.
In 2011, Nara et al. (Nara et al., 2011) introduced an
ultrasonic location aware system that tracks contin-
uously the 3D position of the surgical staff in order
to recognize discriminant human motion patterns. Fi-
nally, in 2013, Lea et al. (Lea et al., 2013) recorded
depth videos in Intensive Care Units (ICUs) using an
Xbox Kinect in order to identify tasks such as docu-
menting, checking-up on a patient, and performing a
procedure.
Unlike previous solutions, we do not introduce ad-
ditional sensors but, instead, we aim at exploiting ex-
isting cameras that are placed in modern ORs to fa-
cilitate observations and training of other physicians
and residents. The computation of 3D velocity val-
ues as suggested by Padoy et al. (Padoy et al., 2009)
would require an additional camera or a 3D sensor,
which is not commonly available in an OR. The effec-
tive utilization of video streams within the OR hasn’t
been fully realized. In fact, we opt to use motion
cues that can be computed from video obtained us-
ing a single camera. Unlike Bhatia et al. (Bhatia
et al., 2007), we do not define our OR states based
on the presence of objects in the scene (second bed,
drape on and off, etc.). We exploit physically mean-
ingful features capturing discriminant human motion
patterns. Instead of using a large ultrasonic location-
aware system like Nara et al. (Nara et al., 2011), we
take advantage of a detection algorithm based on a
discriminatively trained part-based upper-body model
developed using Felzenswalb et al.’s object detection
framework (Felzenszwalb et al., 2010b; Felzenszwalb
et al., 2010a).
3 PROPOSED APPROACH
3.1 OR Usage-state Model
Typically, when a patient is brought to an OR,
an anesthesiologist starts administrating anesthesia.
Once the patient is ready, surgeons proceed to make
the first incision (Schuster et al., 2013). At the
end of the surgical procedure, all the instruments are
wrapped up, the surgical staff proceeds to clean up,
and the patient is transferred to the recovery room.
In this paper, we propose a three-stage usage-state
transition model. Human motion patterns vary across
these states within the OR. This simple observation is
the motivation for the states in our model as shown in
figure 1.
In addition, recognizing these states can provide
additional information about the usage efficiency of
the OR. Time taken in each state can provide a holis-
Modeling Human Motion for Predicting Usage of Hospital Operating Room
329
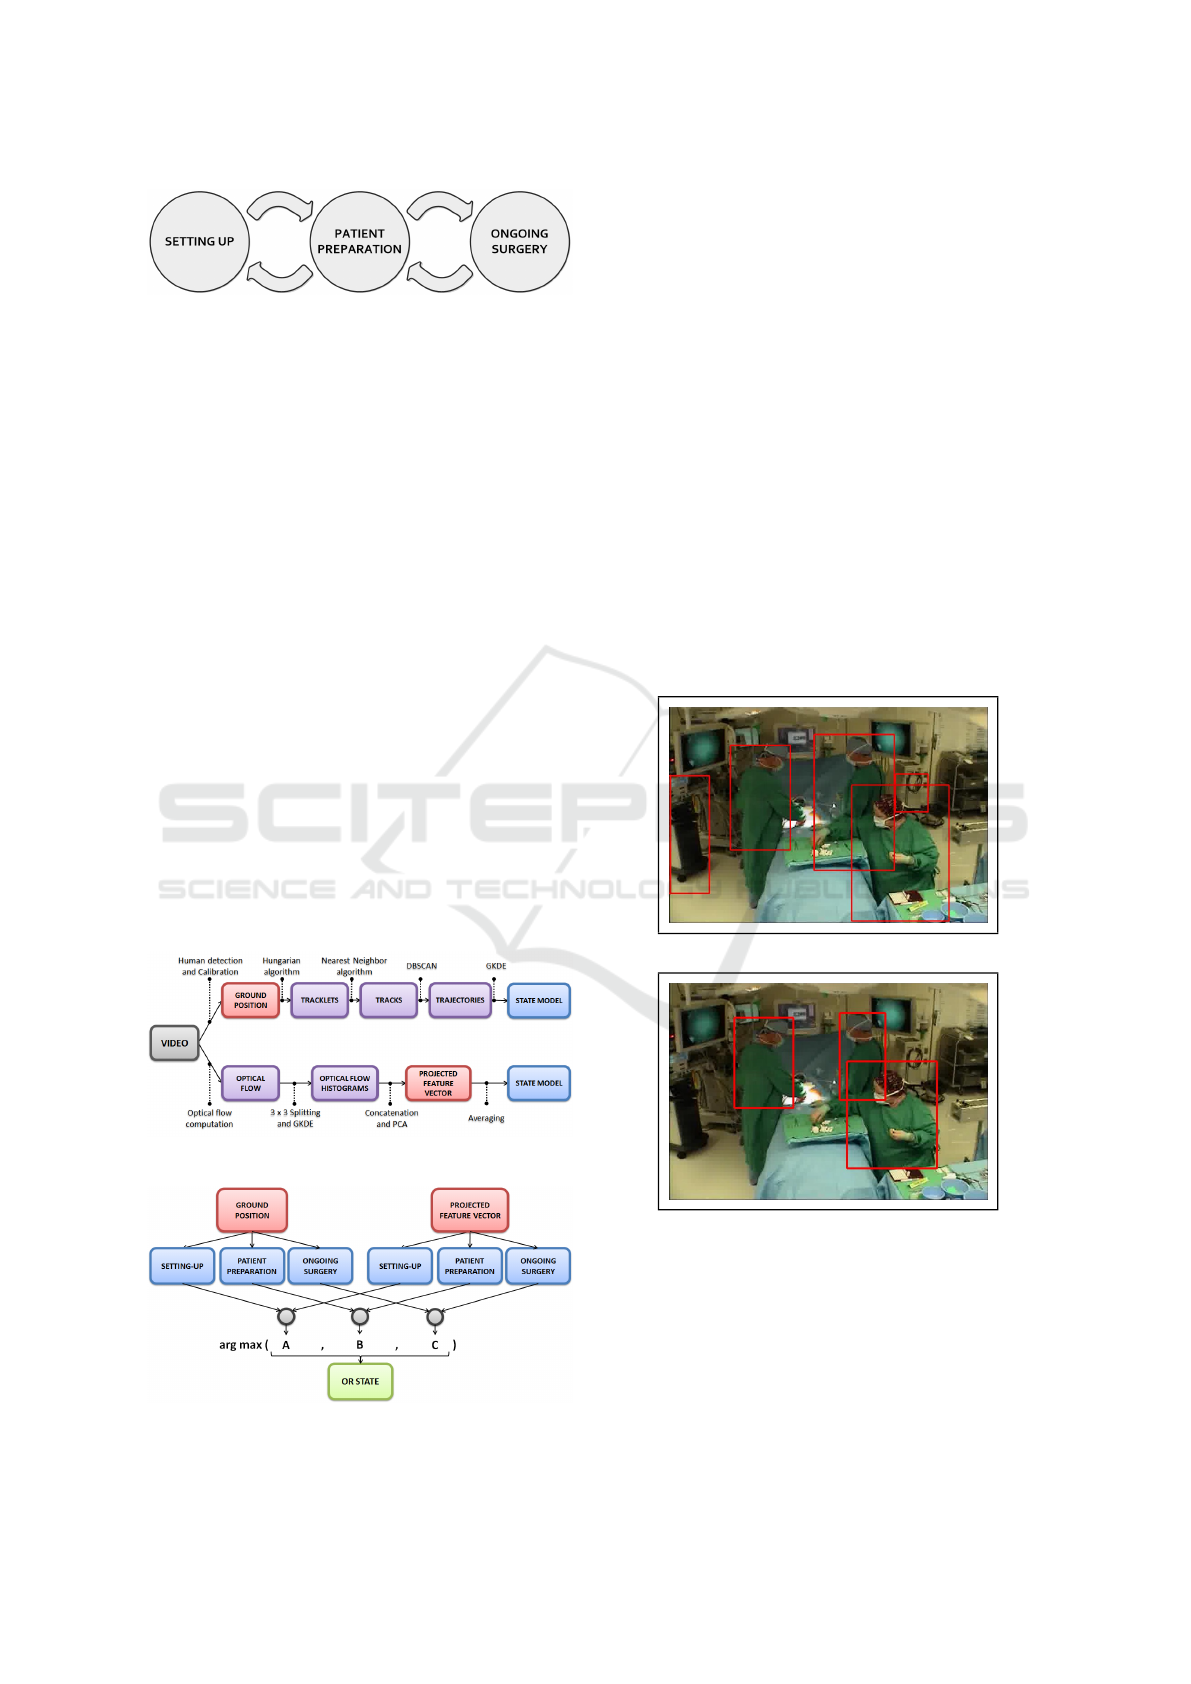
Figure 1: OR usage state transition model.
tic understanding of how the OR is utilized. Time
taken for surgeries can be compared to understand
variations is procedures. Similarly, additional usage
metrics can be derived from these recognized states
and their time data. Hence, the three-stage usage-state
model proposed is a good starting point to understand
OR usage.
3.2 Overview
The following is an overview of the proposed system.
Given a camera in an OR, we aim to model each of the
three states based on features computed from a single
video camera. We propose to use two features: the
upper body motion feature and the motion trajectory
feature. The first intends to capture small movements
or gestures perform while standing at a position in the
OR, while the second is intended to capture exhibited
walking motions in the OR. An overview of the fea-
ture computation and the estimation of a model for
each of the states is shown in Figure 2) and the use of
the models for deciding on the OR state given a new
video input is shown in Figure 3. In the following, we
provide further details about each of the modules of
the proposed approach.
Figure 2: Feature computation and model estimation.
Figure 3: Inference using proposed upper and lower body
features.
3.3 Motion Trajectory Feature
In OR videos, feet and faces are often occluded de-
pending on one’s position and orientation. Consider-
ing an upper-body detector instead of a face detector
or a human-body detector is therefore extremely rel-
evant. Obviously, image parts or upper-body features
such as gloves, masks or head protections are specific
to OR environments. Using pre-trained human de-
tectors for such an environment tend to be erroneous
and result in large number of false or missed detec-
tions (figure 4(a)). Therefore, we trained our own
upper-body model based on Felzenswalb et al.’s part-
based detector (Felzenszwalb et al., 2010b; Felzen-
szwalb et al., 2010a). Training was done over a man-
ually defined set consisting of 400 negative samples
and 800 positive samples extracted from OR videos in
each state, to obtain improved detections (figure 4(b)).
Having obtained the detected bounding boxes in
each frame, camera calibration is used to estimate
their position on the ground plane.
(a)
(b)
Figure 4: Upper-body detections using (a) a generic detec-
tor, and (b) our OR-trained model.
The method we use is based on Criminisi et al.
and Hoiem et al.’s (Criminisi et al., 2000; Hoiem
et al., 2008) work on Single View Metrology. The
reference plane is considered to be the ground, and
the parallel plane, the one that would contain the top
of the head of each person.
VISAPP 2016 - International Conference on Computer Vision Theory and Applications
330
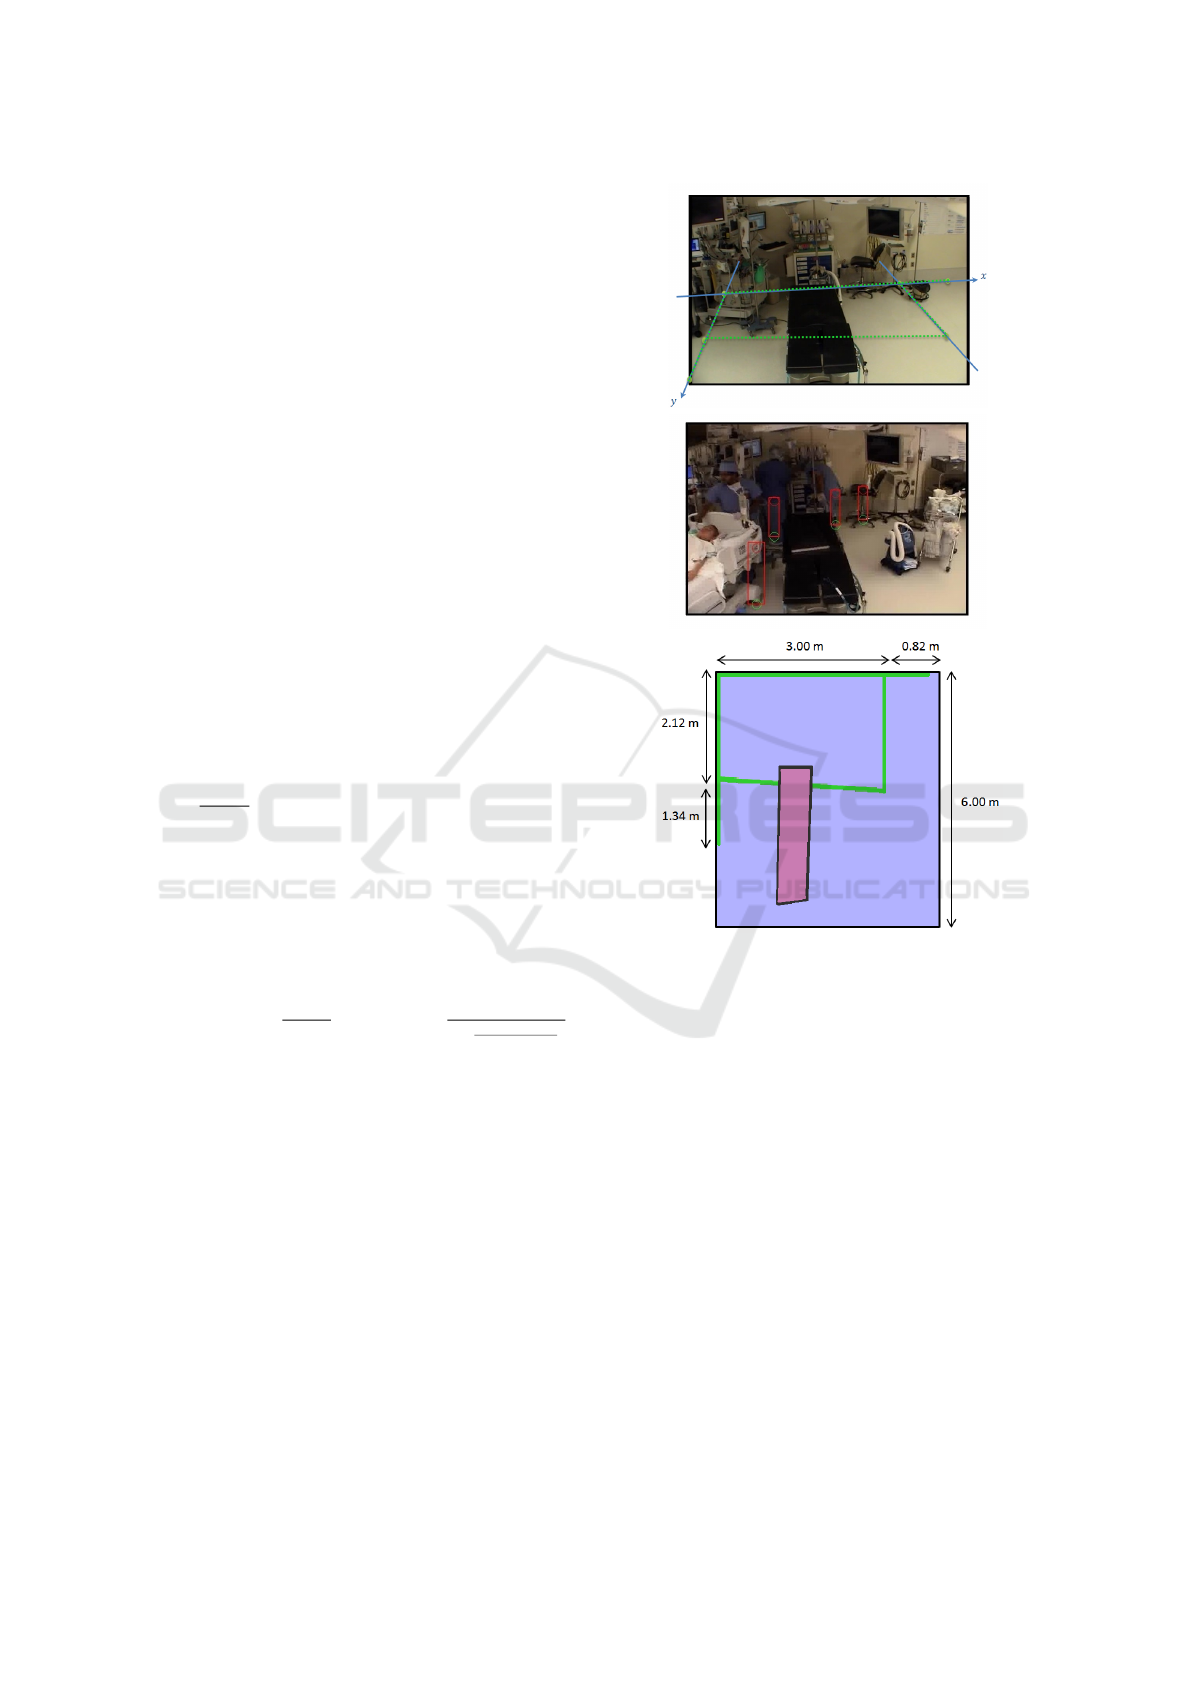
Reference plane calibration consists of computing
a homography matrix H
re f
that allows us to project
the ground points from the image plane onto the
ground plane. For that, we carefully select an im-
age of an empty OR from our dataset. Selecting an
image that offers as many lines on the floor as pos-
sible is best. A minimum of 4 corresponding points
are needed to estimate 8 unknowns from the homog-
raphy matrix. We identified 6 corresponding points,
as shown in figure 5(a), and finally computed our ho-
mography matrix H
re f
using the least square min-
imization method presented by Hartley and Zisser-
man (Hartley and Zisserman, 2003). Our next step
is to find an estimate of the image coordinate of a per-
son’s feet
u
b
, v
b
on the floor based on the detected
upper-body bounding box. Hoiem et al. (Hoiem
et al., 2008) offers a solution that allows us to get,
knowing the image coordinates of a pixel that lies
on the parallel plane, its corresponding image coor-
dinates once projected on the reference plane. Defin-
ing top
u
t
, v
t
and bottom
u
b
, v
b
points of known
objects allows us to retrieve the camera height (fig-
ure 5). Indeed, if we know the height of the object,
then the camera height y
c
can be approximated as
follows, where v
0
is the horizon line computed from
the homography matrix H
re f
(Criminisi et al., 2000):
y
c
= h
(v
0
−v
b
)
(v
t
−v
b
)
. We selected an image that contains one
or several height references such as tables or beds.
We computed several camera heights and finally com-
puted the average to be y
c
= 2.3 m. We also assume
that the average height of a person is y
p
= 1.65 m. As
suggested by Hoiem et al. (Hoiem et al., 2008), we
estimate the focal length as being 1.4 times the image
height and we adjust v
c
. Finally, we compute an es-
timate of the image coordinate v
b
of the person’s feet
as follows: v
b
=
A+v
0
y
p
A+y
p
where A =
y
c
(1+
(v
c
−v
0
)(v
c
−v
t
)
f
2
)
.
Using camera calibration information, we project the
detections in each frame to estimate the correspond-
ing ground position.
Having estimated the ground plane position for
each detected person, the next step is to obtain tra-
jectories from multiple detections. In doing so, we
first compute tracklets by solving a frame to frame as-
signment problem using the Hungarian algorithm. A
mathematical formulation is presented by Pentico in
his survey on assignment problems (Pentico, 2007).
If we consider 2 consecutive frames, l with n detec-
tions and l + 1 with m detections, we can compute
a distance matrix C = (c
i j
) where c
i j
represents the
distance between object i in frame l and object j in
frame l + 1. The Hungarian algorithm then solves
the problem by minimizing the objective function
∑
n
i=1
∑
m
j=1
c
i j
x
i j
under the constraints where x
i j
= 1
Figure 5: Calibration, (a) Ground plane outline for refer-
ence plane calibration, (b) Height references for parallel
plane calibration,(c) OR dimensions (in meters) and result-
ing table projected on the ground plane.
if the bounding box i in frame l is assigned to bound-
ing box j in frame l + 1, and x
i j
= 0 if not. Hence,
IDs are assigned to one or several bounding boxes
as they move along time. Nonetheless, due to mis-
detections, the data association solution can result in
multiple tracks for the same person. In order to deal
with that, we further cluster tracklets using the DB-
SCAN clustering algorithm (Ester et al., 1996).
We’ve chosen this algorithm as it has a physical
meaning when it comes to clustering points. In fact,
DBSCAN, Density-Based Spatial Clustering, finds
clusters based on density reachability. Two parame-
ters have to be specified: minPts, the minimum num-
ber of points that belong to a cluster and ε the radius
around a point that the algorithm has to look at for
merging. Centroids – that is, mean positions over time
of data points associated to each single track – are
Modeling Human Motion for Predicting Usage of Hospital Operating Room
331
considered for clustering. We set the minimum num-
ber of centroids to form a cluster to be minPts = 1 and
the radius to be ε = 0.5 meters. This technique allows
us to reduce the number of tracks and hence obtain
motion trajectories.
3.3.1 Model Estimation - Bivariate Gaussian
Kernel Density Estimation (GKDE)
If we consider the 2D histogram representing the spa-
tial distribution of points, we can account for the
fact that there are areas where people stay the most
or simply move through. A Kernel Density Estima-
tor (Bishop et al., 2006) provides a non-parametric es-
timate of the probability density function (pdf) g
ik
(X)
over each track X
k
=
x
k1
. . . x
kN
associated to a
state S = i as follows, where states 1, 2 and 3 are re-
spectively ”Setting-Up”, ”Patient-Preparation”, and
”Ongoing-Surgery”:
g
ik
(X) =
1
N
N
∑
n=1
1
2πh
2
exp
−
X −x
kn
2
2h
2
(1)
Basically, x
kn
’s are successively occupied ground
position throughout time by an individual in the OR.
Each and every one of them lie at the center of an
hypercube (here a square) of side h to which we asso-
ciate a kernel function. Choosing a Gaussian kernel
function results in a smoother density model where
h represents the standard deviation of the Gaussian
components. The bandwidth h is selected as sug-
gested by Bowman and Azzalini (Bowman and Az-
zalini, 2004).
The K previously computed pdfs g
ik
(X) are then
combined to give the pdf f
i
(X) characterizing the us-
age state S = i as follows, where
K
∑
k=1
π
k
is the total
number of data points associated to state S = i and π
k
the number of points in track X
k
:
∀i = 1 ... 3, f
i
(X) = p(X|S = i) =
1
K
∑
k=1
π
k
K
∑
k=1
π
k
g
ik
(X)
(2)
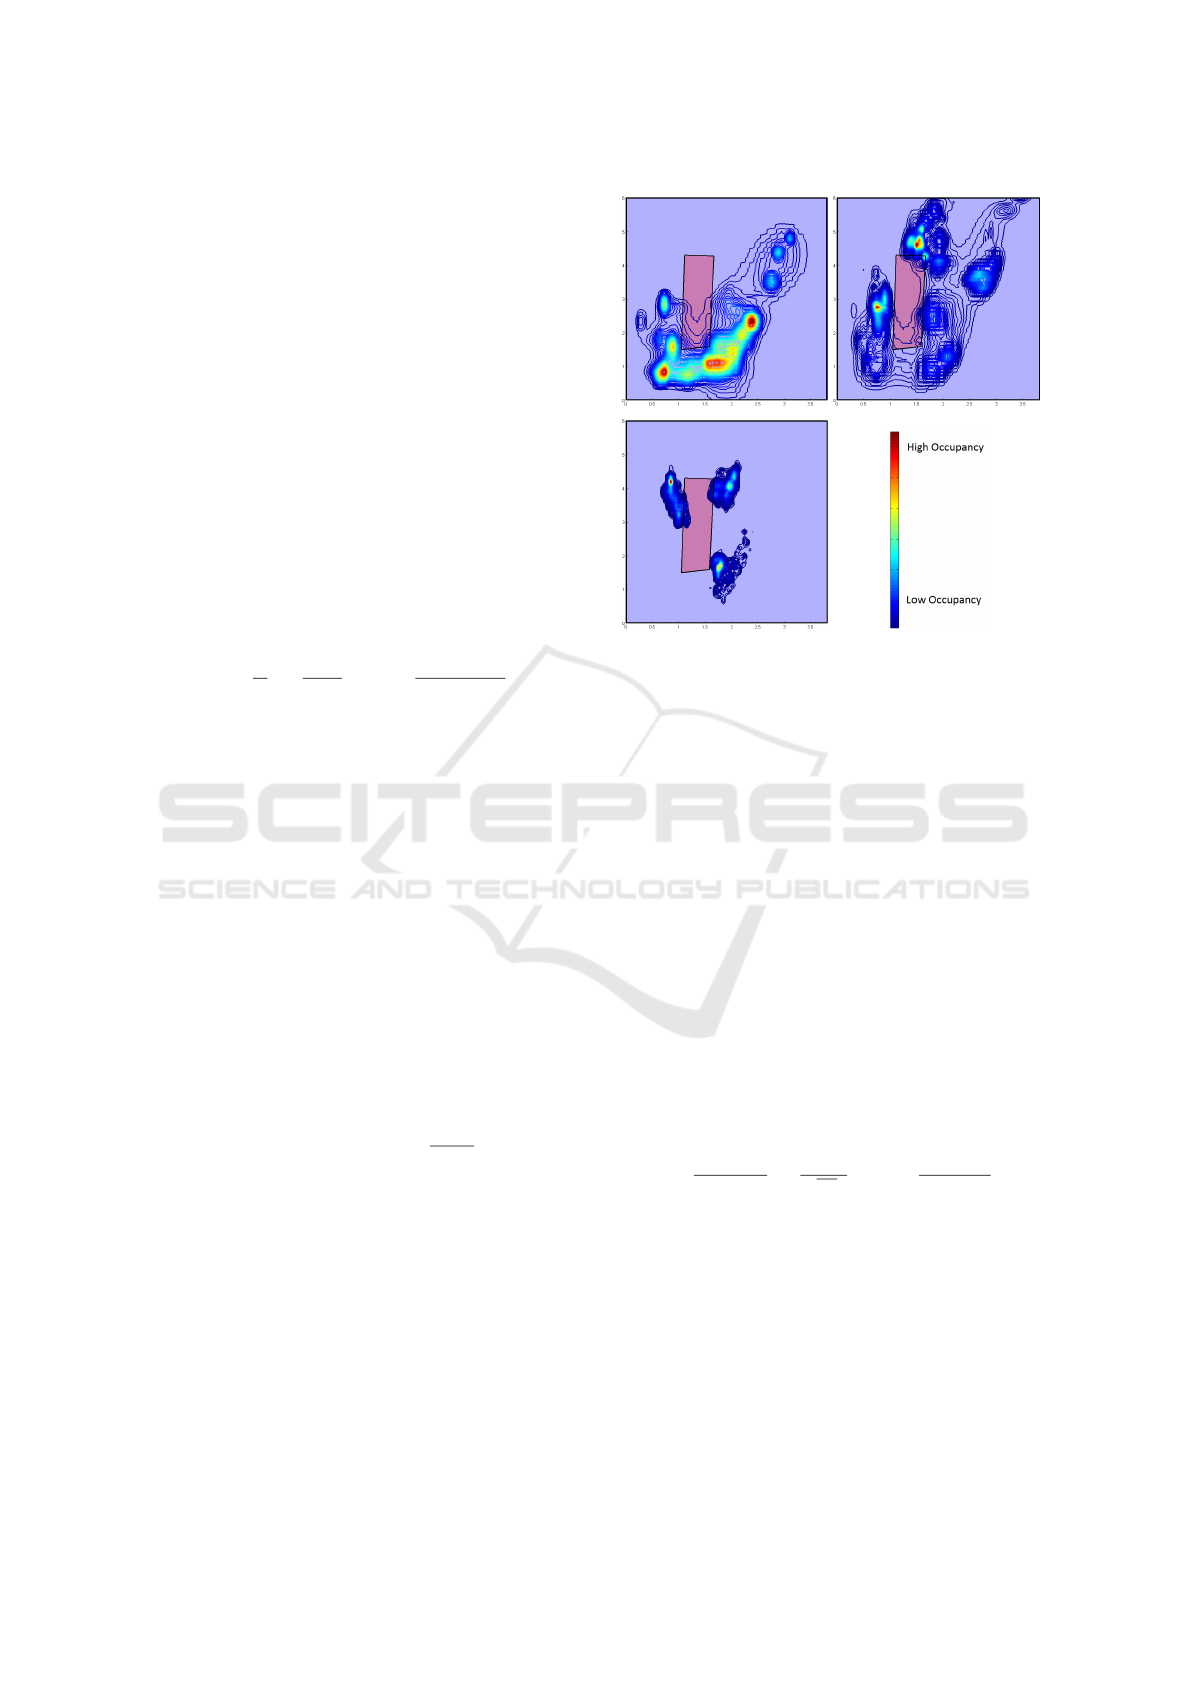
Estimated models from training data for each us-
age state is shown in Figure 6. As seen in Figure 6(a),
occupancy is spread all over the room except for the
upper left corner of the room due to the presence of
diagnostic tools. In Figure 6(b), individuals tend to
have a patient centered activity, and one can easily
notice someone positioned behind the OR table. Fi-
nally, in Figure 6(c), one can discern 2 individuals on
either sides of the OR table and an individual on the
lower right exhibiting constrained motion patterns.
(a) Setting-Up (b) Patient-Preparation
LARGE(c) Ongoing-Surgery
Figure 6: Estimated distribution of trajectories over the
three states (as seen on colorbar: High Occupancy in red,
Low Occupancy in blue).
3.4 Upper-body Movement Feature
To obtain an estimate of the upper body movements,
we extract 2D optical flow (Brox and Malik, 2011)
from localized regions over the observed space. We
split our image into a set of 3 ×3 uniformly spaced
cells. Magnitude weighted probability density func-
tions of 2D motion orientation are computed by Gaus-
sian Kernel Density Estimation in 1D (Bishop et al.,
2006) . Optical flow estimation results in N magni-
tudes and orientations (µ
n
, θ
n
) within a cell. Each one
of them is considered a sample from the underlying
distribution of motions. A Gaussian kernel, where h is
selected as suggested by Bowman and Azzalini (Bow-
man and Azzalini, 2004) (equation 3) is used to ob-
tain an estimate of the overall unknown distribution
as shown in Figure 7.
p(θ) =
1
∑
N
n=1
Nµ
n
N
∑
n=1
µ
n
√
2πh
exp
−
(θ −θ
n
)
2
2h
2
(3)
This results in 9 probability distribution functions,
one associated with each cell. These are concatenated
into a single vector that is then reduced, using PCA, to
a ”projected feature vector”. The criteria chosen for
dimensionality reduction is that 90% of information is
retained in the new orthogonal basis. Finally, to build
a model for each state i, we accumulate the projected
feature vectors by computing their overall means M
i
over the training data for each state, respectively.
VISAPP 2016 - International Conference on Computer Vision Theory and Applications
332

Figure 7: (a) 3 ×3 Splitting, (b) 2D Optical flow, (c) Local
motion probability density functions.
3.5 Usage State Decisions
Having learned the features models, given a new in-
put video stream, we need to compute a state estimate.
This is done by computing features from a set of con-
secutive image frames and matching the respective
features to each of the pre-computed models. In the
case of motion trajectory features, we compute likeli-
hood probabilities. The idea is that, assuming that we
know the model for each state, new temporal obser-
vations X = O
t
can be used to obtain evidence about
the underlying state they characterize.
p(S = i|X = O
1:n
) ∝ p(X = O
1:n
|S = i)×p(S = i) (4)
If we assume p(S = i) to be same for all states i, and
that observations are conditionally independent, then:
p(S = i|X = O
1:n
) ∝ p(X = O
1:n
|S = i)
=
n
∏
t=1
p(X = O
t
|S = i) =
n
∏
t=1
f
i
(O
t
)
(5)
As a result, for each state i, our upper-body fea-
ture is reduced into a likelihood probability value
p
i
= p(X = O
1:n
|S = i) that will later on be used for
state inference. Having learned the models, given a
new input video stream, we compute cosine similari-
ties on sub-windows of the data. In the case of upper
body movement features, given new temporal obser-
vations X = O
1:n
over the time interval [[1 : n]], we
compute the mean
¯
X. and compare it to each pre-
trained model M
i
using cosine similarity (equation 6).
d(S = i|X = O
1:n
) =
¯
X.M
i
k
¯
XkkM
i
k
(6)
Finally, for each state i, our upper-body feature is re-
duced to a cosine similarity value d
i
= d(S = i|X =
O
1:n
) that can be used for state inference.
The obtained likelihood and similarity values
across the three states from each of the two fea-
tures are first normalized and then combined for final
state prediction. The combination is based in simply
adding the normalized values for the respective states
and computing:
S = argmax
i
¯p
i
+
¯
d
i
−1
, (7)
where ( ¯p
i
,
¯
d
i
) are the normalized likelihood and nor-
malized cosine distances, respectively.
4 EXPERIMENTS
4.1 Dataset
Results presented in this paper are based on videos
taken by a single camera over different days in the
same OR. The videos were captured at a rate of
10 frames/sec, and segments identifying different us-
age states were manually annotated by the hospital
staff. The video available for each usage-state of the
OR is shown in Table 1.
Table 1: Video Database.
States Setting-Up Patient-Preparation Ongoing-Surgery
Time length 12min31sec 75min12sec 57min35sec
Number of frames 7510 45125 34552
To evaluate the accuracy of our approach, all re-
sults presented in the following are based on 10-fold
cross validation performed by considering 60% of our
data for training and 40% for testing. Nonetheless, to
compute motion trajectories as well as optical flow,
consecutive frames are needed from the video. To
facilitate training and testing, we consider a set of
frames in our data to be of length L. We randomly
select an integer n in the 40
th
percentile. Then, we
consider to be our training set the following interval:
[n, bn + 60% ×Lc]. The remaining data is then used
for testing.
4.2 Results
In making a decision for the OR usage state, a mini-
mal number of consecutive frames are needed to com-
pute necessary features prior to matching against the
feature models. Hence, shown in Figure 8 is the accu-
racy of the system as a function of consecutive frames
(ω) prior to a decision. As seen, the total accuracy in-
creases with the increase in ω and reaches ≈80% with
ω = 100. This would be equivalent to making a deci-
sion every ε = 10 seconds.
To evaluate the contribution of each of the two fea-
tures, we also evaluated the accuracy obtained when
using the individual features. As can be seen in Fig-
ure 9, different usage states are better differentiable
based on one of the two features. For example, the
motion trajectories clearly are more useful for iden-
tifying ”Ongoing Surgery” as opposed to ”Setting-
Up”, which is better recognized based on upper body
movements.
We also considered the use of a smoothing win-
dow to rule out intermediate erroneous decisions. If
we consider a smoothing window of size δ, then for
each data point S(t) at time t we define our smoothing
Modeling Human Motion for Predicting Usage of Hospital Operating Room
333
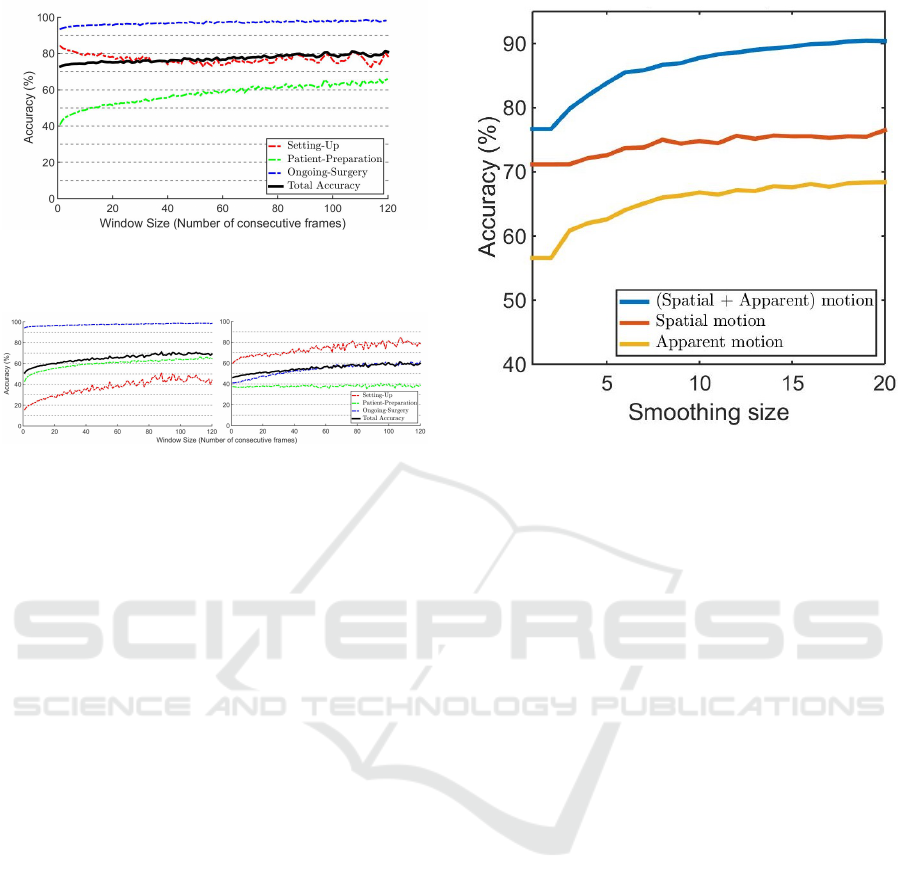
Figure 8: 10-fold Cross validation (60% training /40% test-
ing) - Accuracy as a function of number of consecutive
frames used prior to making a decision.
(a) Upper body movement feature (b) Motion trajectory feature
Figure 9: 10-fold Cross validation (60% training /40% test-
ing) - Accuracy obtained by use of the individual features
as a function of number of consecutive frames used prior to
making a decision. (a) upper body movement feature, (b)
motion trajectory feature.
window as the consecutive data points [[S(t); S(t +δ)]].
The value of S(t) is then replaced by the most oc-
curring state within the window. Figure 10 shows an
overall accuracy of ≈88% for smoothing size δ = 10
and window size ω = 60. We evaluated other combi-
nations of smoothing size and window size, but with
the chosen values, a decision of the usage state is ob-
tained every 60 seconds, which is a reasonable rate.
5 DISCUSSION AND
CONCLUSIONS
In this paper, we presented a system that exploits ex-
isting video streams from an OR to infer OR usage
states. We defined OR states that are relevant for as-
sessing OR usage efficiency. For this purpose, we
adopted a holistic approach that involves the com-
bination of two meaningful human motion features.
We took advantage of a detection algorithm as well
as a data association algorithm to reconstruct motion
trajectories. We evaluated discriminant occupancy
patterns using a kernel based method. We incorpo-
rated gesture or upper body movement information
by computing local motion histograms from 2D op-
tical flow. Our system achieved encouraging results
with an overall accuracy of ≈90%.
We evaluated the contribution of each of the two
Figure 10: 10-fold Cross validation (60% training /40%
testing) - Accuracy as a function of smoothing window size.
The number of consecutive frames = 60.
features separately and considered the number of con-
secutive frames needed to capture sufficient motion
information to differentiate the defined usage states.
We found that each of the feature provides useful
information to reduce ambiguity. The upper body
movement feature from optical flow provides extra el-
ements of information about the ”Setting-Up” state.
Basically, human motion trajectories estimate motion
of the feet. As a result, discriminant information
about the activity happening over the OR table is dis-
carded since people are typically not moving in the
OR at this state. However, the optical flow feature
is able to capture the upper body movements includ-
ing hands over the OR table. Further, hand activity
over the OR table differs when a patient is over the
table compared to that of arranging instruments and
equipment. As a result, it succeeds in discriminat-
ing the ”Patient-Preparation” state from the ”Setting-
Up” state.
Future work will involve enhancing trajectory re-
construction by exploiting image features. Further,
the independence assumption made when inferring
the usage state is rather simplistic. Therefore, tak-
ing advantage of the established usage state transition
models and exploiting time-dependent decision mod-
els will be further investigated.
REFERENCES
Arbab-Zavar, B., Carter, J. N., and Nixon, M. S. (2014). On
hierarchical modelling of motion for workflow analy-
VISAPP 2016 - International Conference on Computer Vision Theory and Applications
334

sis from overhead view. Machine vision and applica-
tions, 25(2):345–359.
Association, H. F. M. et al. (2003). Achieving operating
room efficiency through process integration. Health-
care financial management: journal of the Healthcare
Financial Management Association, 57(3):suppl–1.
Bardram, J. E., Hansen, T. R., and Soegaard, M. (2006).
Awaremedia: a shared interactive display supporting
social, temporal, and spatial awareness in surgery. In
Proceedings of the 2006 20th anniversary conference
on Computer supported cooperative work, pages 109–
118. ACM.
Behera, A., Cohn, A., and Hogg, D. (2014). Real-time ac-
tivity recognition by discerning qualitative relation-
ships between randomly chosen visual features. In
Proceedings of the British Machine Vision Confer-
ence. BMVA Press.
Bhatia, B., Oates, T., Xiao, Y., and Hu, P. (2007). Real-time
identification of operating room state from video. In
AAAI, volume 2, pages 1761–1766.
Bishop, C. M. et al. (2006). Pattern recognition and ma-
chine learning, volume 4. springer New York.
Bowman, A. W. and Azzalini, A. (2004). Applied smooth-
ing techniques for data analysis. Clarendon Press.
Brox, T. and Malik, J. (2011). Large displacement optical
flow: descriptor matching in variational motion esti-
mation. Pattern Analysis and Machine Intelligence,
IEEE Transactions on, 33(3):500–513.
Ciechanowicz, S. and Wilson, N. (2011). Delays to operat-
ing theatre lists: observations from a uk centre. The
Internet Journal of Health, 12(2).
Criminisi, A., Reid, I., and Zisserman, A. (2000). Single
view metrology. International Journal of Computer
Vision, 40(2):123–148.
Does, R. J., Vermaat, T. M., Verver, J. P., Bisgaard, S., and
Van den Heuvel, J. (2009). Reducing start time delays
in operating rooms. Journal of Quality Technology,
41(1):95–109.
Ester, M., Kriegel, H.-P., Sander, J., and Xu, X. (1996).
A density-based algorithm for discovering clusters in
large spatial databases with noise. In Kdd, volume 96,
pages 226–231.
Felzenszwalb, P. F., Girshick, R. B., and McAllester, D.
(2010a). Discriminatively trained deformable part
models, release 4.
Felzenszwalb, P. F., Girshick, R. B., McAllester, D., and
Ramanan, D. (2010b). Object detection with discrim-
inatively trained part based models. IEEE Transac-
tions on Pattern Analysis and Machine Intelligence,
32(9):1627–1645.
Hartley, R. and Zisserman, A. (2003). Multiple view geom-
etry in computer vision. Cambridge university press.
Hoiem, D., Efros, A. A., and Hebert, M. (2008). Putting
objects in perspective. International Journal of Com-
puter Vision, 80(1):3–15.
Kodali, B. S., Kim, D., Bleday, R., Flanagan, H., and Ur-
man, R. D. (2014). Successful strategies for the re-
duction of operating room turnover times in a tertiary
care academic medical center. Journal of Surgical Re-
search, 187(2):403–411.
Lange, P. M., Nielsen, K. L. G., Petersen, S. T., and
Bardram, J. E. (2010). Phase recognition in an op-
erating room using sensor technology. IT-university
of Copenhagen.
Lea, C., Facker, J., Hager, G., Taylor, R., and Saria, S.
(2013). 3d sensing algorithms towards building an in-
telligent intensive care unit. AMIA Summits on Trans-
lational Science Proceedings, 2013:136.
Macario, A. (2010). What does one minute of operat-
ing room time cost? Journal of clinical anesthesia,
22(4):233–236.
Nara, A., Izumi, K., Iseki, H., Suzuki, T., Nambu, K., and
Sakurai, Y. (2011). Surgical workflow monitoring
based on trajectory data mining. In New Frontiers in
Artificial Intelligence, pages 283–291. Springer.
Niu, Q., Peng, Q., El Mekkawy, T., Tan, Y. Y., Bruant, H.,
and Bernaerdt, L. (2011). Performance analysis of the
operating room using simulation. Proceedings of the
Canadian Engineering Education Association.
Padoy, N., Mateus, D., Weinland, D., Berger, M.-O., and
Navab, N. (2009). Workflow monitoring based on
3d motion features. In Computer Vision Workshops
(ICCV Workshops), 2009 IEEE 12th International
Conference on, pages 585–592. IEEE.
Pentico, D. W. (2007). Assignment problems: A golden
anniversary survey. European Journal of Operational
Research, 176(2):774–793.
Schuster, M., Pezzella, M., Taube, C., Bialas, E., Diemer,
M., and Bauer, M. (2013). Delays in starting morning
operating lists: An analysis of more than 20 000 cases
in 22 german hospitals. Deutsches
¨
Arzteblatt Interna-
tional, 110(14):237.
the NYP Wall of Knowledge, L. and manager, L. P.-O. Or-
dashboard.
Veres, G., Grabner, H., Middleton, L., and Van Gool, L.
(2011). Automatic workflow monitoring in indus-
trial environments. In Computer Vision–ACCV 2010,
pages 200–213. Springer.
Voulodimos, A., Kosmopoulos, D., Veres, G., Grabner, H.,
Van Gool, L., and Varvarigou, T. (2011). Online clas-
sification of visual tasks for industrial workflow mon-
itoring. Neural Networks, 24(8):852–860.
Xiao, Y., Hu, P., Hu, H., Ho, D., Dexter, F., Mackenzie,
C. F., Seagull, F. J., and Dutton, R. P. (2005). An
algorithm for processing vital sign monitoring data to
remotely identify operating room occupancy in real-
time. Anesthesia & Analgesia, 101(3):823–829.
Modeling Human Motion for Predicting Usage of Hospital Operating Room
335
