
A Priori Data and A Posteriori Decision Fusions for Human Action
Recognition
Julien Cumin and Gr
´
egoire Lefebvre
Orange Labs, R&D, Meylan, France
Keywords:
Action Recognition, Decision Fusion, Voting Methods, Dempster-Shafer Theory, Possibility Theory.
Abstract:
In this paper, we tackle the challenge of human action recognition using multiple data sources by mixing a pri-
ori data fusion and a posteriori decision fusion. Our strategy applied from 3 main classifiers (Dynamic Time
Warping, Multi-Layer Perceptron and Siamese Neural Network) using several decision fusion methods (Vot-
ing, Stacking, Dempster-Shafer Theory and Possibility Theory) on two databases (MHAD (Ofli et al., 2013)
and ChAirGest (Ruffieux et al., 2013)) outperforms state-of-the-art results with respectively 99.85% ± 0.53
and 96.40% ± 3.37 of best average correct classification when evaluating a leave-one-subject-out protocol.
1 INTRODUCTION
In the last decades, human action recognition based
on inertial or visual data sources has been an active
area of research due to its success in robotics, video
games, surveillance, etc. Nevertheless, some chal-
lenging difficulties still exist, caused by what is called
the “3V” issues (IBM et al., 2011): the action Veloc-
ity, the action Variety and the action Volume.
Action recognition requires instantaneous re-
sponses from the system, moreover if it is an interac-
tive application where actions are used as interaction
controllers. In this regard, the velocity of data gen-
eration is a major problem, imposing constraints of
execution times on algorithms.
Moreover, there is great variability about the way
people produce actions. Dynamic variations occur
when people produce intense or phlegmatic, slow or
fast gestures. Different shapes, orientations and di-
rections may then be captured from body trajectories.
These variations exist between people but also for a
single user producing the same set of actions (e.g. hu-
man ability, left or right-handed, on the move, in dif-
ferent use contexts, etc.).
Finally, volumetric variations are challenging as
well, ranging from one user in a close world paradigm
to multi-users in an open world paradigm.
Consequently, when designing a pattern recogni-
tion system, several steps are needed to deal with
these issues: processing input data in order to reduce
noise and to enhance salient information, clustering
data to reduce the dimensionality of the problem, and
learning a specific action classifier.
In this paper, we propose a human action clas-
sification system mixing a priori data fusion and a
posteriori decision-level fusion (i.e. classifier fusion)
methods.
This paper is organized as follows. In Section 2,
we present some main literature methods on action
recognition and decision fusion. In Section 3, we
explain in details our fusion strategy. Then, Section
4 shows our experimental configurations and results.
Finally, our conclusions are drawn and perspectives
are presented in the last section.
2 STATE OF THE ART
2.1 Action Recognition
Human action recognition has been deeply studied for
the past ten years. Some studies are based on iner-
tial sensors, others on visual skeleton acquisitions, or
sometimes both simultaneously.
Based on inertial data, three main strategies can
be identified. The first action recognition strategy re-
lies on similarity metrics between unknown actions
to be classified and class reference instances. One
main representative (Akl and Valaee, 2010) is a model
constructed from the Dynamic Time Warping (DTW)
similarity distance and a K Nearest Neighbor (KNN)
classifier. Others studies by (Berlemont et al., 2015)
proposed a non-linear metric learning strategy based
Cumin, J. and Lefebvre, G.
A Priori Data and A Posteriori Decision Fusions for Human Action Recognition.
DOI: 10.5220/0005680204930500
In Proceedings of the 11th Joint Conference on Computer Vision, Imaging and Computer Graphics Theory and Applications (VISIGRAPP 2016) - Volume 4: VISAPP, pages 493-500
ISBN: 978-989-758-175-5
Copyright
c
2016 by SCITEPRESS – Science and Technology Publications, Lda. All rights reserved
493

on Siamese Neural Networks (SNN). The second
strategy consists in a statistic modeling approach with
Hidden Markov Models (HMM), as in (Pylv
¨
an
¨
ainen,
2005) in order to model correlations between tempo-
ral data samples. Finally, the last strategy implies ma-
chine learning methods in order to model class fea-
tures, such as Support Vector Machines (SVM) (Wu
et al., 2009), Bayesian Networks (Cho et al., 2006) or
Recurrent Neural Networks (Lefebvre et al., 2015).
Using visual feature data, these three main strate-
gies are still relevant. Firstly, (Zhou and De la
Torre Frade, 2012) present a Generalized Time Warp-
ing (GTW) algorithm, which is an extension of the
DTW algorithm to temporally align multi-modal se-
quences from multiple subjects performing similar
activities. Secondly, (Xia et al., 2012) present an ap-
proach for human action recognition with histograms
of 3D joints locations. These features are projected
using Linear Discriminant Analysis (LDA) and clus-
tered into several posture visual words. The tempo-
ral evolutions of those visual words are then modeled
by a discrete HMM. Thirdly, a study by (Vemulapalli
et al., 2014) uses a SVM classifier to build an ac-
tion recognition system. Their approach is based on
a skeletal representation modeling the 3D geometric
relationships between body parts using rotations and
translations in 3D space. Since 3D rigid body motions
are members of the Special Euclidean group SE(3),
human actions can be modeled as curves in this Lie
group.
These previous strategies focus on one sensor and
one classifier to increase action recognition rates.
This can be viewed as a classifier selection. Few stud-
ies take into account multi-modal sources and several
classifiers to build a more robust system. (Chen et al.,
2015) present a two-level fusion approach based on
two modality sensors consisting of a depth camera
and an inertial body sensor. In the feature-level fu-
sion, features generated from the two differing modal-
ity sensors are merged before classification. In the
decision-level fusion, outcomes from two classifiers
are combined with decision fusion (in their article, us-
ing Dempster-Shafer Theory (DST)).
Inspired by this recent study, we propose to fuse
a posteriori decisions taken by classifiers, on the one
hand from individual data, and on the other hand from
a priori combined data.
2.2 Decision Fusion
In the following (see Figure 1), we assume that the fi-
nal classification should be made between c
i
classes,
with i ∈ {1, . . . , I}. We have available C
j
classi-
fiers, with j ∈ {1, . . . , J}, each giving a decision x
j
i,k
∈
[0, 1] for a class c
i
about a gesture instance G
k
, k ∈
{1, . . . , K}. A decision x
j
i,k
closer to 1 indicates a high
confidence that the instance belongs to the class c
i
,
whereas a decision closer to 0 indicates a low confi-
dence. The final decision taken by the decision fusion
method is denoted as c
d
.
classifier. Others studies by (Berlemont et al., 2015)
proposed a non-linear metric learning strategy based
on Siamese Neural Networks (SNN). The second
strategy consists in a statistic modeling approach with
Hidden Markov Models (HMM), as in (Pylv
¨
an
¨
ainen,
2005) in order to model correlations between tempo-
ral data samples. Finally, the last strategy implies ma-
chine learning methods in order to model class fea-
tures, such as Support Vector Machines (SVM) (Wu
et al., 2009), Bayesian Networks (Cho et al., 2006) or
Recurrent Neural Networks (Lefebvre et al., 2015).
Using visual feature data, these three main strate-
gies are still relevant. Firstly, (Zhou and De la
Torre Frade, 2012) present a Generalized Time Warp-
ing (GTW) algorithm, which is an extension of the
DTW algorithm to temporally align multi-modal se-
quences from multiple subjects performing similar
activities. Secondly, (Xia et al., 2012) present an ap-
proach for human action recognition with histograms
of 3D joints locations. These features are projected
using Linear Discriminant Analysis (LDA) and clus-
tered into several posture visual words. The tempo-
ral evolutions of those visual words are then modeled
by a discrete HMM. Thirdly, a study by (Vemulapalli
et al., 2014) uses a SVM classifier to build an ac-
tion recognition system. Their approach is based on
a skeletal representation modeling the 3D geometric
relationships between body parts using rotations and
translations in 3D space. Since 3D rigid body motions
are members of the Special Euclidean group SE(3),
human actions can be modeled as curves in this Lie
group.
These previous strategies focus on one sensor and
one classifier to increase action recognition rates.
This can be viewed as a classifier selection. Few stud-
ies take into account multi-modal sources and several
classifiers to build a more robust system. (Chen et al.,
2015) present a two-level fusion approach based on
two modality sensors consisting of a depth camera
and an inertial body sensor. In the feature-level fu-
sion, features generated from the two differing modal-
ity sensors are merged before classification. In the
decision-level fusion, outcomes from two classifiers
are combined with decision fusion (in their article, us-
ing Dempster-Shafer Theory (DST)).
Inspired by this recent study, we propose to fuse
a posteriori decisions taken by classifiers, on the one
hand from individual data, and on the other hand from
a priori combined data.
2.2 Decision Fusion
In the following (see Figure 1), we assume that the fi-
nal classification should be made between c
i
classes,
with i 2 {1,...,I}. We have available C
j
classi-
fiers, with j 2 {1,...,J}, each giving a decision x
j
i,k
2
[0, 1] for a class c
i
about a gesture instance G
k
, k 2
{1,...,K}. A decision x
j
i,k
closer to 1 indicates a high
confidence that the instance belongs to the class c
i
,
whereas a decision closer to 0 indicates a low confi-
dence. The final decision taken by the decision fusion
method is denoted as c
d
.
G
k
C
1
C
2
C
J
x
1
1,k
x
1
I,k
...
x
2
1,k
x
2
I,k
...
x
J
1,k
x
J
I,k
...
.
.
.
Decision
c
d
Fusion
Figure 1: The decision fusion process.
2.2.1 Voting Methods
Voting methods are based on the following principle:
each classifier C
j
adds a vote V
j
i
for each class c
i
. The
class decided by the fuser is then the one that collects
the most votes. In case of a tie, a class at random from
those with the most votes is chosen.
Voting by Majority (VM) C
j
adds a vote of 1 for
the class it has the most confidence in (i.e. the class
c
i
for which x
j
i,k
is closest to 1), and a vote of 0 for all
other classes.
Voting by Borda Count (VBC) C
j
adds a vote of
P 2 {1,...,I} for the class it has the most confidence
in, P1 for the second most confident class, . . . , 1 for
the P
th
most confident class, and 0 for all remaining
classes for which it has less confidence. If P = 1, this
VBC method is identical to VM.
Weighted Votes (VW) C
j
adds a vote of V
j
i
=
j(x
j
i,k
), with j a weighting function, taking into ac-
count the decision value. As in the Borda Count vot-
ing method, only the P 2 {1,...,I} classes the clas-
sifier has the most confidence in can vote, while the
remaining classes receive a vote of 0.
Voting by Kumar and Raj (VK) A weighted vote
approach is also presented by (Kumar and Raj, 2015).
We define the positive set X
+
i
(i.e. instances belong-
ing to a class c
i
), the negative set X
i
(i.e. instances
Figure 1: The decision fusion process.
2.2.1 Voting Methods
Voting methods are based on the following principle:
each classifier C
j
adds a vote V
j
i
for each class c
i
. The
class decided by the fuser is then the one that collects
the most votes. In case of a tie, a class at random from
those with the most votes is chosen.
Voting by Majority (VM) C
j
adds a vote of 1 for
the class it has the most confidence in (i.e. the class
c
i
for which x
j
i,k
is closest to 1), and a vote of 0 for all
other classes.
Voting by Borda Count (VBC) C
j
adds a vote of
P ∈ {1, . . . , I} for the class it has the most confidence
in, P −1 for the second most confident class, . . . , 1 for
the P
th
most confident class, and 0 for all remaining
classes for which it has less confidence. If P = 1, this
VBC method is identical to VM.
Weighted Votes (VW) C
j
adds a vote of V
j
i
=
ϕ(x
j
i,k
), with ϕ a weighting function, taking into ac-
count the decision value. As in the Borda Count vot-
ing method, only the P ∈ {1, . . . , I} classes the clas-
sifier has the most confidence in can vote, while the
remaining classes receive a vote of 0.
Voting by Kumar and Raj (VK) A weighted vote
approach is also presented by (Kumar and Raj, 2015).
We define the positive set X
+
i
(i.e. instances belong-
ing to a class c
i
), the negative set X
−
i
(i.e. instances
belonging to all the other classes) and β ∈ R a regu-
larization parameter. x
j
i,k
is set to 0 if c
i
is not the best
decided class for C
j
(meaning only the best class for
VISAPP 2016 - International Conference on Computer Vision Theory and Applications
494

each classifier is voting) and the total number of votes
V
i
of a class c
i
is then:
V
i
=
I
∑
i=1
w
j
i,k
x
j
i,k
, where (1)
w
j
i,k
= argmax
w
|R(x
j
i,k
, w)|, with (2)
R(x
j
i,k
, w) =
1
|X
−
i
|
∑
u∈X
−
i
1
1 + e
−βw
|
(x
j
i,u
−x
j
i,k
)
−
1
|X
+
i
|
∑
u∈X
+
i
1
1 + e
−βw
|
(x
j
i,k
−x
j
i,u
)
. (3)
2.2.2 Stacking Methods
Stacking methods (Wolpert, 1992) are based around
the fact that decision fusion is equivalent to a classifi-
cation task: a fusion classifier has to correctly classify
an instance using the decisions of initial classifiers as
inputs. We then build a feature vector to be learnt
by stacking methods as the concatenation of the first-
level decisions. The fusion classifier can be trained
on the same data set that was used to train the initial
classifiers. A multitude of different classifiers can be
used to perform stacking. We use two in this paper:
MultiLayer Perceptron and Support Vector Machine,
respectively referenced by SMLP and SSVM in the
experimental section (see section 4).
2.2.3 Dempster-Shafer Theory (DST)
Dempster-Shafer Theory, also called Evidence The-
ory, models data uncertainty and imprecision with
what is called mass functions.
Let Θ = {c
1
, c
2
, . . . , c
n
} be the set of classes of
the problem, and let 2
Θ
= {
/
0, {c
1
}, {c
2
}, {c
1
, c
2
},
{c
3
}, {c
1
, c
3
}, . . . , Θ} be the power set of Θ. We de-
fine a mass function m
j
associated to a source C
j
, as
follows:
m
j
: 2
Θ
7−→ [0, 1],
∑
A∈2
Θ
m
j
(A) = 1. (4)
In practice here, we use :
m
j
(A) =
x
j
i,k
∑
J
j=1
x
j
i,k
if A = {c
i
}
0 otherwise
. (5)
We can combine the mass functions of all classi-
fiers into a single mass function m. Using Smets’
combination rule (Smets, 1990), we have:
∀A ∈ 2
Θ
, m(A) =
∑
B
1
∩...∩B
k
=A
J
∏
j=1
m
j
(B
j
). (6)
The decided class c
d
is then the one that maxi-
mizes the plausibility function Pl:
c
d
= argmax
c
i
,i∈{1,...,I}
Pl({c
i
}) (7)
= argmax
c
i
,i∈{1,...,I}
∑
B∈2
Θ
,B∩{c
i
}6=
/
0
m(B)
. (8)
2.2.4 Possibility Theory (PT)
Possibility Theory, like DST, is aimed at modeling un-
certainty and imprecision in data, based on the theory
of fuzzy sets.
Let π
j
k
= {µ
j
1,k
, . . . , µ
j
I,k
} be the set of membership
degrees of an instance G
k
to classes c
i
with classifier
C
j
. The decided class c
d
is here the one with the max-
imum merged membership degree µ
d,k
, as in Equation
9.
c
d
= argmax
i∈{1,...,I}
(µ
i,k
). (9)
As in (Fauvel et al., 2007), µ
i,k
can be evaluated
as:
µ
i,k
=
v
u
u
u
u
t
J
∑
j=1
(w
j
µ
j
i,k
)
2
J
, where (10)
w
j
=
J
∑
p=0, p6= j
H
0,5
(π
p
k
)
(J − 1)
J
∑
p=0
H
0,5
(π
p
k
)
, and where (11)
H
α
(π
j
k
) =
1
2
−2α
I
I
∑
i=1
(µ
j
i,k
)
α
(1 − µ
j
i,k
)
α
. (12)
3 OUR STRATEGY
Suppose we have 3 data sources A, B and C to record
an instance we want to classify (in our case, a hu-
man action), and suppose we have 2 classifiers C
1
and
C
2
at our disposal. A basic decision fusion approach
to classify one instance would be to naively combine
(e.g. concatenate) the data produced by the 3 sources
into data ABC, and then classify the instance using C
1
and C
2
on this new combined data. The 2 sets of de-
cisions X
1
ABC
and X
2
ABC
are then combined with any of
the decision fusion methods presented in 2.2 to obtain
the final class label of the instance. This is the strategy
we will call a priori fusion in this paper. Rather than
A Priori Data and A Posteriori Decision Fusions for Human Action Recognition
495
naively combining data a priori, we can also directly
use C
1
and C
2
on A, B and C independently, resulting
in 6 sets of decisions: X
1
A
, X
1
B
, X
1
C
, X
2
A
, X
2
B
and X
2
C
,
which we will denote A + B +C. This is the strategy
we will call a posteriori fusion in this paper. We could
have also only combined two data sources (AB or AC
or BC), each resulting in two sets of decisions.
We propose to use all those different approaches
simultaneously in the decision fusion process. Rather
than feeding a decision fusion method with only 2 sets
of decisions on ABC, or 6 sets of decisions on A +
B +C, we can use A + B +C + AB + AC + BC + ABC,
resulting in 14 sets of decisions to combine. This ap-
proach only exploits available data and does not re-
quire to use any additional source.
This strategy is motivated by the idea that some
data sources can be more discriminant for certain
classes than others. For example, for an action con-
sisting of a hand rotation around the axis of the fore-
arm, the skeleton data will probably not describe the
gesture well, because the skeleton is itself the axis of
rotation. A gyrometer or accelerometer sensor placed
on the hand of the user, on the other hand, will pro-
duce data that will feature well the gesture since it
will be subject to the rotation of the hand. Con-
versely, there can be actions that would be easily de-
scribed with skeleton data, while inertial data would
be less useful to classifiers. If we combine a pri-
ori both of those data sources, the classifiers can use
both information to reach better classification perfor-
mances than when using only one of the sources, but
the task of identifying which of the two data is more
helpful to classify this specific instance relies only on
the classifiers. Using decisions taken on data fused a
priori, as well as on each data source independently,
the task of identifying which data is helpful to clas-
sify the instance is shared between the classifiers and
the decision fusion method, since it now has access
to decisions taken on each data source independently.
While the use of decisions taken on each data source
independently may worsen the classification rates of
the decision fusion method for certain classes that are
well featured by all sources, we believe it can signif-
icantly improve the rates of classification of the de-
cision fusion method for classes that are only well-
captured by some sources, and weakly featured by
others.
This process can thus exploit the complementarity
of data sources, which will better discriminate classes
depending on their nature (e.g. accelerations vs joint
trajectories) or their placement (e.g. two accelerome-
ters placed on the hand and on the hip will not equally
discriminate a hand rotation).
4 EXPERIMENTAL RESULTS
4.1 Experiments on MHAD
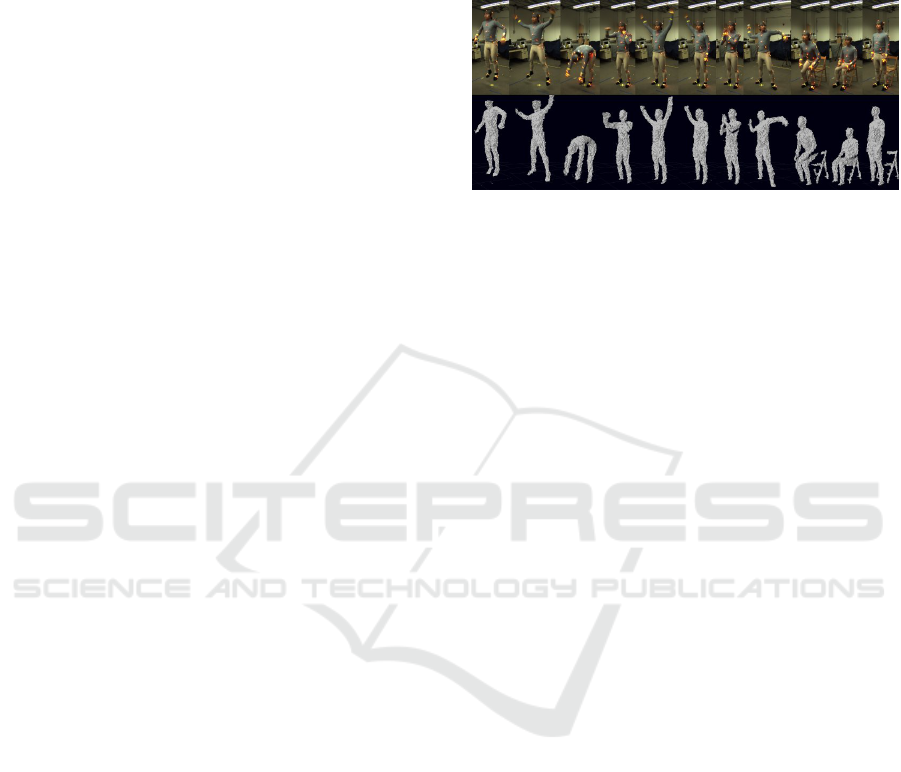
Figure 2: Snapshots from all the actions available in the
Berkeley MHAD displayed together with the correspond-
ing point clouds obtained from the Kinect depth data. Ac-
tions (from left to right): jumping, jumping jacks, bending,
punching, waving two hands, waving one hand, clapping,
throwing, sit down/stand up, sit down, stand up.
The Berkeley MHAD (Multimodal Human Action
Database (Ofli et al., 2013), see Figure 2) contains 11
actions performed by 7 male and 5 female subjects
in the range 23-30 years of age except for one el-
derly subject. All the subjects performed 5 repetitions
of each action, yielding about 660 action sequences
which correspond to about 82 minutes of total record-
ing time.
The specified set of actions consists of the follow-
ing: (1) actions with movement in both upper and
lower extremities (e.g. Jumping in place, Jumping
jacks, Throwing, etc.), (2) actions with high dynam-
ics in upper extremities (e.g. Waving hands, Clapping
hands, etc.), and (3) actions with high dynamics in
lower extremities (e.g. Sit down, Stand up).
4.1.1 Protocols and Method Configurations
We use a leave-one-subject-out cross-validation pro-
cess to test our fusion strategy. Thus, for each cross-
validation, all samples from 11 subjects (i.e. 605 in-
stances) are used as a training set, and all samples
from the remaining subject constitute the test set (i.e.
55 instances). A validation set is extracted from 10%
of the training set to optimize β of the VK method
(it can also be used to optimize certain parameters of
other fusion methods, which is not done here for the
datasets presented). Thus the training data for the fu-
sion methods only consist of 90% of the actual total
training set.
After some preliminary studies on the available 6
accelerometers data and 27 joints skeleton data, we
keep 4 main data sources to build our system: the left
hand accelerometer (noted A1) and the right hip ac-
celerometer (A4), as in (Chen et al., 2015), as well
VISAPP 2016 - International Conference on Computer Vision Theory and Applications
496
as the right hand joint trajectory (M20) and the left
hand joint trajectory (M27), which are natural joints
to track in an action recognition system.
Our fusion method evaluation is based on 3 main
action classifiers: DTW, MLP and SNN. The follow-
ing classifiers and decision fusion methods use the
corresponding parameters :
• DTW: low-pass filter of parameter 0.8 on raw data
and KNN using K=1;
• MLP: fixed input vectors of size 100 from the con-
catenation of normalized raw data, 45 hidden neu-
rons with a learning rate of 0.005 and 200 epochs;
• SNN (Berlemont et al., 2015): fixed input vectors
of size 100 from the concatenation of normalized
raw data, 45 hidden neurons with a learning rate
of 0.00005 and 200 epochs;
• VM: V
c
= 1;
• VBC: P = 11 voting classes;
• VW : V
c
= 0.15 +
0.85
1+e
−7.68(x−0.68)
and P = 11 voting
classes;
• VK: β is selected in the set {10
−4
, . . . , 10
5
} to
maximize classification rates on the validation set;
• SMLP (Hall et al., 2009): 45 hidden neurons,
learning rate = 0.2, momentum = 0.1, 100 epochs;
• SSVM (Hall et al., 2009): C = 256, γ = 0.001;
• PT: α = 0.5.
Those parameters were experimentally evaluated
(using the same 10% validation set logic) on a purely
symbolic gesture database containing accelerometer
and gyrometer data only, and were not chosen to be
optimal for the MHAD database (or the ChAirGest
database presented after).
4.1.2 Inertial and Vision-based Classification
Table 1 presents the average classification rates and
standard deviations on isolated data: A1, A4, M20
and M27. It is remarkable to see that for each data
Table 1: Isolated data: average classification rates and stan-
dard deviation for standard decision fusion.
A1 A4 M20 M27
DTW 79.01 ± 10.69 56.54 ± 14.45 88.75 ± 7.55 61.24 ± 8.89
MLP 81.75 ± 9.40 61.10 ± 10.29 89.51 ± 9.27 76.44 ± 11.68
SNN 82.05 ± 9.91 62.76 ± 10.46 91.34 ± 6.74 75.22 ± 10.07
VM 85.39 ± 9.46 65.49 ± 10.84 92.55 ± 7.14 75.53 ± 10.56
VBC 87.81 ± 9.18 61.56 ± 15.04 92.10 ± 7.77 76.44 ± 10.75
VW 85.08 ± 7.60 65.20 ± 10.87 90.42 ± 8.61 76.73 ± 11.39
VK 86.59 ± 9.53 64.90 ± 11.09 92.40 ± 5.61 74.76 ± 9.90
SMLP 84.03 ± 8.09 65.35 ± 12.20 90.58 ± 8.28 79.78 ± 10.50
SSVM 83.72 ± 8.24 64.58 ± 10.14 90.42 ± 8.11 78.41 ± 11.30
DST 83.72 ± 7.75 62.31 ± 10.51 90.27 ± 8.48 77.04 ± 11.40
PT 83.42 ± 8.15 62.47 ± 10.71 90.42 ± 8.47 76.43 ± 11.67
Table 2: Concatenated data: average classification rates and
standard deviations on a priori decision fusion.
A1A4 M20M27 A1A4M20M27
VM 82.07 ± 8.43 95.13 ± 4.87 96.64 ± 3.96
VBC 83.73 ± 8.95 94.83 ± 5.14 96.04 ± 3.39
VW 85.39 ± 7.90 93.76 ± 6.12 94.97 ± 5.69
VK 80.86 ± 8.93 94.38 ± 5.61 96.95 ± 3.25
SMLP 87.52 ± 7.77 93.91 ± 6.42 94.81 ± 5.74
SSVM 87.97 ± 7.36 93.61 ± 6.58 94.81 ± 5.76
DST 85.85 ± 6.52 93.91 ± 6.45 94.66 ± 6.07
PT 85.40 ± 7.61 94.06 ± 6.37 94.97 ± 5.46
source, multiple strategies of decision fusion give bet-
ter results than the best first-level classifier. For in-
stance, VBC achieves the best results on A1, VM on
A4 and M20, and SMLP on M27 data. The best over-
all classification rate is achieved by VM on M20 with
92.55% ± 7.14, which is better than the best original
classifier (SNN) with 91.34% ± 6.74 on M20.
4.1.3 A Priori Data Fusion
Table 2 presents, from concatenated data, the aver-
age classification rates and standard deviations of de-
cision fusion methods from 3 classifiers (DTW, MLP,
SNN) on A1 and A4 concatenated, on M20 and M27
concatenated, and on A1, A4, M20 and M27 con-
catenated. This table shows that most decision fusion
methods benefit from a priori data concatenation. For
example, SSVM achieves 87.97% ± 7.36 from A1A4
data which is better than the results it obtained on
A1 (87.81% ± 9.18) or A4 (65.49% ± 10.84) (see
Table 1). The methods that show worse classifica-
tion rates are actually weakly impacted compared to
the results on A1, which shows that decision fusion
methods are relatively robust to data that contains
non-discriminative parts. The best overall classifica-
tion rate is achieved by VK on all concatenated data
A1A4M20M27 with 96.95% ± 3.25.
4.1.4 A Posteriori Classifier Fusion
Table 3 presents, from separated data, the average
classification rates and standard deviations with clas-
Table 3: Separated data: average classification rates and
standard deviations on a posteriori decision fusion.
A1+A4 M20+M27 A1+A4+M20+M27
VM 90.11 ± 6.60 91.35 ± 8.24 98.18 ± 2.01
VBC 89.04 ± 7.62 91.95 ± 7.38 97.71 ± 3.22
VW 92.09 ± 5.63 94.98 ± 5.33 99.39 ± 1.11s
VK 92.54 ± 5.08 95.90 ± 4.32 96.34 ± 3.02
SMLP 91.02 ± 5.79 94.82 ± 5.50 98.32 ± 2.21
SSVM 90.41 ± 5.13 93.45 ± 6.36 98.17 ± 2.32
DST 88.89 ± 8.03 94.08 ± 6.28 96.66 ± 4.35
PT 91.33 ± 5.18 94.68 ± 5.43 98.93 ± 1.67
A Priori Data and A Posteriori Decision Fusions for Human Action Recognition
497
sifier fusion methods. A posteriori decision fusion
gives here better average classification rates for each
configuration. For instance, when we fuse first-level
classifier decisions on separated M20 and M27 data,
we obtain 95.90% ± 4.32 for VK, which is higher
than 95.13% ± 4.87 presented before (see Table 2) on
M20M27 concatenation.
4.1.5 Mixed Fusion Strategies
Table 4 presents our strategy from mixed data us-
ing both a priori data and a posteriori decision fu-
sion. The best average classification rate is reached
at 99.85% ± 0.53 by the VW decision fusion method
on separated data (A1+A4+M20+M27), plus partially
concatenated data (A1A4+M20M27), plus all con-
catenated data (A1A4M20M27). These results are
significantly better than 99.39% ± 1.11 presented in
Table 3.
Table 4: Mixed data: Average classification rates and stan-
dard deviations of decision fusion methods from 3 classi-
fiers (DTW, MLP, SNN) on A1, A4, M20 and M27 mixed.
A1+A4+M20+M27
+A1A4+M20M27
A1+A4+M20+M27
+A1A4+M20M27
+A1A4M20M27
VM 98.48 ± 2.43 98.94 ± 2.12
VBC 98.63 ± 2.93 98.78 ± 2.73
VW 99.24 ± 1.20 99.85 ± 0.53
VK 96.80 ± 3.13 97.56 ± 2.85
SMLP 99.24 ± 2.62 99.09 ± 2.63
SSVM 98.78 ± 2.73 99.09 ± 2.63
DST 97.57 ± 4.99 97.87 ± 4.51
PT 98.93 ± 2.74 99.54 ± 1.13
4.1.6 Previous Published Results
(Chen et al., 2015) propose on this database a fu-
sion approach based on two differing modality sen-
sors (depth and inertial data). Their best results for
a leave-one-subject-out evaluation is a classification
rate of 99.54% fusing Kinect depth stream and A1
and A4 inertial sensors data with a SRC (Sparse Rep-
resentation Classifier) method. Our strategy is conse-
quently challenging with 99.85% ± 0.53 correct clas-
sification at best. We then prove on a second dataset
the repeatability of our strategy.
4.2 Experiments on ChAirGest
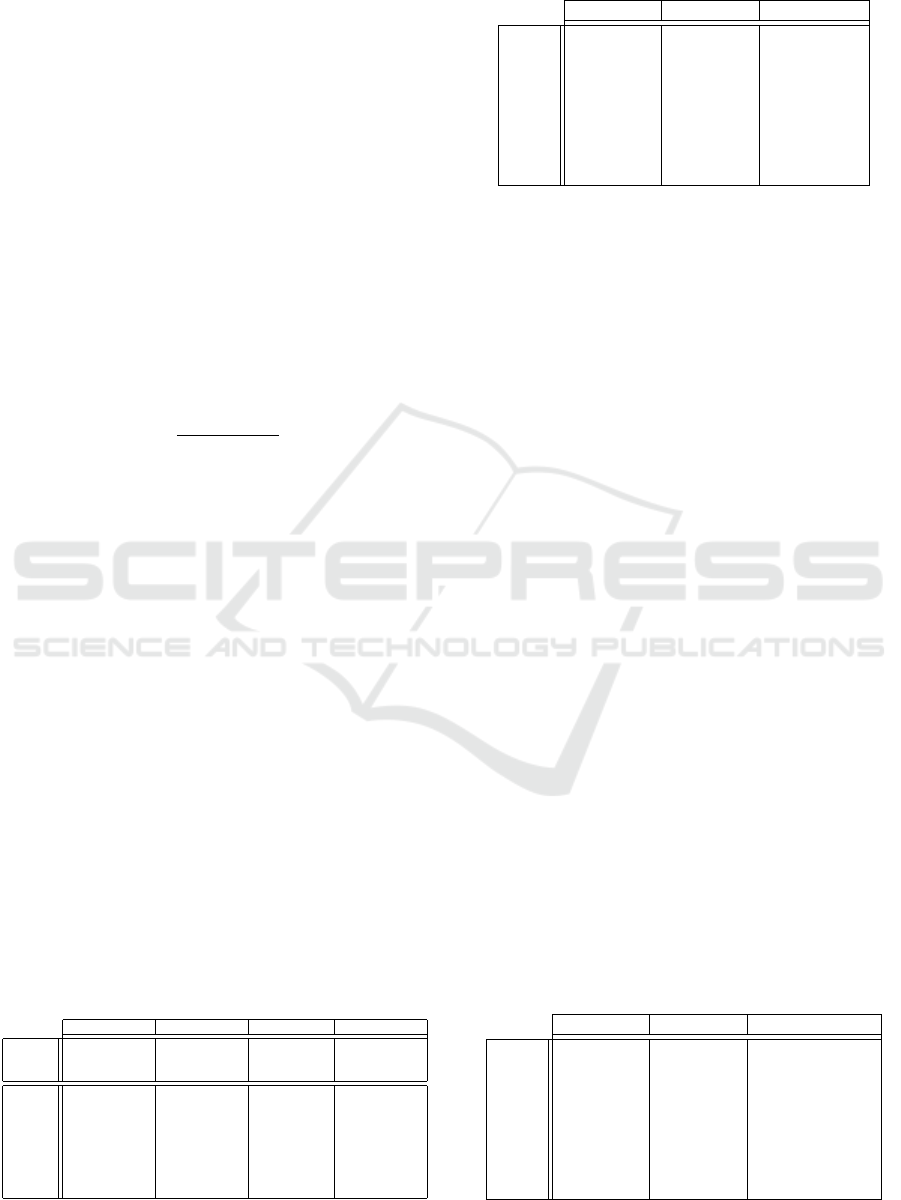
The ChAirGest Dataset (Ruffieux et al., 2013)
contains 6 hours of continuous multi-modal record-
ings. Data have been acquired from a Kinect camera
and 4 Inertial Motion Units (IMUs) attached to the
right arm of the subject (see Figure 3). The dataset
Figure 3: Two sample images captured by the Kinect RGB
stream, where 4 IMUs are fixed on the participant’s arm.
contains 10 different gestures, started from 3 different
resting postures and recorded in two different lighting
conditions by 10 different subjects. The 10 gestures
considered in the corpus are the following: Swipe
left, Swipe right, Push to screen, Take from screen,
Palm-up rotation, Palm-down rotation, Draw a circle
I, Draw a circle II, Wave hello and Shake hand.
4.2.1 Protocols and Method Configurations
As in the previous experiment, we use a leave-one-
subject-out cross-validation to test our system. Thus,
for each cross-validation, all samples from 9 subjects
(i.e. 450 instances) are used as a training set, and all
samples from the remaining subject constitute the test
set (i.e. 50 instances). Classifiers and fusion meth-
ods configurations are identical to the ones used on
MHAD, described in section 4.1.1. We use here the 4
accelerometers data (A1, A2, A3 and A4) and 3 joint
skeleton data K2, K6, and K10, corresponding respec-
tively to the head, the left hand and the right hand.
4.2.2 Our Results
Table 5: Accelerometer data: Average classification rates
and standard deviations.
A1A2A3A4 A1+A2+A3+A4
VM 76.40 ± 11.23 87.00 ± 6.48
VBC 79.40 ± 9.93 89.00 ± 5.35
VW 75.80 ± 10.26 87.40 ± 4.90
VK 77.20 ± 10.63 82.20 ± 4.85
SMLP 81.40 ± 9.89 83.20 ± 6.74
SSVM 73.20 ± 8.95 78.20 ± 7.20
DST 57.40 ± 9.52 79.00 ± 9.20
PT 64.20 ± 7.97 82.80 ± 5.27
Table 5 shows a comparison between a priori
data and a posteriori decision fusion based on 4 ac-
celerometers. The best average classification rate for
the second approach is VBC with 89.00% ± 5.35,
as opposed to the first approach where it is SMLP
with 81.40% ± 9.89. We see that each decision fu-
sion method is significantly better on A1+A2+A3+A4
compared to A1A2A3A4, which is a trend that was
already existing on the MHAD dataset.
VISAPP 2016 - International Conference on Computer Vision Theory and Applications
498
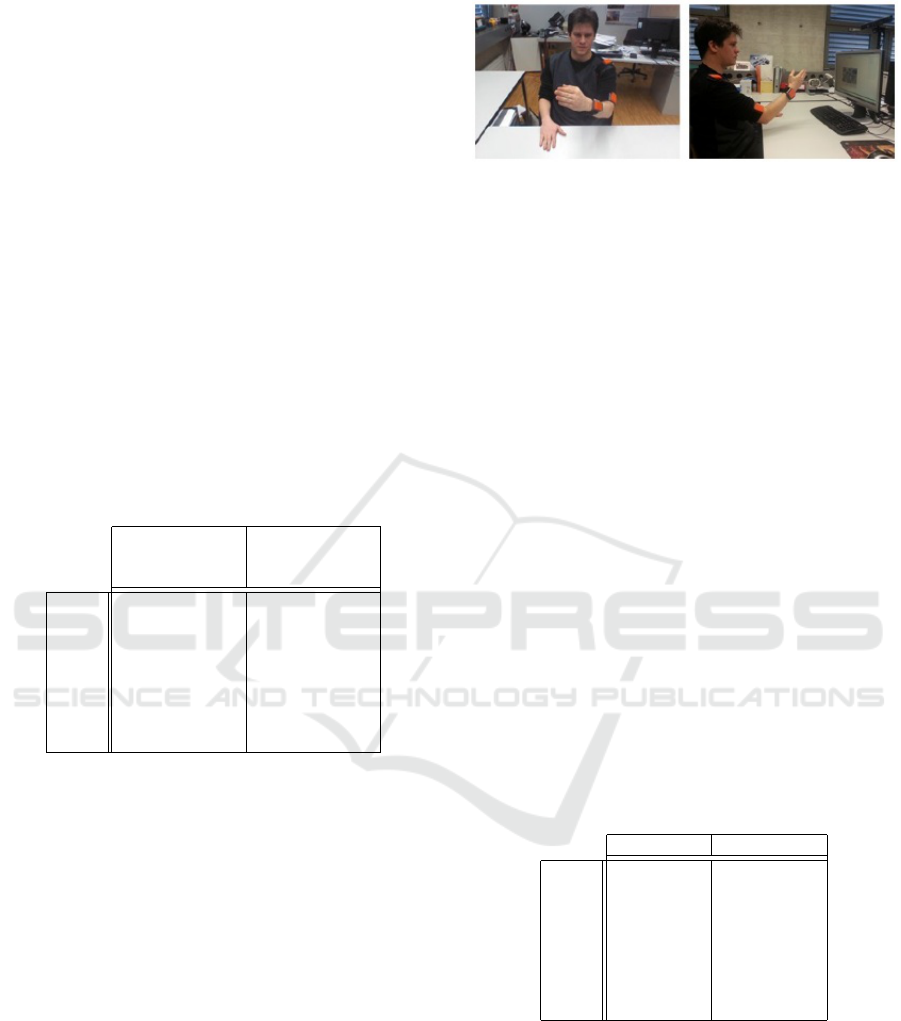
Figure 4: Average classification rates and standard deviations of classifiers on individual data and of decision fusion methods
on A1+A2+A3+A4+K2+K6+K10.
Table 6: Kinect data: Average classification rates and stan-
dard deviations.
K2K6K10 K2+K6+K10
VM 93.40 ± 3.27 94.80 ± 3.68
VBC 93.60 ± 3.77 93.60 ± 3.97
VW 93.40 ± 3.53 93.20 ± 3.91
VK 93.80 ± 4.05 94.00 ± 5.33
SMLP 90.40 ± 3.75 92.00 ± 3.89
SSVM 89.80 ± 3.94 91.20 ± 3.68
DST 90.40 ± 4.60 90.20 ± 5.37
PT 90.60 ± 3.78 92.20 ± 4.57
Table 6 proposes similar results on Kinect data
with again better classification rates for the second ap-
proach (e.g. 94.80% ± 3.68 for VM) compared to the
first one (93.80% ± 4.05 for VK). However, standard
deviations are bigger in the second approach; both ap-
proaches are thus quite equivalent for those data.
Table 7: Mixed data: Average classification rates and stan-
dard deviations.
A1A2A3A4
K2K6K10
A1+A2+A3+A4
+K2+K6+K10
A1+A2+A3+A4
+K2+K6+K10
+A1A2A3A4
+K2K6K10
+A1A2A3A4K2K6K10
VM 89.60 ± 6.02 95.40 ± 4.15 96.40 ± 3.37
VBC 90.40 ± 4.88 94.60 ± 4.62 96.20 ± 3.58
VW 88.40 ± 7.35 94.20 ± 3.82 96.20 ± 3.46
VK 89.80 ± 6.14 91.80 ± 4.62 93.20 ± 4.02
SMLP 91.00 ± 4.45 93.60 ± 4.30 95.20 ± 4.13
SSVM 90.00 ± 4.11 92.40 ± 4.20 94.40 ± 3.75
DST 81.20 ± 11.04 88.60 ± 6.47 89.60 ± 6.31
PT 83.00 ± 9.39 93.60 ± 3.86 95.60 ± 3.62
Figure 4 presents means and standard deviations
for each method when applying decision fusion on
separated data A1+A2+A3+A4+K2+K6+K10. It is
remarkable to see that all decision fusion methods but
DST outperform a first-level classifier selection. For
instance, the DTW classifier achieves a classification
rate of 91.00% ± 4.64 on K6, while VM achieves
95.40% ± 4.12 using all separated data sources.
The final results are presented in Table 7. The best
overall average classification rate is 96.40% ± 3.37
for the VM method, with our strategy mixing both a
priori data and a posteriori decision fusion.
4.2.3 Previous Published Results
(Cao et al., 2015) published results on the ChAirGest
dataset. With the exact same leave-one-subject-out
cross-validation strategy we used in this paper, they
attain at best a classification rate of 91.84% ± 5,76.
Our approach performs significantly better for all de-
cision fusion methods, bar DST, with results as high
as 96.40% ± 3.37 for the VM fusion method.
(Yin and Davis, 2013) also published previous re-
sults on the ChAirGest dataset. They attain an average
final classification rate of 91.16%. Here, our evalua-
tion protocol are quite different (we believe that ours
is more challenging), nevertheless our best configura-
tion performs better (96.40% ± 3.37).
5 CONCLUSIONS AND
PERSPECTIVES
In this paper, we tackle the challenge of human ac-
tion recognition by mixing a priori data fusion and
a posteriori decision fusion. Our strategy applied
from 3 main classifiers (DTW, MLP and SNN) on two
databases (MHAD (Ofli et al., 2013) and ChAirGest
A Priori Data and A Posteriori Decision Fusions for Human Action Recognition
499

(Ruffieux et al., 2013)) matches or even outperforms
state-of-the-art results. Note that the classification
rates consistently increased at each step, from stan-
dard decision fusion all the way up to our mixed fu-
sion strategy, for all decision fusion methods we stud-
ied, which highlights the benefits of our approach.
Our perspectives are to extend our solution to dis-
ambiguate some human actions: two gesture classes
where frontiers are fuzzy (e.g. heart and clockwise
symbolic gestures); two gesture classes where one
source is relevant and the other data source gives no
salient information (e.g. limbs rotations, identifiable
by inertial systems but not with skeleton based trajec-
tories); or using both strong and weak classifiers, in
order to evaluate the impact of extremely low perfor-
mance classifiers on our approach of decision fusion.
REFERENCES
Akl, A. and Valaee, S. (2010). Accelerometer-based gesture
recognition via dynamic-time warping, affinity propa-
gation, & compressive sensing. In IEEE International
Conference on Acoustics, Speech and Signal Process-
ing (ICASSP).
Berlemont, S., Lefebvre, G., Duffner, S., and Garcia, C.
(2015). Siamese neural network based similarity met-
ric for inertial gesture classification and rejection.
IEEE International Conference on Automatic Face
and Gesture Recognition.
Cao, C., Zhang, Y., and Lu, H. (2015). Multi-modal
learning for gesture recognition. In Multimedia and
Expo (ICME), 2015 IEEE International Conference
on, pages 1–6.
Chen, C., Jafari, R., and Kehtarnavaz, N. (2015). Improv-
ing human action recognition using fusion of depth
camera and inertial sensors. IEEE Transactions on
Human-Machine Systems, 45(1):51–61.
Cho, S.-J., Choi, E., Bang, W.-C., Yang, J., Sohn, J.,
Kim, D. Y., Lee, Y.-B., and Kim, S. (2006). Two-
stage Recognition of Raw Acceleration Signals for 3-
D Gesture-Understanding Cell Phones. In Lorette, G.,
editor, Tenth International Workshop on Frontiers in
Handwriting Recognition.
Fauvel, M., Chanussot, J., and Benediktsson, J. A. (2007).
Decision fusion for hyperspectral classification. John
Wiley & Sons, New York, NY, USA.
Hall, M., Frank, E., Holmes, G., Pfahringer, B., Reutemann,
P., and Witten, I. H. (2009). The weka data mining
software: An update. In SIGKDD Explorations, vol-
ume 11.
IBM, Zikopoulos, P., and Eaton, C. (2011). Understanding
Big Data: Analytics for Enterprise Class Hadoop and
Streaming Data. McGraw-Hill Osborne Media.
Kumar, A. and Raj, B. (2015). Unsupervised fusion weight
learning in multiple classifier systems. CoRR arXiv.
Lefebvre, G., Berlemont, S., Mamalet, F., and Garcia, C.
(2015). Inertial gesture recognition with BLSTM-
RNN. In Artificial Neural Networks, volume 4
of Springer Series in Bio-/Neuro-informatics, pages
393–410. Springer International Publishing.
Ofli, F., Chaudhry, R., Kurillo, G., Vidal, R., and Bajcsy,
R. (2013). Berkeley MHAD: A comprehensive Mul-
timodal Human Action Database. In IEEE Workshop
on Applications of Computer Vision, pages 53–60.
Pylv
¨
an
¨
ainen, T. (2005). Accelerometer Based Gesture
Recognition Using Continuous HMMs Pattern Recog-
nition and Image Analysis. volume 3522 of Lecture
Notes in Computer Science, chapter 77, pages 413–
430. Berlin, Heidelberg.
Ruffieux, S., Lalanne, D., and Mugellini, E. (2013).
ChAirGest: A Challenge for Multimodal Mid-air Ges-
ture Recognition for Close HCI. In Proceedings of the
15th ACM International Conference on Multimodal
Interaction, ICMI ’13, pages 483–488.
Smets, P. (1990). The combination of evidence in the trans-
ferable belief model. IEEE Transactions on Pattern
Analysis and Machine Intelligence, 12(5):447–458.
Vemulapalli, R., Arrate, F., and Chellappa, R. (2014). Hu-
man action recognition by representing 3d skeletons
as points in a Lie group. In The IEEE Conference on
Computer Vision and Pattern Recognition (CVPR).
Wolpert, D. H. (1992). Stacked generalization. Neural net-
works, 5(2):241–259.
Wu, J., Pan, G., Zhang, D., Qi, G., and Li, S. (2009). Ges-
ture recognition with a 3-d accelerometer. In Ubiq-
uitous Intelligence and Computing, volume 5585 of
Lecture Notes in Computer Science, pages 25–38.
Springer Berlin Heidelberg.
Xia, L., Chen, C.-C., and Aggarwal, J. (2012). View invari-
ant human action recognition using histograms of 3d
joints. In IEEE Computer Vision and Pattern Recog-
nition Workshops (CVPRW), pages 20–27.
Yin, Y. and Davis, R. (2013). Gesture spotting and recogni-
tion using salience detection and concatenated hidden
markov models. In Proceedings of the 15th ACM on
International Conference on Multimodal Interaction,
ICMI ’13, pages 489–494.
Zhou, F. and De la Torre Frade, F. (2012). Generalized time
warping for multi-modal alignment of human motion.
In IEEE Conference on Computer Vision and Pattern
Recognition (CVPR).
VISAPP 2016 - International Conference on Computer Vision Theory and Applications
500
