Electrocardiogram Signal Analysing
Delineation and Localization of ECG Component
Ouadi Beya
1
, Mohamad-Mazen Hittawe
1
, Nacira Zegadi
2
, Eric Fauvet
1
and Olivier Laligant
1
1
Le2i CNRS-UMR6306, University of Burgundy, 12 rue de la Fonderie, 71200 Le Creusot, France
2
CARDiags, 47 rue Andr
´
e Bollier, 69007 Lyon, France
Keywords:
Signal Processing, NFLS, ECG, QRS Complex, Waves Delineation.
Abstract:
In this paper, we develop a new approach based on nonlinear filtering scheme (NLFS) on cardiac signal
to evaluate a robust single-lead electrocardiogram (ECG) delineation system and waves localization method
based on nonlinear filtering approach. This system is built in two phases, in the first phase, we proposed a
mathematical model for detecting ECG features like QRS complex peak, P and T-waves onsets and ends from
noise free of synthetic ECG signal. Later, we develop a theoretical model to obtain real approach for detecting
these features from real noisy ECG signals. Our method has been evaluated on electrocardiogram signals of
QT-MIT standard database, the QRS peak achieve sensitivity (Se) of 98.88 and a positive productivity (P+) of
98.43. For P-onset, P-end, T-end evaluations, this approach provides Sensitivity (Se) of 75.16, 71, and 90.7
respectively. Mean and standard deviation have been computed for differences between the automatic and
manual annotations.
1 INTRODUCTION
The analysis of the ECG is widely used for diagnosing
many cardiac diseases. Since most of the clinically
useful information in the ECG is found in the inter-
vals and amplitudes defined by its significant points
(wave peaks and boundaries), the development of ac-
curate, fast and robust methods for automatic and real
time ECG delineation is one of basic research filed in
biomedical engineering domain. As a matter of fact,
QRS detection is necessary to determine the heart rate
and as a reference for beat alignment. ECG wave de-
lineation provides fundamental features (amplitudes
and intervals) to be used in automatic analysis system.
We can distinguish two main groups of algorithm in
the topic of ECG features extraction. They are QRS
detection algorithms and ECG waves delineation al-
gorithms. QRS complex is the most notable wave
in ECG signal which represents the duration of ven-
tricular depolarization. Its high amplitude and steep
slope make QRS detection easier than other waves.
Thus it is generally used as a reference within the
cardiac cycle. Many algorithms and approaches are
proposed to solve QRS detection problem. A compre-
hensive review and classification these algorithms can
be found in (Kohler et al., 2002). Concerning P and
T-waves delineation, most algorithms start from pre-
defined QRS complex and take a search window on
the left and right of QRS complex to detect P and T-
waves features onset, peak, and end respectively. Be-
cause of the low energy of P and T-waves, low signal
to noise ratio, amplitude and morphological variabil-
ity and possible overlapping of the P or T-wave with
QRS complex, it is more difficult to delineate P and
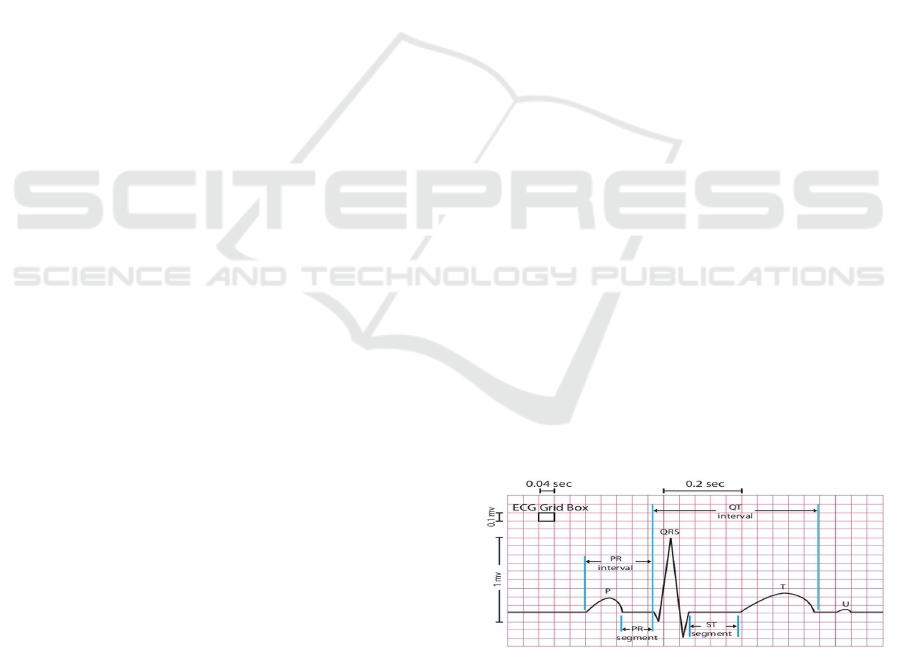
T-waves than QRS complex. Fig. 1 shows ECG signal
interpretation with waves (P, T, U) and QRS complex
position, different interval and waves delineation are
indicated with the medical scale reference.
Figure 1: Normal ECG signal representation composed by
P wave, QRS complex, T wave, U wave. Different intervals
are shown with the medical scale reference.
In the literature, several approaches for P and T-
waves delineation can be found. Approach of Lie et
al (Lin et al., 2011) used Bayesian model, where as
Mehta et al (Chouhan and Mehta, 2008) proposed a
156
Beya, O., Hittawe, M-M., Zegadi, N., Fauvet, E. and Laligant, O.
Electrocardiogram Signal Analysing - Delineation and Localization of ECG Component.
DOI: 10.5220/0005684501560161
In Proceedings of the 9th International Joint Conference on Biomedical Engineering Systems and Technologies (BIOSTEC 2016) - Volume 4: BIOSIGNALS, pages 156-161
ISBN: 978-989-758-170-0
Copyright
c
2016 by SCITEPRESS – Science and Technology Publications, Lda. All rights reserved
new method using Support Vector Machine approach,
likewise Martinez et al (Martinez et al., 2004) intro-
duced wavelet-based delineation algorithm. The val-
idation of the most recent algorithms for QRS detec-
tion is based on standard database, but most of P and
T-waves delineation approaches are not evaluated on
standard databases. Thus leads to problem in compar-
ing performance of these methods accurately. In this
work, we present a new approach to detect QRS com-
plex peak, P and T-waves onset/end points. The per-
formance is validated on the QT MIT database (La-
guna et al., 1997). This paper is organized as follows:
in Section 2, the concept of 1D Nonlinear Filtering
Scheme (1D NLFS) will be explained, then we will
present the mathematical model for features extrac-
tion from free of noise synthetic ECG signal in Sec-
tion 3. In Section 4, the real approach for features
detection derived from previous mathematical model
will be presented. Section 5 contains evaluation and
testing for this approach and a comparison with other
methods results. Conclusion and future works will be
presented in Section 6.
2 1D NON LINEAR FILTERING
SCHEME (NLFS)
In 1D NLFS presented in (Laligant and Truchetet,
2010), Laligant et al propose to achieve edge detec-
tion and noise reduction in one stage using nonlinear
derivative approach. This approach solved the prob-
lem of delocalization that appears in derivative ap-
proaches as well. In this scheme, author proposed to
localize the edge according to the sign of the transi-
tion slope. If the slope is positive, the edge will be lo-
calized after the transition; if the slope is negative, it
will be localized before. For decomposing the signal,
two detector filters are introduced F
+
(z) and F
−
(z)
regularized without zero in the center and are given
in Equation 1 :
F
+
(z) = 1 −z
−1
; F
−
(z) = −F(z − 1) (1)
Author used a nonlinear operator T as a threshold
for selecting the response. This scheme gives two sig-
nals given in equation 2: Y
+
which contains response
for positive slope edge points, and Y
−
which contains
negative slope edge points.
Y
+
= T (F
+
(z)S(z)) ; Y
−
= −T (F
−
(z)S(z)) (2)
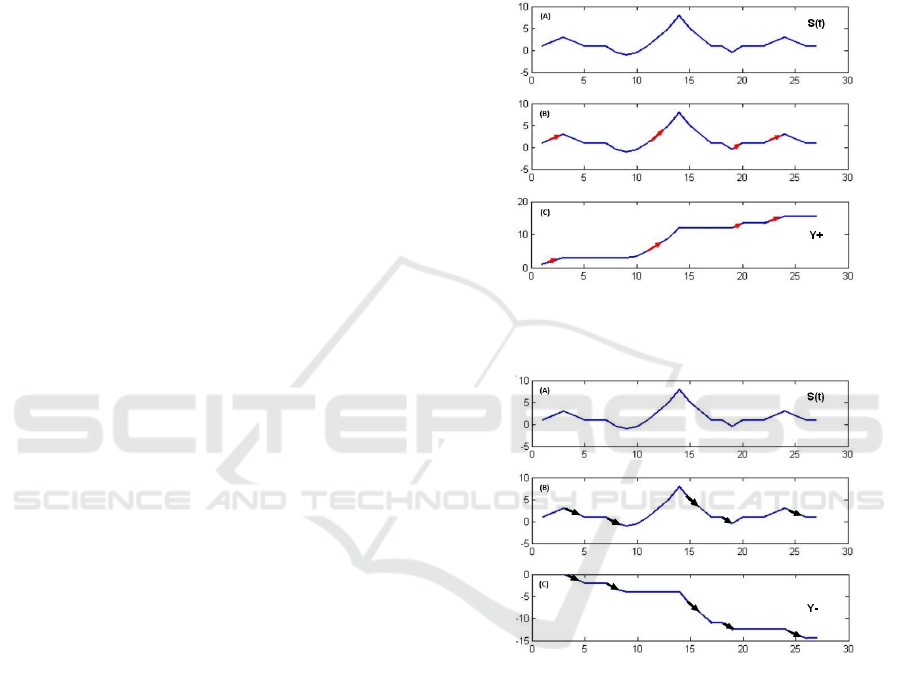
We can simplify this approach as follow. Two
derivative filtering processes of the signal are applied
in two different directions. In each direction only
the transitions with the same slope sign are retained
as shown in the Fig. 2 and Fig. 3. The complexity
of edge detection problem is reduced to the half by
splitting the signal into two signals. This approach
reduces the edge detection complexity into half by
splitting the whole signal into two signals, each sig-
nal contains only one type of transitions; either with
positive or negative slope.
Figure 2: (A) Original signal S(t), (B) local positions of
increasing changes of S(t), (C) Y+ signal corresponds to
localization positions of increasing changes of S(t).
Figure 3: (A) Original signal S(t), (B) local positions of
decreasing changes of S(t), (C) Y- signal corresponds to the
positions of decreasing changes of S(t).
3 MATHEMATICAL MODEL
In this section, the mathematical model of our method
that exploits Y
+
, Y
−
signals to detect QRS peak, P
and T-waves Onset/End points will be presented. This
model will be built upon free of noise synthetic ECG
signal generated by a dynamical model method pre-
sented in (McSharry et al., 2003). Two main algo-
rithms will be discussed in this model, two main al-
gorithms, the first one for QRS peak detection, and
the second for detecting onset/end of P and T-waves.
Electrocardiogram Signal Analysing - Delineation and Localization of ECG Component
157
3.1 QRS Complex Detection
The detectig of QRS peak is the starting point for any
ECG signal analysis process. So in this model, it will
be detected as follows: Applying 1D NLFS on ECG
signal to get Y
+
signal. Differentiating Y
+
signal to get
to di fY + signal. Then, di f Y + will be thresholded
to set all its values that are under threshold to zero,
whereas threshold value is 60% of the max value in
di fY + signal. The T di fY + signal is obtained, this
signal contains a series of Gaussian peaks, each one
of them corresponds to one QRS first rising half (QR
segment). Linear search process within T di fY + will
be applied and the end of each peak gives the index
of QRS peak after shifting it by two samples forward.
Shifting forward is applied to compensate the part of
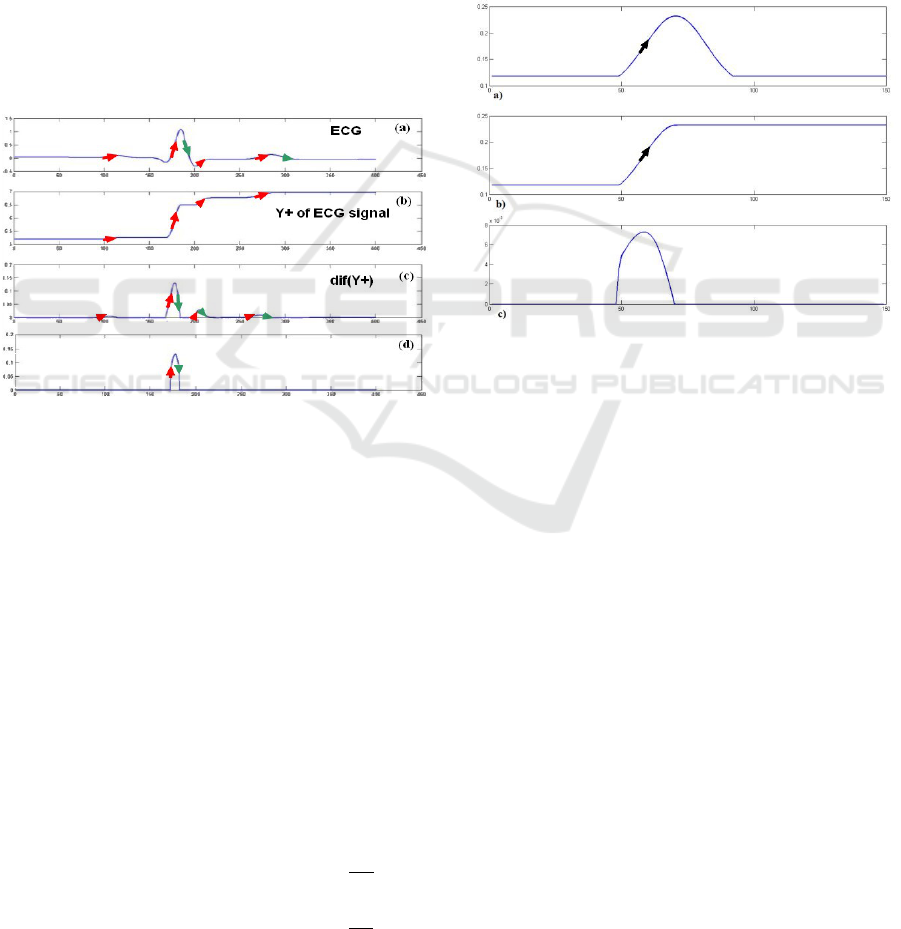
peaks eliminated in thresholding step. Fig. 4 shows
QRS peaks detections algorithm steps.
Figure 4: (a) Original ECG signal , (b) Y+: increasing
changes of ECG signal, (c) dif (Y+): differentiation of Y+
signal, (d) TdifY+: threshold of dif(Y+) signal in order to
obtain QRS complex localization.
3.2 P and T Waves Localization
QRS peak detection is used to determine boundaries
of search windows that should contains P,T-waves.
This search window falls on the right of QRS com-
plex from T-wave and on the left from P-wave. Af-
ter considering features of synthetic ECG model that
represents free of noise normal ECG signal, bound-
aries of P and T-waves search window will be given
by Equations (3) and (4). Once localized peaks R po-
sitions (Pos(R)) in QRS complex, we determine lim-
itations (start and end positions) of search windows
which should contain the airwaves P and T.
P
on
= Pos(R) − 40ms; P
end
= Pos(R) −
RR
2
(3)
T
on
= Pos(R) + 40ms; T
end
= Pos(R) +
RR
2
(4)
Where (P
on
, T
on
) and (P
end
, T
end
) represent respec-
tively beginnings and ends of search windows that we
want to detect onset/end points. RR represents the
distance between two adjacent QRS peaks. The con-
stant 40ms is determined via experiments on normal
synthetic ECG signal. For onset point detection, The
part of Y+ signal that falls between w0 , w1 will be
differentiated to give a feature signal that all its values
are zeros except Gaussian peak starts at the onset of
P or T-wave and end at the peak of P or T-wave. Lin-
ear search through this feature signal will be applied
to find start of this Gaussian peak that corresponds to
onset point. For end point detection, the part of Y-
Figure 5: (a) P wave form, (b) Y+ signal corresponds to
the positions of increasing changes of P wave, (c) dif(Y+)
differentiation of Y+ signal.
signal that falls between w0 , w1 will be differenti-
ated to give a feature signal that all its values are ze-
ros except Gaussian peak starts at the peak and ends at
the end of P or T-wave. Linear search on this feature
signal to detect the end of this peak that corresponds
to end point will be applied. Fig. 5 and Fig. 6 show
an example for of P-wave onset/end detection steps
respectively. This mathematical model faces several
challenges in real ECG signals like noise and variable
morphologies of P and T- waves. These challenges
make it inapplicable on real ECG signals. So, start-
ing from this model we developed our approach for
detecting QRS peak, P and T-waves onset/end points
from real noisy ECG signals that will be presented in
next section.
4 REAL ECG FEATURES
EXTRACTION APPROACH
The backbone of this approach is the previous pre-
sented theoretical model. Real approach will show the
BIOSIGNALS 2016 - 9th International Conference on Bio-inspired Systems and Signal Processing
158
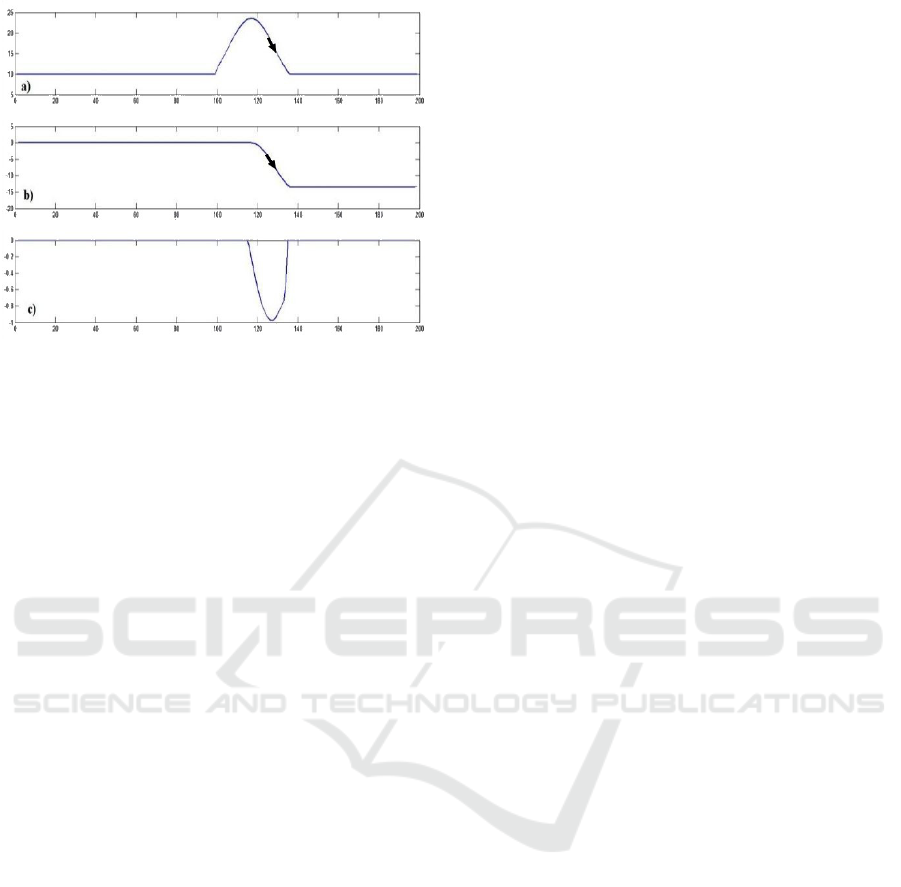
Figure 6: (a) P wave form, (b) Y- signal corresponds to the
positions of decreasing changes of P wave, (c) dif(Y-) dif-
ferentiation of Y- signal.
differences applied to overcome mathematical model
challenges. Besides, we will discuss new challenges
emerged in front of this approach, and what are the
best ways to overcome them. This approach starts by
QRS complex peak detection and proceeds for P and
T-waves delineation.
4.1 Onset/End Points of P and T-waves
Detection
Step 1: Preprocessing. The notable amplitude of
QRS peak and the steep slope that it has are main
two features that we are exploiting in our derivative
approach to build QRS peak detection algorithm. In
real ECG signal, sharp noise transitions could be ex-
isted in the signal. These sharp noise singularities
could be detected as QRS complex because they have
same features of high amplitude and steep slope. So,
moving average filter to eliminate such singularities
has been applied on ECG signal. Step 2: 1D NLFS.
After filtering, 1D NLFS approach has been applied
on the filtered ECG signal to get, Y+ signal. Step 3:
Obtaining Feature Signal. Applying differentiation
process on the Y+ signal to get difY+ signal. The
main purpose of this process is converting the rising
transition in this signal into Gaussian peaks. Then,
thresholding difY+ to get TdifY+ signal which set all
its values to zero except which are higher than Thresh
value determined in equation (5).
T hresh = 0, 6 ∗ max(di fY
+
) (5)
Step 4: Linear Search. Linear search process will be
applied on T di fY + signal, and register the index of
the end of each peak. Step 5: QRS Peak Detection.
After determining the end of each peak w0 , a narrow
search window around it on the original ECG signal
ECG (w0-5, w0+5) will be defined. Within this nar-
row window, the local maximum value will be consid-
ered as QRS peak point. Step 6: Iteration. Repeat
Step 4 and 5 either up to detecting all required R peaks
in the signal or up to reach the end of the signal. Step
7: Defining RR Line. Subtract the index of each R
peaks from previous R peak index value to find RR
line which represents the heart rate.
4.2 P and T-wave Delineation in Real
ECG Signal
To give clear indication about how much this ap-
proach is robust to noise, we will delineate P and
T-waves in QT MIT database that contains certain
amount of noise without using any denoising proce-
dure in this part of our approach. The first step in
detecting onset/end points is determining boundaries
of search window that contains P and T-waves. These
boundaries will be defined exactly in the same way
used in the mathematical model and given in equa-
tions (3), (4). Obtaining feature signal by normal dif-
ferentiation step on Y+, Y- as we did in the mathemat-
ical model is not efficient. The main two reasons are
the noise that comes from different sources to ECG
signal and the changes in amplitude of real ECG sig-
nal between main cardiac waves like P, QRS and T
waves that comes basically from muscles electrical
activity.
S(i) = Y (i + 8) −Y (i) (6)
The proposed solution for this problem is applying
differentiation process with a wide step about 32 ms
for parts of Y+, Y- that fall in region of interest i.e. be-
tween w0 , w1. The sampling rate in QT MIT database
ECG signals is 250 Hz (i.e: 32 ms) equals 8 samples
(sp). This differentiation step will reduce the effect
of noise and still gives a clear indication for onset/end
position within Y+, Y-. Equation (6) shows the fea-
ture signal obtained for detecting onset/end points: As
in the mathematical model, Y+ signal is used for on-
set points detection by considering the index of max-
imum value in S(i) feature signal as index for onset
point. Y- Signal is used for end points detection by
considering the index of minimum value in S(i) fea-
ture signal as index of end point after shifting it for-
ward with 8 samples.
4.3 Limits of NLFS Approach Applied
on Real ECG Signal
Like other methods and approaches in this field
of research, this approach has its own limits like:
Electrocardiogram Signal Analysing - Delineation and Localization of ECG Component
159

1) Static thresholding used in QRS peak detec-
tion algorithm: fixed threshold is used for this task,
and this fixed thresholding may lead to false positive
detection in some rare cases of ECG signal such as
record 117 in MIH-BIT Arrhythmia database (Moody
and Mark, 2001) where height of T-wave amplitude
is more or less the same of QRS complex amplitude.
2) Static boundaries determination for search win-
dows to detect onset/end points of P or T-wave: In
some special cases of ECG signal P or T-wave is
overlapped with QRS complex. This overlapping
makes onset/end points fall out of search window.
3) Dependency of onset/end detection: P and T-waves
delineation is started from QRS peak defined in pre-
vious step. So, if there is error in R peak detection
this will lead to error in P and T-waves delineation.
4) There are unusual morphologies for P and T-waves
could be existed in real ECG signals like inverted or
bi-phasic waves, presented approach unable to deal
with them.
5 EVALUATION AND TESTING
Because there is no golden rule to determine the
peak, onset and end of the ECG waves, the valida-
tion of such algorithms must be done using manu-
ally annotated databases like QT MIT database [5].
This database was developed for wave limits valida-
tion purposes and it provides cardiologist annotations
for at least 30 beats per recording, with marks in-
cluding QRS complexes, P and T waves peaks, on-
sets and ends. The QT DB also includes, for 11
out of its 105 records, an additional annotation per-
formed by a second cardiologist. Twelve records from
this database are selected to calculate the mean er-
ror (ME), Standard Deviation (SD) for difference be-
tween our approach detection and manual annotations
existed. Then we calculate the Sensitivity (Se) and the
Positive Predictivity (P+) values. Se=TP/(TP+FN),
and P+=TP/(TP+FP). Where TP represents True posi-
tive, FP represents False Positive, FN represents False
Negative parameters. For deciding to any one of these
choices our approach detection results belong, we will
consider standard deviation accepted error by cardiol-
ogist in any ECG automatic analysis system presented
in (Zywietz and Celikag, 1991).
Table. 1 shows standard deviation σ in (ms) of max-
imum accepted error for these points detection.
Table. 2 shows the result of applying our approach on
the subset of QTMIT database that contains about 300
annotated beats. We can note there is no result for
T-onset point, because it is not annotated manually
in QTMIT database. The visual observation shows
Table 1: Accepted tolerances for standard deviation ac-
cepted error σ (ms) by cardiologist in any ECG automatic
analysis.
Localization P on P
end
QRS on QRS end T end
σ(ms) 10.2 12.7 6.5 11.6 30.6
Table 2: Performance on subset of QT MIT database.
ME (ms) SD (ms) Se P+
P
onset
1.48 11.55 75.16 75.16
P
end
-1.747 13.57 71 71
R
peak
-3.251 2.487 98.43 98.88
T
end
-7.93 12.396 90.7 90.7
that the performance of our approach for T-onset point
should be close to T-end point performance.
For comparing results of this current work with
the best algorithms and approaches in this field of re-
search, this approach gives good results in general as a
first version of this approach. It gives less competitive
results for P-wave onset/end points, and gives good
performance for T-end. For QRS peak detection gives
good and competitive results. Despite it gives lower
values numerically, it is still promising approach for
following reasons: 1) It represents the first initiative to
exploit 1D NLFS approach in signal decomposition.
2) It is single-lead based, fast and robust to noise ap-
proach which makes it convenient for real time ECG
analysis systems. 3) There are several enhancements
could be done on this work which can lead to enhance
its performance and decrease its limitations.
Table. 3 represents a comparison among this ap-
proach and best existing approaches in this field
like wavelet- approach presented in (Martinez et al.,
2004), and Low Pass Differentiation approach pre-
sented in (Laguna et al., 1994), and Bayesian
detection-estimation algorithm presented in (Lin
et al., 2011). We can note that our approach gives
lower standard deviation error and lower Sensitivity
Positive. In Table. 3 we can note that our approach
gives lower standard deviation error and lower Sen-
sitivity, Positive Predictivity in the same time. The
main reason may be behind this paradox that other
approaches used wider accepted error than we consid-
ered in our approach for calculating Se, P+. Table. 3
shows QRS complex localization and delimitation by
applying NFLS approach on electrocardiogram sig-
nals from QTMIT database, these results are obtained
quickly and with high precision.
6 CONCLUSION
In this work, a new single-lead based fast and robust
to noise approach for ECG signal features detection is
presented. This algorithm could be exploited as a part
BIOSIGNALS 2016 - 9th International Conference on Bio-inspired Systems and Signal Processing
160

Table 3: Results comparison of the proposed method with other methods.
Method Parameters P
on
P
end
QRS T
end
Proposed method Se (%) 75.16 71 98.88 90.7
P+(%) 75.16 71 98.88 90.7
m± s (ms) 1.48 ± 11.5 -1.7± 13.5 -3.2± 2.48 -7.9 ± 12.3
WT[4] Se (%) 98.87 98.75 99.92 99.77
P+(%) 91.03 91.03 99.88 97.79
m± s (ms) 2.0 ± 14.8 1.9± 12.8 NA -1.6 ± 18.1
LPD [10] Se (%) 97.70 97.70 NA 99.90
P+(%) 91.17 91.17 97.71
m± s (ms) 14 ± 13.3 -0.1± 12.3 13.5 ± 27.0
Bayes[2] Se (%) 99.6 99.6 NA 100
P+(%) NA NA NA
m± s (ms) 1.7 ± 10.8 2.5± 11.2 2.7 ± 13.5
of automatic analysis system for cardiac diagnosis.
We exploited for the first time the concept of signal
decomposition into two sub signals, each one of them
contains half of the information. This decomposition
reduces problem complexity especially for onset/end
points detection algorithm. We started by proposing
theoretical model to show how we can extract impor-
tant information from free of noise synthetic ECG,
then this model is developed to present real approach
that can deal with real noisy ECG signals. This ap-
proach is a comprehensive algorithm existed nowa-
days, because most of current algorithms either for
QRS complex detection or for P and T-waves delin-
eation depending on predefined QRS complex. Test-
ing has been done on twelve records from QTMIT
standard database to calculate mean error, standard
deviation, Se, P+. This approach gives good re-
sults for QRS peak, T-end points and less competitive
than other approaches for P-wave onset/end points.
The future works could be useful for improving per-
formance of this approach could be summarized as
follows: 1) Improving static thresholding procedure
used within QRS complex peak detection, to be dy-
namic and robust even for special rare clinical cases
could be faced in real ECG signals. 2) Using dynamic
and adaptive differentiation steps instead of static one
for obtaining feature signal from Y+, Y- can increase
the performance accuracy. 3) Adding denoising stage
beforeonset/end points detection will lead to improve
performance ofthis approach. 4) Generalizing this ap-
proach to be applicable to detect peak, onset and end
points from other type of signals.
REFERENCES
Chouhan, V. and Mehta, S. (2008). Detection of qrs com-
plexes in 12-lead ecg using adaptive quantized thresh-
old. International Journal of Computer Science and
Network Security, 8(1):155–163.
Kohler, B.-U., Hennig, C., and Orglmeister, R. (2002). The
principles of software qrs detection. Engineering in
Medicine and Biology Magazine, IEEE, 21(1):42–57.
Laguna, P., Jane, R., and Caminal, P. (1994). Automatic
detection of wave boundaries in multilead ecg sig-
nals: validation with the cse database. Computers and
biomedical research, 27(1):45–60.
Laguna, P., Mark, R. G., Goldberg, A., and Moody, G. B.
(1997). A database for evaluation of algorithms for
measurement of qt and other waveform intervals in the
ecg. In Computers in Cardiology 1997, pages 673–
676. IEEE.
Laligant, O. and Truchetet, F. (2010). A nonlinear deriva-
tive scheme applied to edge detection. Pattern Anal-
ysis and Machine Intelligence, IEEE Transactions on,
32(2):242–257.
Lin, C., Kail, G., Tourneret, J.-Y., Mailhes, C., and
Hlawatsch, F. (2011). P and twave delineation and-
waveform estimation in ecg signals using a block
gibbs sampler. In Acoustics, Speech and Signal Pro-
cessing (ICASSP), 2011 IEEE International Confer-
ence on, pages 537–540. IEEE.
Martinez, J. P., Almeida, R., Olmos, S., Rocha, A. P., and
Laguna, P. (2004). A wavelet-based ecg delineator:
evaluation on standard databases. Biomedical Engi-
neering, IEEE Transactions on, 51(4):570–581.
McSharry, P. E., Clifford, G. D., Tarassenko, L., Smith,
L., et al. (2003). A dynamical model for generating
synthetic electrocardiogram signals. Biomedical En-
gineering, IEEE Transactions on, 50(3):289–294.
Moody, G. B. and Mark, R. G. (2001). The impact of the
mit-bih arrhythmia database. Engineering in Medicine
and Biology Magazine, IEEE, 20(3):45–50.
Zywietz, C. and Celikag, D. (1991). Testing results and
derivation of minimum performance criteria for com-
puterized ecg-analysis. In Computers in Cardiology
1991, Proceedings., pages 97–100. IEEE.
Electrocardiogram Signal Analysing - Delineation and Localization of ECG Component
161
