
AMSOM: Adaptive Moving Self-organizing Map
for Clustering and Visualization
Gerasimos Spanakis and Gerhard Weiss
Department of Knowledge Engineering, Maastricht University, 6200MD, Maastricht, The Netherlands
Keywords:
Self-Organizing Maps, Clustering, Visualization, Unsupervised Learning.
Abstract:
Self-Organizing Map (SOM) is a neural network model which is used to obtain a topology-preserving mapping
from the (usually high dimensional) input/feature space to an output/map space of fewer dimensions (usually
two or three in order to facilitate visualization). Neurons in the output space are connected with each other
but this structure remains fixed throughout training and learning is achieved through the updating of neuron
reference vectors in feature space. Despite the fact that growing variants of SOM overcome the fixed structure
limitation they increase computational cost and also do not allow the removal of a neuron after its introduction.
In this paper, a variant of SOM is proposed called AMSOM (Adaptive Moving Self-Organizing Map) that on
the one hand creates a more flexible structure where neuron positions are dynamically altered during training
and on the other hand tackles the drawback of having a predefined grid by allowing neuron addition and/or re-
moval during training. Experiments using multiple literature datasets show that the proposed method improves
training performance of SOM, leads to a better visualization of the input dataset and provides a framework for
determining the optimal number and structure of neurons.
1 INTRODUCTION
The Self-Organizing Map (SOM) (Kohonen, 2001)
is an unsupervised neural network model which
effectively maps high-dimensional data to a low-
dimensional space (usually two-dimensional). The
low-dimensional space (also called output space) con-
sists of a grid of neurons connected with each other,
according to a specific structure (can be hexagonal,
rectangular, etc.). This structure allows the topology
preservation of input data (i.e., similar input patterns
are expected to be mapped to neighboring neurons
in the output grid) (Kohonen, 1981). By this way,
SOM manages to achieve dimensionality reduction,
abstraction, clustering and visualization of the input
data and this is the reason that it has been applied
successfully to many different domains and datasets
like financial data (Deboeck and Kohonen, 2013),
speech recognition (Kohonen, 1988), image classifi-
cation (Lu, 1990), document clustering (Lagus et al.,
1999), (Spanakis et al., 2012).
The SOM algorithm raises some issues and prob-
lems: (1) SOM’s architecture is fixed and predefined
in terms of number and arrangement of neurons. In
case of largely unknown input data, it is difficult to
determine apriori the correct structure that provides
satisfactory results. There is some work in this area
in order to how to add/remove neurons but none of
current approaches adjusts neuron positions on the
grid according to training progress. (2) Training a
SOM comes with a large computation cost, especially
in cases of large datasets and/or large maps. Many
epochs might be needed in order for the SOM to con-
verge and the map to reach a final state.
In this paper we propose an extension of the tra-
ditional SOM, which handles both issues described
above: First, it allows neurons to change positions
during training which provides better visualization
and faster training time. Second, number of neurons
can be adjusted (neurons can be either added or re-
moved) according to dataset requirements and train-
ing progress. Due to this enhanced training scheme,
the number of epochs required for training is sig-
nificantly reduced. The rest of the paper is orga-
nized as follows. Section 2 presents background work
on SOM, extensions on the traditional algorithm and
their limitations. The proposed method is presented
in Section 3 while experimental setup is described in
Section 4. Finally, Section 5 concludes the paper.
Spanakis, G. and Weiss, G.
AMSOM: Adaptive Moving Self-organizing Map for Clustering and Visualization.
DOI: 10.5220/0005704801290140
In Proceedings of the 8th International Conference on Agents and Artificial Intelligence (ICAART 2016) - Volume 2, pages 129-140
ISBN: 978-989-758-172-4
Copyright
c
2016 by SCITEPRESS – Science and Technology Publications, Lda. All rights reserved
129
2 RELATED WORK
2.1 SOM and Competitive Learning
The Self-Organizing Map (SOM) is a fully connected
single-layer linear neural network. The SOM uses a
set of neurons, often arranged in a 2-D rectangular or
hexagonal grid, to form a discrete topological map-
ping of an input space, X ∈ R
D
. Input space consists
of a set of vectors x
j
∈ R
D
:
x
j
= [x
j1
, x
j2
, ...,x
jD
]
T
(1)
w
i
is the weight vector associated to neuron i and
is a vector of the same dimension (D) of the input
space, M is the total number of neurons. Obviously,
these weights represent the synaptic connections of
each neuron i and can be denoted:
w
i
= [w
i1
, w
i2
, ..., w
iD
]
T
(2)
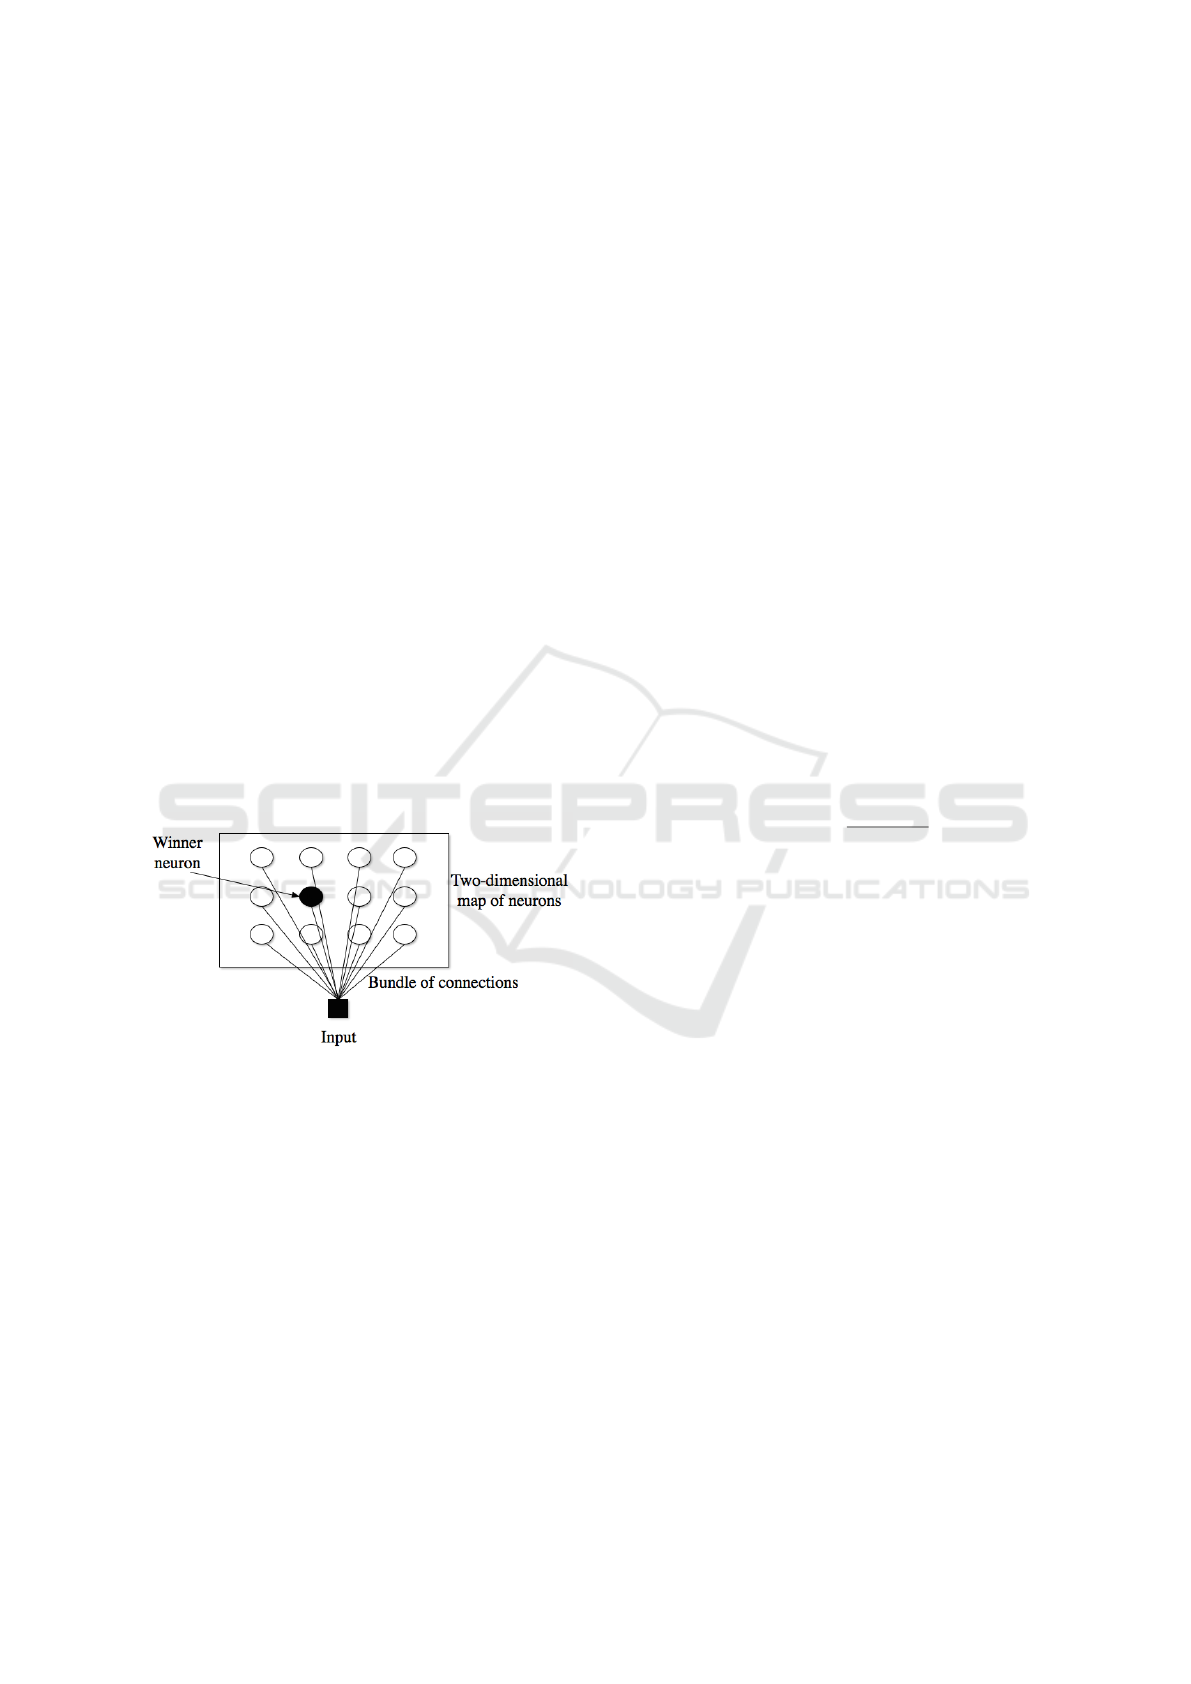
The fundamental principle of SOM is the soft
competition between the nodes in the output layer;
not only the node (winner) but also its neighbors are
updated (Kohonen, 2012).
A SOM architecture can be found in Figure 1.
Figure 1: The SOM (fully connected) architecture.
All the weights w
1
, w
2
, ..., w
M
are initialized to
random numbers, in the range of the corresponding
input characteristics. We also introduce a discrete
time index t such that x(t), t = 0, 1, ... is presented
to network at time t and w
i
(t) is the weight vector
of neuron i computed at time t. The available input
vectors are recycled during the training (or learning)
process: a single pass over the input data is called an
epoch.
2.1.1 On-line Training of SOM
In the conventional “on-line” or “flow-through”
method, the weight vectors are updated recursively
after the presentation of each input vector. As each
input vector is presented, the Euclidean distance be-
tween the input vector and each weight vector is com-
puted:
d
i
(t) = ||x(t) −w
i
(t)||
2
(3)
Next, the winning or best-matching node (denoted
by subscript c) is determined by:
c = {i, min
i
d
i
(t)} (4)
Note that we suppress the implicit dependence of
c on discrete time t. The weight vectors are updated
using the following rule:
w
i
(t + 1) = w
i
(t)+ α(t)·h
ci
(t)·[x(t)−w
i
(t)] (5)
where α(t) is the learning-rate factor and h
ci
(t) is
the neighborhood function. The learning rate factor
controls the overall magnitude of the correction to the
weight vectors, and is reduced monotonically during
the training phase. The neighborhood function con-
trols the extent to which w
i
(t) is allowed to adjust in
response to an input most closely resembling w
c
(t)
and is typically a decreasing function of the distance
on the 2-D lattice between nodes c and i. We use the
standard Gaussian neighborhood function:
h
ci
(t) = exp
−
||r
i
−r
c
||
2
σ(t)
2
(6)
where r
i
and r
c
denote the coordinates of nodes i
and c, respectively, on the output space (usually two-
dimensional grid). The width σ(t) of the neighbor-
hood function decreases during training, from an ini-
tial value comparable to the dimension of the lattice
to a final value effectively equal to the width of a sin-
gle cell. It is this procedure which produces the self-
organization and topology preserving capabilities of
the SOM: presentation of each input vector adjusts the
weight vector of the winning node along with those
of its topological neighbors to more closely resemble
the input vector. The converged weight vectors ap-
proximate the input probability distribution function,
and can be viewed as prototypes representing the in-
put data.
2.1.2 Batch Training of SOM
The SOM update given by Equation (5) is “on-line”
in the sense that the weight vectors are updated after
the presentation of each input record. In the batch
SOM algorithm (proposed in (Kohonen, 1993)), the
weights are updated only at the end of each epoch
according to:
ICAART 2016 - 8th International Conference on Agents and Artificial Intelligence
130
w
i
(t
f
) =
∑
t
0
=t
f
t
0
=t
0
˜
h
ci
(t
0
) ·x(t
0
)
∑
t
0
=t
f
t
0
=t
0
˜
h
ci
(t
0
)
(7)
where t
0
and t
f
denote the start and finish of the
present epoch, respectively, and w
i
(t
f
) are the weight
vectors computed at the end of the present epoch.
Hence, the summations are accumulated during one
complete pass over the input data. The winning node
at each presentation of new input vector is computed
using:
˜
d
i
(t) = ||x(t) −w
i
(t
0
)||
2
(8)
c = {i, min
i
˜
d
i
(t)} (9)
where w
i
(t
0
) are the weight vectors computed at
the end of the previous epoch. The neighborhood
functions
˜
h
ci
(t) are computed using Equation (6), but
with the winning nodes determined from Equation
(9). This procedure for computing the neighborhood
function is identical to the Voronoi partinioning. As
is in the on-line method, the width of the neighbor-
hood function decreases monotonically over the train-
ing phase.
A more concrete explanation of the batch algo-
rithm is given by the following Equation:
w
i
=
∑
j
n
j
·h
ji
· ˜x
j
∑
j
n
j
·h
ji
(10)
where n
j
is the number of input items mapped into
node j and the index j runs over the nodes in the
neighborhood of node i. The basic idea is that for ev-
ery node j in the grid, the average ˜x
j
of all those input
items x(t) is formed that have node j (i.e., vector w
j
)
as the closest node. The above Equation is used for
updating the node weight vectors and this is repeated
for a few times, always using the same batch of input
data items to determine the updated ˜x
j
.
The batch SOM offers several advantages over
the conventional on-line SOM method. Since the
weight updates are not recursive, there is no depen-
dence upon the order in which the input records are
presented. In addition to facilitating the development
of data-partitioned parallel methods, this also elimi-
nates concerns (Mulier and Cherkassky, 1994) that in-
put records encountered later in the training sequence
may overly influence the final results. The learning
rate parameter α(t) does not appear in the batch SOM
algorithm, thus eliminating a potential source of poor
convergence (Ceccarelli et al., 1993) if this parameter
is not properly specified.
The mathematical theory of the SOM is very com-
plicated and only the one-dimensional case has been
analyzed completely (Fort, 2006), since the SOM
belongs to the ‘ill posed’ problems in mathematics.
The SOM can also be looked at as a ‘nonlinear pro-
jection’ of the probability density function of high-
dimensional input data onto the two-dimensional dis-
play.
Usually, the input is mapped onto a 1- or 2-
dimensional map. Mapping onto higher dimensions
is possible as well, but complicates the visualiza-
tion. The neurons connected to adjacent neurons by a
neighborhood relationship define the structure of the
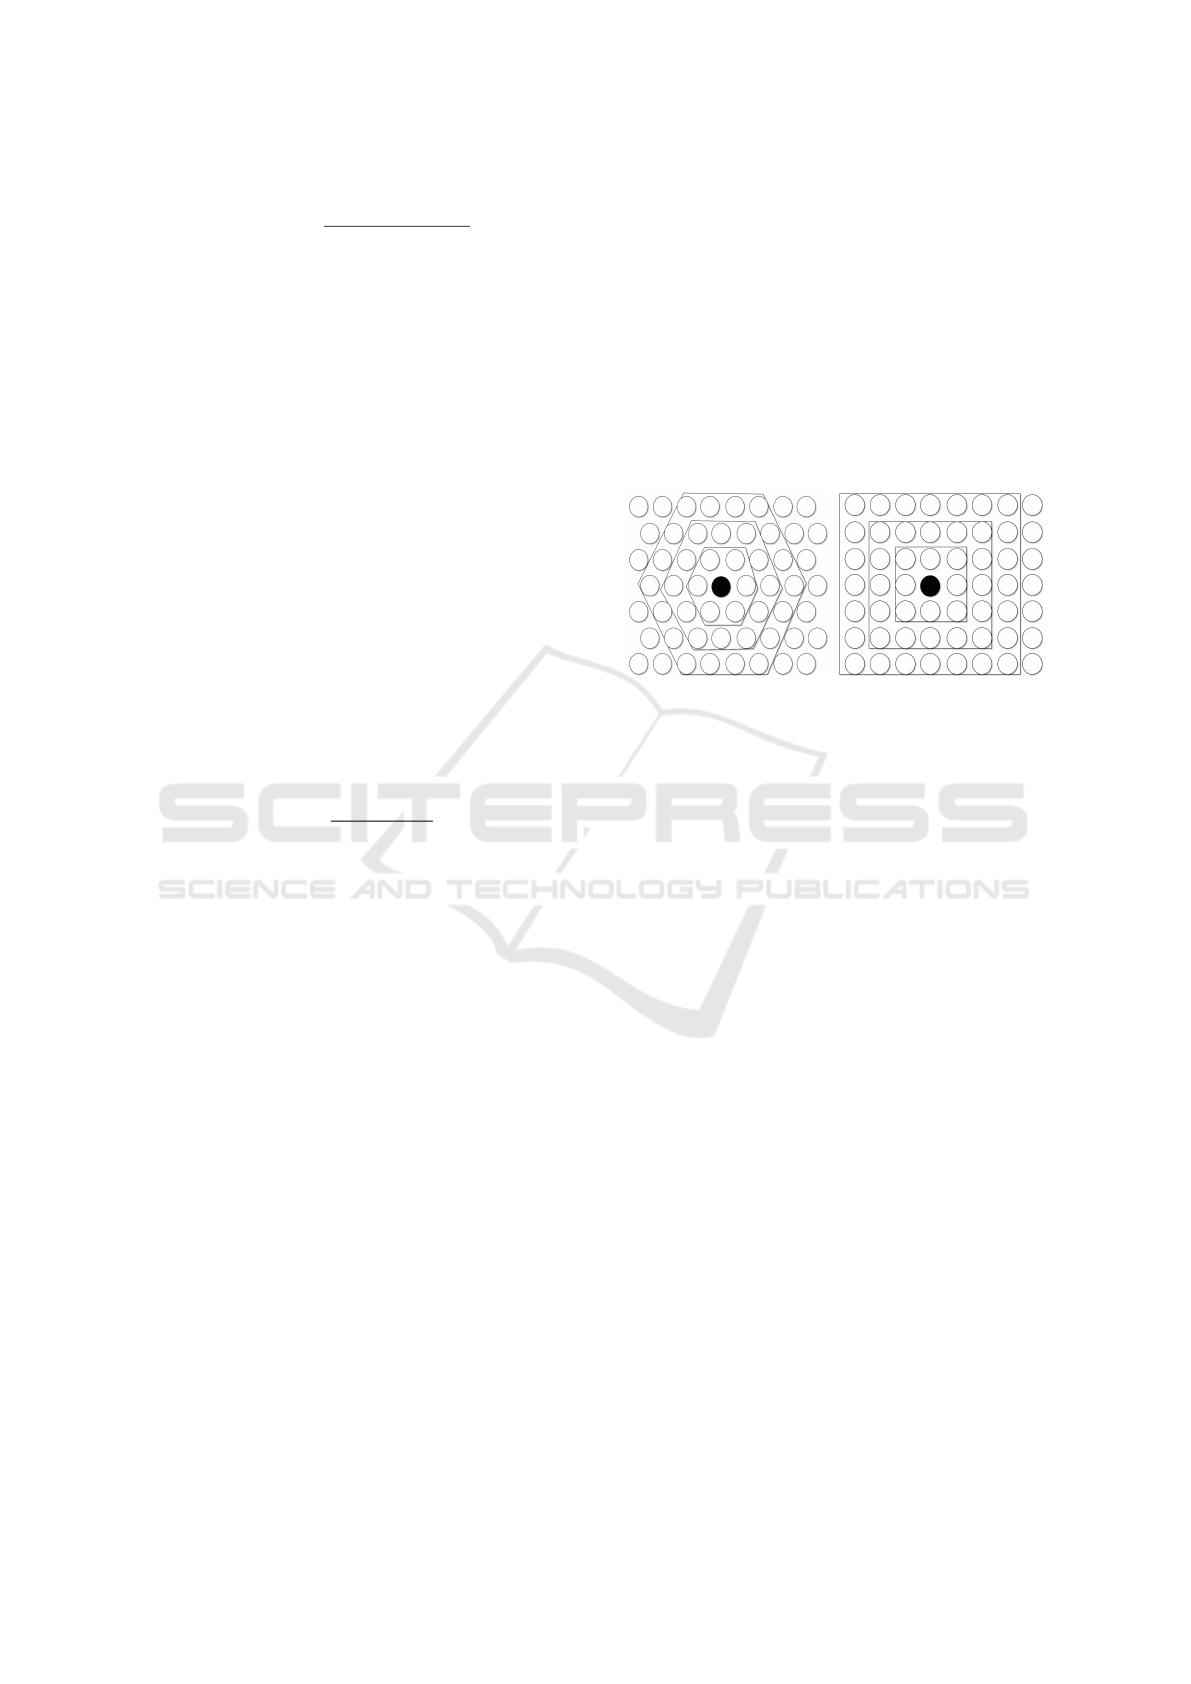
map. The two most common 2-dimensional grids are
the hexagonal grid and the rectangular grid and are
shown in Figure 2.
(a) Hexagonal grid (b) Rectangular grid
Figure 2: Typical SOM grids with different neighborhoods
around the winner neuron.
The neighborhood function defines the correlation
between neurons. The simplest neighborhood func-
tion is called bubble; it is constant over the neighbor-
hood of the winner neuron and zero otherwise. The
neighborhood of different sizes in rectangular and
hexagonal maps can be seen in Figure 2. A more flex-
ible definition is the gaussian neighborhood function
defined by Equation (6).
The number of neurons, the dimensions of the
map grid, the map lattice and shape must be speci-
fied before training. The more neurons the grid has,
the more flexible the mapping becomes but the com-
putation complexity of the training phase increases
as well. The choice of the map structure and size is
both related to the type of problem and the subjective
choice of the user.
2.2 Flexible Structure in Neural
Networks and SOM
The norm in artificial neural nets is that classic tech-
niques involve simple and often fixed network topolo-
gies trained via stimulus-based methods such as back-
propagation. However, there are cases in which the
structural design of the network is strongly influenced
by the environment and by utilizing constructive and
pruning algorithms. Both these algorithmic categories
deliver a network which is gradually adjusted in re-
sponse to training data. There are many approaches
AMSOM: Adaptive Moving Self-organizing Map for Clustering and Visualization
131

which apply these algorithms in classic neural net-
works (Islam et al., 2009), (Bortman and Aladjem,
2009), (Han and Qiao, 2013), (Yang and Chen, 2012).
Also, there are many variations of SOM that allow
a more flexible structure of the output map which can
be divided into two categories: In the first type, we
include growing grid (GG) (Fritzke, 1995), incremen-
tal GG (Blackmore and Miikkulainen, 1993), growing
SOM (GSOM) (Alahakoon et al., 2000) all coming
with different variants. GG is the only variant which
allows growing a new node from the interior of the
grid (but this is a whole row or column of nodes). In
the rest cases, new nodes are generated by a boundary
node, despite the fact that the highest error could have
been generated by an internal node. The idea is that
the error will be propagated to the exterior to guaran-
tee that growing can only be from the boundaries but
this process can lead to a map structure with not per-
fect topology preservation. Therefore, map size be-
comes very wide after a limited number of insertions,
with some additional nodes, which have no effect.
MIGSOM (Ayadi et al., 2012) allows a more flexible
structure by adding neurons internally and from the
boundary but still does not offer the ability to remove
neurons if necessary.
In the second type of growing variants, the rect-
angular grid is replaced with some connected nodes.
We denote growing cell structures (GCSs) (Fritzke,
1994), growing neural gas (GNG) (Fritzke et al.,
1995) and growing where required (Marsland et al.,
2002). These works add just the necessary nodes
at the same time, to fine-tune the optimal map size.
Nevertheless, GCS and GNG are facing many diffi-
culties for visualizing high-dimensional data. Visu-
alization in these cases is guaranteed only with low-
dimensional data.
Limitations in growing and visualization led to
hierarchical variants of the previous model like the
Growing Hierarchical SOM (GHSOM) (Rauber et al.,
2002). With GHSOM you can get an idea of the hier-
archical structure of the map, but the growing param-
eter of the map has to be defined beforehand. Other
approaches (like TreeGNG (Doherty et al., 2005) or
TreeGCS (Hodge and Austin, 2001)) use dendro-
grams for representation but due to this tree structure
they lose the topological properties.
Disadvantages of these approaches are: (a) the
high computational cost due to the fact that structure
starts from a very basic architecture and has to grow
in order to reach an acceptable structure for the data
and (b) the fact that after adding neurons there is not
the possibility of removing a neuron if performance is
not improving.
3 EXPANDING THE IDEA OF
SELF-ORGANIZATION IN
NEURON LOCATIONS
During the classic SOM algorithm neuron positions
remain unchanged and the grid is fixed from the be-
ginning till the end of the training. This facilitates the
process of learning (since neighborhood structure is
known beforehand) but is restricting regarding the fi-
nal result and ways of visualizing it. We propose a
different and more flexible scheme in regard to posi-
tion vectors r
i
of neurons, which allows a more adap-
tive form of the neuron grid and acts as an extension
to the batch learning algorithm.
Starting from an already grown map size, AM-
SOM can adapt both its size and structure in order
to better represent the data at a specific level of detail.
After a specific number of steps, neurons are analyzed
to see whether the level of representation is sufficient
or adjustments are needed: removal and/or addition of
neurons. Initially, connections between neurons are
determined based on the grid structure but as training
advances, these can change and adjust according to
the way that neuron positions are also changed during
the process. The algorithm flow is described in Figure
3 and more details about the steps are presented in the
following subsections.
3.1 Phase I: AMSOM Initialization
3.1.1 Grid Structure and Size
The first step of AMSOM algorithm is to define the
initial grid structure (as the classic SOM). This pro-
cess facilitates training time in contrast to starting
from a small-size structure and building on that as
other approaches do (Vesanto et al., 2000). It is also
in agreement with the neural development which sug-
gests that nearly all neural cells used through human
lifetime have been produced in the first months of
life (Dowling, 2007). This overproduction of neu-
ron cells is thought to have evolved as a competitive
strategy for the establishment of efficient connectivity
(Changeux and Danchin, 1976).
Having this in mind, the initial structure of SOM is
determined. Several empirical rules (Park et al., 2006)
suggest that the number of neurons should be 5 ·
√
N
where N is the number of patterns in the dataset. In
this case, the two largest eigenvalues of the training
data are first calculated, then the ratio between side
lengths of the map grid is set to the ratio between the
two maximum eigenvalues. The actual side lengths
are finally set so that their product is close to the num-
ber of map units determined according to (Vesanto
ICAART 2016 - 8th International Conference on Agents and Artificial Intelligence
132
1. Initialization Phase
1.1: Derive initial grid structure and size (number of neurons M) of the AMSOM
1.2: Initialize weight vectors (w
i
) to random values (according to the value range of features).
1.3: Initialize position vectors (r
i
) according to the initial grid structure
1.4: Initialize edge connectivity matrix (E) values according to the grid connections
1.5: Initialize edge age matrix (A) values to zero
1.6: Define growing threshold (GT ) according to dimension of the data D and a spreading factor (SF).
2. Training phase
for t = 1 : maxepochs do
for i = 1 : P do
2.1: Find winner neuron N
a
according to Equation (9) and increase times that neuron N
a
is winner by 1
2.2: Find second best matching neuron N
b
(using Equation (9) and excluding N
a
from the search)
2.3: Age of all edges between N
a
and its neighbors increased by one
2.4: Connect N
a
with N
b
(if they were not already connected)
2.5: Reset age between N
a
and N
b
to zero
end for
2.6: Use Equations 11-12 to update neuron weights.
2.7: Use Equations 13-14 to update neuron positions.
2.8:
if neurons need to be added/removed (check age
max
and t
add
) then add/remove neurons and update accord-
ingly
end if
2.9:
if error does not change significantly then end training phase
elseContinue
end if
end for
3. Smoothing phase
3.1: Fine-tune weights and deliver the AMSOM neuron weight vectors and positions
Figure 3: AMSOM algorithm overview.
et al., 2000) rule. The eigenvalues ratio shows how
well the data is flattened and elongated (Est
´
evez et al.,
2012). At this point a more precise determination
of the number of neurons is not essential, since this
number will be fine tuned during the training pro-
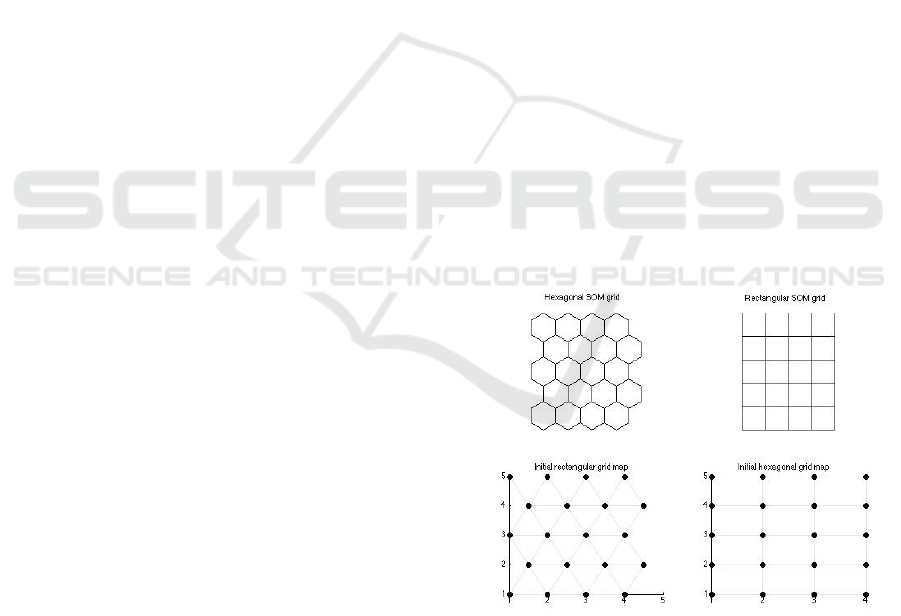
cess. Initially, neurons are connected with their neigh-
bors following the idea of Figure 2 using a rectangu-
lar or hexagonal grid. For example, if the algorithm
suggests that the initial grid of the AMSOM should
be 5x4 (let’s suppose rectangular), every neuron has
4 neighbors (except the marginal ones). Figure 4
demonstrates two different topologies, a rectangular
and a hexagonal one with the corresponding connec-
tions between neurons.
3.1.2 Vector, Matrix and Parameters
Initialization
For each neuron the following are defined and initial-
ized accordingly:
• Neuron vector (weight vector, w
i
): It is the same
as the classic SOM (see Equation (2)) and shows
the representation of the neuron in the feature (in-
put) space. Initialization of neuron vectors is ran-
Figure 4: Initial grid example (hexagonal & rectangular).
dom according to literature standards.
• Neuron position (position vector, r
i
): Depend-
ing on the output space (mostly it is two-
dimensional), it’s a vector that shows the position
of the neuron. Initial position vectors are equal
to the positions of the neurons in the grid, i.e., in
Figure 4 one can see the coordinates of neurons
AMSOM: Adaptive Moving Self-organizing Map for Clustering and Visualization
133
according to the structure (hexagonal or rectangu-
lar).
Since the structure of the grid is subject to changes
during training, we need to keep track of the neigh-
bors of each neuron. There is the possibility that
some neurons which where connected in the initial
grid become disconnected after some time (or vice
versa). In order to keep track of these changes we
introduce the orthogonal and symmetrical matrices E
and A (both size M ×M) where E(p, q) shows if neu-
rons p and q are connected (0 translates to no connec-
tion, 1 translates to connected neurons) and A(p, q)
shows the age of edge (as implied by E(p, q)) between
neurons p and q: This will be used in order to de-
termine which neurons had incidental connections to
other neurons or strong connections as training moves
forward. When A(p, q) is 0 that means that neurons
p and q were closest neighbors at current epoch but
any other value (i.e., 2) implies that neurons p and q
were closest neighbors some epochs before (i.e., 2).
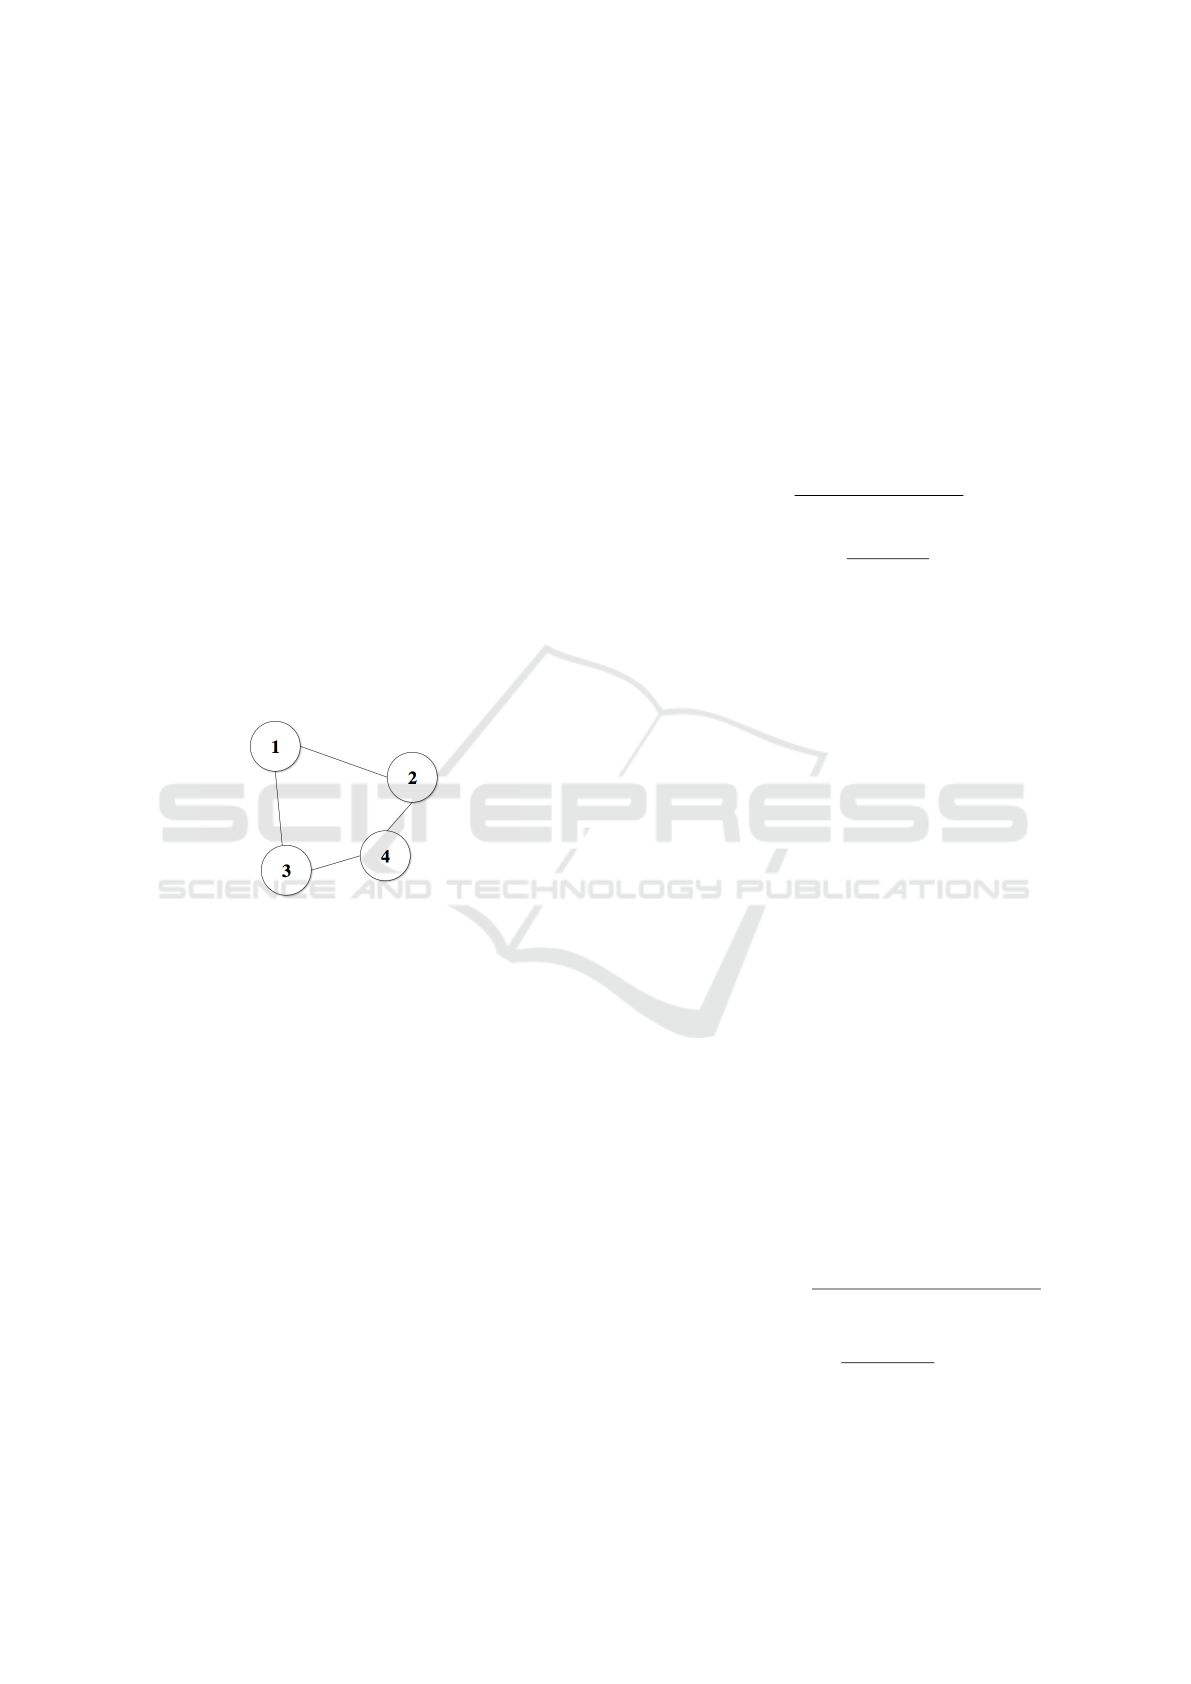
An example of matrices E and A is seen in Figure 5.
A =
0 2 4 0
2 0 0 0
4 0 0 1
0 0 1 0
, E =
0 1 1 0
1 0 0 1
1 0 0 1
0 1 1 0
Figure 5: Example of matrices A and E describing connec-
tions between AMSOM neurons.
In this example, neurons number (M) is 4 and con-
nectivity matrix E shows how neurons are connected
to each other (as implied by the graph). Age matrix A
shows how many epochs an edge has ‘survived’: Con-
nection between neuron #1 and #2 has age 2 whereas
connection between neuron #2 and #4 has age 0. No-
tice that age 0 can either mean that neurons are not
connected, like neurons #1 and #4 or that neurons are
connected at this current epoch (so their connection is
‘recent’), like neurons #2 and #4.
Also, at this stage the growing threshold GT of the
map is defined as a function of data dimension (D) and
a spread factor (SF) defined by the user. Formula used
is GT = −ln(D) ×ln(SF) (from (Alahakoon et al.,
2000)). Generally, a SF value of 0.5 always yields
good results but its fine tuning is up to the user re-
quirements and the dataset structure.
3.2 Phase II: Training
3.2.1 Weight and Position Updating
For the weight learning of neurons, the SOM batch
algorithm is utilized, as it was given in Equations 7-
10, which are repeated here for clarity.
w
i
(t + 1) =
∑
j
n
j
(t) ·h
ji
(t) ·
˜
x
j
(t)
∑
j
n
j
(t) ·h
ji
(t)
(11)
h
ji
(t) = exp
−
||r
j
−r
i
||
2
σ(t)
2
(12)
where:
• w
i
(t + 1) marks neurons i updated weight (at
epoch t + 1),
• t marks current epoch and t + 1 marks the next
epoch,
• n
j
(t) marks the number of patterns that are as-
signed to neuron j,
• h
ji
(t) marks the neighborhood function and is a
measure of how close are neuron j and neuron i,
•
˜
x
j
(t) is the mean feature vector of all x that are
assigned to neuron j at epoch t,
• r
j
, r
i
are the position vectors (in the output space)
for neurons j and i,
• σ(t) is the adaptation factor, decreasing through
training
Building on top of this, at the end of each epoch,
the neuron position vectors are adjusted in a simi-
lar manner to the SOM training algorithm. In more
detail, at the end of each epoch and after the neu-
ron weight vectors update is over, the distances be-
tween the neuron vectors (w
i
) are computed. These
distances show how close neurons are (in the input
space) and can be used as a measure in order to up-
date neuron positions (in the output space). This is
achieved through the following Equations:
r
i
(t + 1) = r
i
(t) + α(t) ·
∑
j
n
j
(t) ·δ
ji
(t)(r
j
(t) −r
i
(t))
∑
j
n
j
(t) ·δ
ji
(t)
(13)
δ
ji
(t) = exp
−
||w
j
−w
i
||
2
γ ×σ(t)
2
(14)
where:
• t, n
j
(t) were defined in Equations 11 and 12,
ICAART 2016 - 8th International Conference on Agents and Artificial Intelligence
134
• α(t) denotes the learning rate at epoch t and con-
trols the rate that positions of neurons are moving,
• δ
ji
(t) is a neighborhood function denoting how
close neurons j and i are (during time t and is
based on their distance in the input space (i.e., dis-
tance computed based on their vectors w
i
),
• γ is a parameter that controls the neighborhood
shrinking as a fraction of σ which was used in
Equation (12)
Notice the similarity of δ
ji
with h
ji
: both are
neighborhood functions and are used to determine
how close two neurons are but the first one does so
using their distances in the feature (input) space while
the latter does so using their distances in the output
space (map).
Equation (13) will adjust neuron’s i position vec-
tor according to the neurons which proved winners for
more patterns in its neighborhood and less (or even
none) according to neurons which were winners for
few patterns (or none). This process enhances the
concept of neighborhood around the neurons that at-
tract more patterns and also allows to cover any empty
spaces in the data representation. It is expected to
improve the training speed, since position updating
will lead to more accurate position vectors that will
be used for the next training epoch and leads to more
insightful representations of the neurons in the output
space.
Learning rate α(t) can also be set to a small value
0.01 since the neighborhood function controls well
the percentage of change in the position vectors. It
was selected to update the position vectors with this
hybrid on-line-batch SOM rule, due to the fact that
output space is much smaller (in most SOM applica-
tions) than the input space, so in many cases minor
adjustments (than major repositioning of the neurons)
are more necessary in order to guarantee satisfactory
training but also representation. Also note that the pa-
rameter γ which controls neighborhood shrinking for
position can also control how fast the map will be up-
dated and how neurons are going to affect each other.
3.2.2 Adding and Removing Neurons
During the weight updating process, for each input
(pattern) the best matching neuron is determined (N
a
)
and also the second best matching (N
b
). At this step
the age of all edges between N
a
and its neighbors is
increased. Afterwards, N
a
is connected to N
b
. If both
of the neurons were already connected then their age
is reset to zero. This is another step that implements
the competitive learning rule, since for each new pat-
tern, a new edge connecting the two closest neurons
is drawn. This process is repeated for all patterns as
they are presented to the AMSOM. Finally, at the end
of the epoch for each incident edge between neurons
(i, j), if A(i, j) ≥ age
max
, then this edge is removed.
age
max
can be set to a value not small enough (so as
to avoid many disconnections) but also not big enough
(so as to avoid having a fully connected grid). In our
experiments this value was 30. If either of the impli-
cated neurons becomes isolated from the remainder
of the structure, then it is removed from the grid. The
aim here is to remove edges that are no longer use-
ful because they are replaced by younger edges that
are created during the AMSOM training. That is the
reason that each time two neurons are connected by
an edge, then its age is reset to zero. By this process,
neurons that were connected incidentally -especially
at the beginning of the training when the map is still
under forming- are disconnected after some epochs.
This process has two distinct advantages: (a) self-
organization and competitive learning will allow af-
ter some epochs the removal of redundant number of
neurons and (b) adjustment of connections between
neurons so as to enhance topological properties of
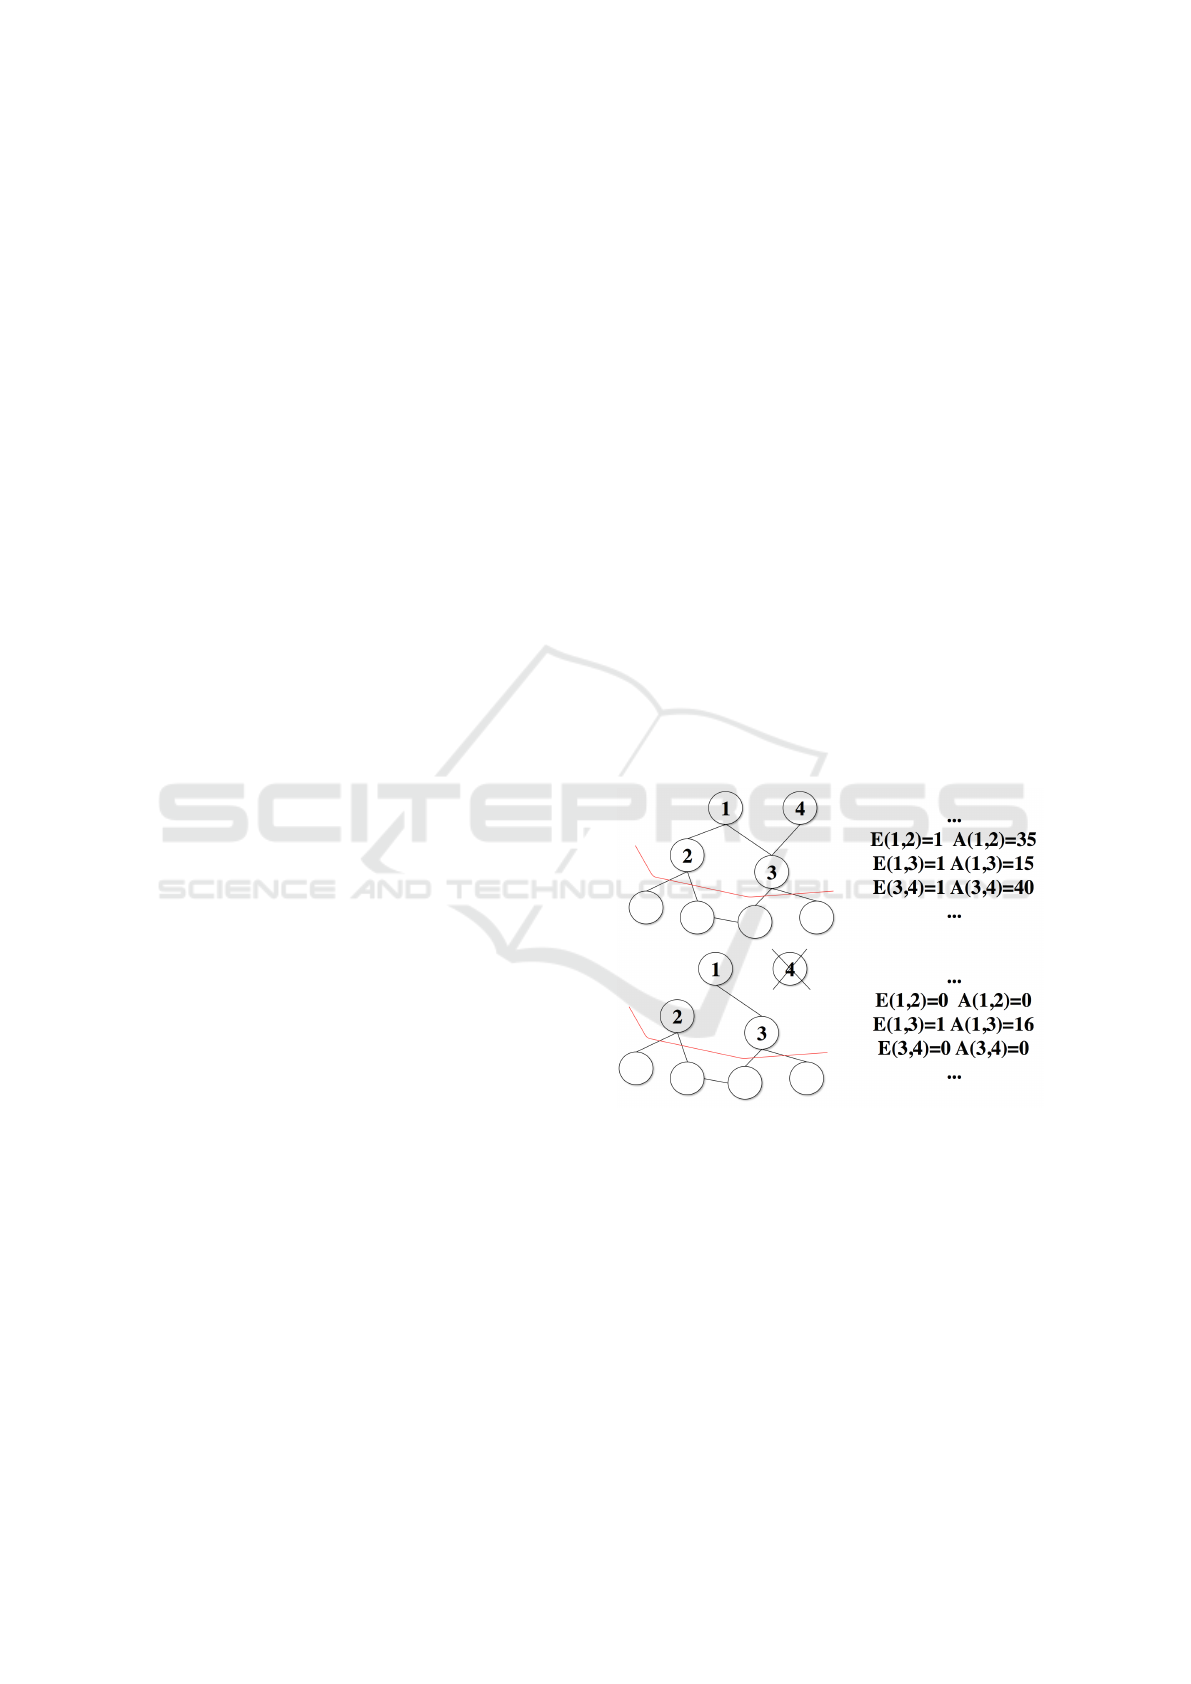
the dataset. An example of a removal of a neuron
is shown in Figure 6 along with the necessary adjust-
ments to matrices A and E.
Figure 6: The process of removing neurons in a part of AM-
SOM: With age
max
set to 30, neuron 4 is disconnected from
neuron 3 and neuron 1 is disconnected from neuron 2 (no-
tice that matrices A and E are updated accordingly). Neuron
4 is left with no connections so it is removed.
Also, there is the possibility that after some
epochs (t
add
), new neurons are added. The criterion
is based on the training progress and when an addi-
tion happens, then new neurons can be added only af-
ter a number of epochs (t
add
) in order to allow weight
adaptation of the map, before evaluating current struc-
ture. First step is to spot the neuron N
u
with the largest
quantization error. A new neuron will be added, if its
quantization error is higher than GT, where GT is the
AMSOM: Adaptive Moving Self-organizing Map for Clustering and Visualization
135
growing threshold of the map: A high value for GT
will result in less spread out map and a low GT will
produce a more spread map. If the quantization error
satisfies the above condition then its Voronoi region
is considered to be under-represented and therefore a
new neuron has to be added to share the load of the
high-error-valued neuron.
Regarding the new neuron that will be added, we
follow the the biological process of ‘cell division’
(Odri et al., 1993). By this way the neuron with the
highest quantization error is ‘splitted’ to two new neu-
rons (instead of just adding one new neuron some-
where at random with no connections at all). Both
new neurons preserve the same connectivity (and also
they are connected to each other) with the original
neuron, thus we achieve a preservation of behavioral
link between the parent and the offspring. Regard-
ing the exact position of the two neurons the follow-
ing process is followed: Neuron with the largest error
among N
u
’s neighbors is spotted (let it be N
v
). One
neuron will preserve N
u
’s position and the other one
will be placed in the middle between N
u
and N
v
. In
detail, weights and positions of the two new neurons
(u
1
and u
2
) are calculated using the following Equa-
tions:
w
u1
= (1 + β) ×w
u
(15)
w
u2
= −β ×w
u
(16)
r
u1
= r
u
(17)
r
u2
=
r
u
+ r
v
2
(18)
where w
u
refers to the weight vector of neuron u
(neuron that is splitted) and β is a mutation parame-
ter which can take either a fixed or random value ac-
cording to a certain distribution rule (following (Odri
et al., 1993)). In any case, value of β has to be chosen
small in order to avoid a large change both in net-
work topology but also in the weight vectors. In this
paper, β takes a random value according to a Gaus-
sian distribution with a mean of zero and variance
of one. New neurons retain the same connectivity to
other neurons as the parent neuron but age weights are
zeroed. The process of adding a new neuron (along
with any changes in matrices E and A) is described in
Figure 7.
It has to be pointed out that there is the possibil-
ity that a neuron would be removed from a region of
the map and to be added in another region (removing
and adding neurons are consecutive processes). This
comes to agreement with several theories in neural or-
ganization, suggesting that cortical regions can adapt
to their input sources and are somewhat interchange-
able or ‘reusable’ by other modalities, especially in
vision- or hearing-impaired subjects (Wedeen et al.,
2012).
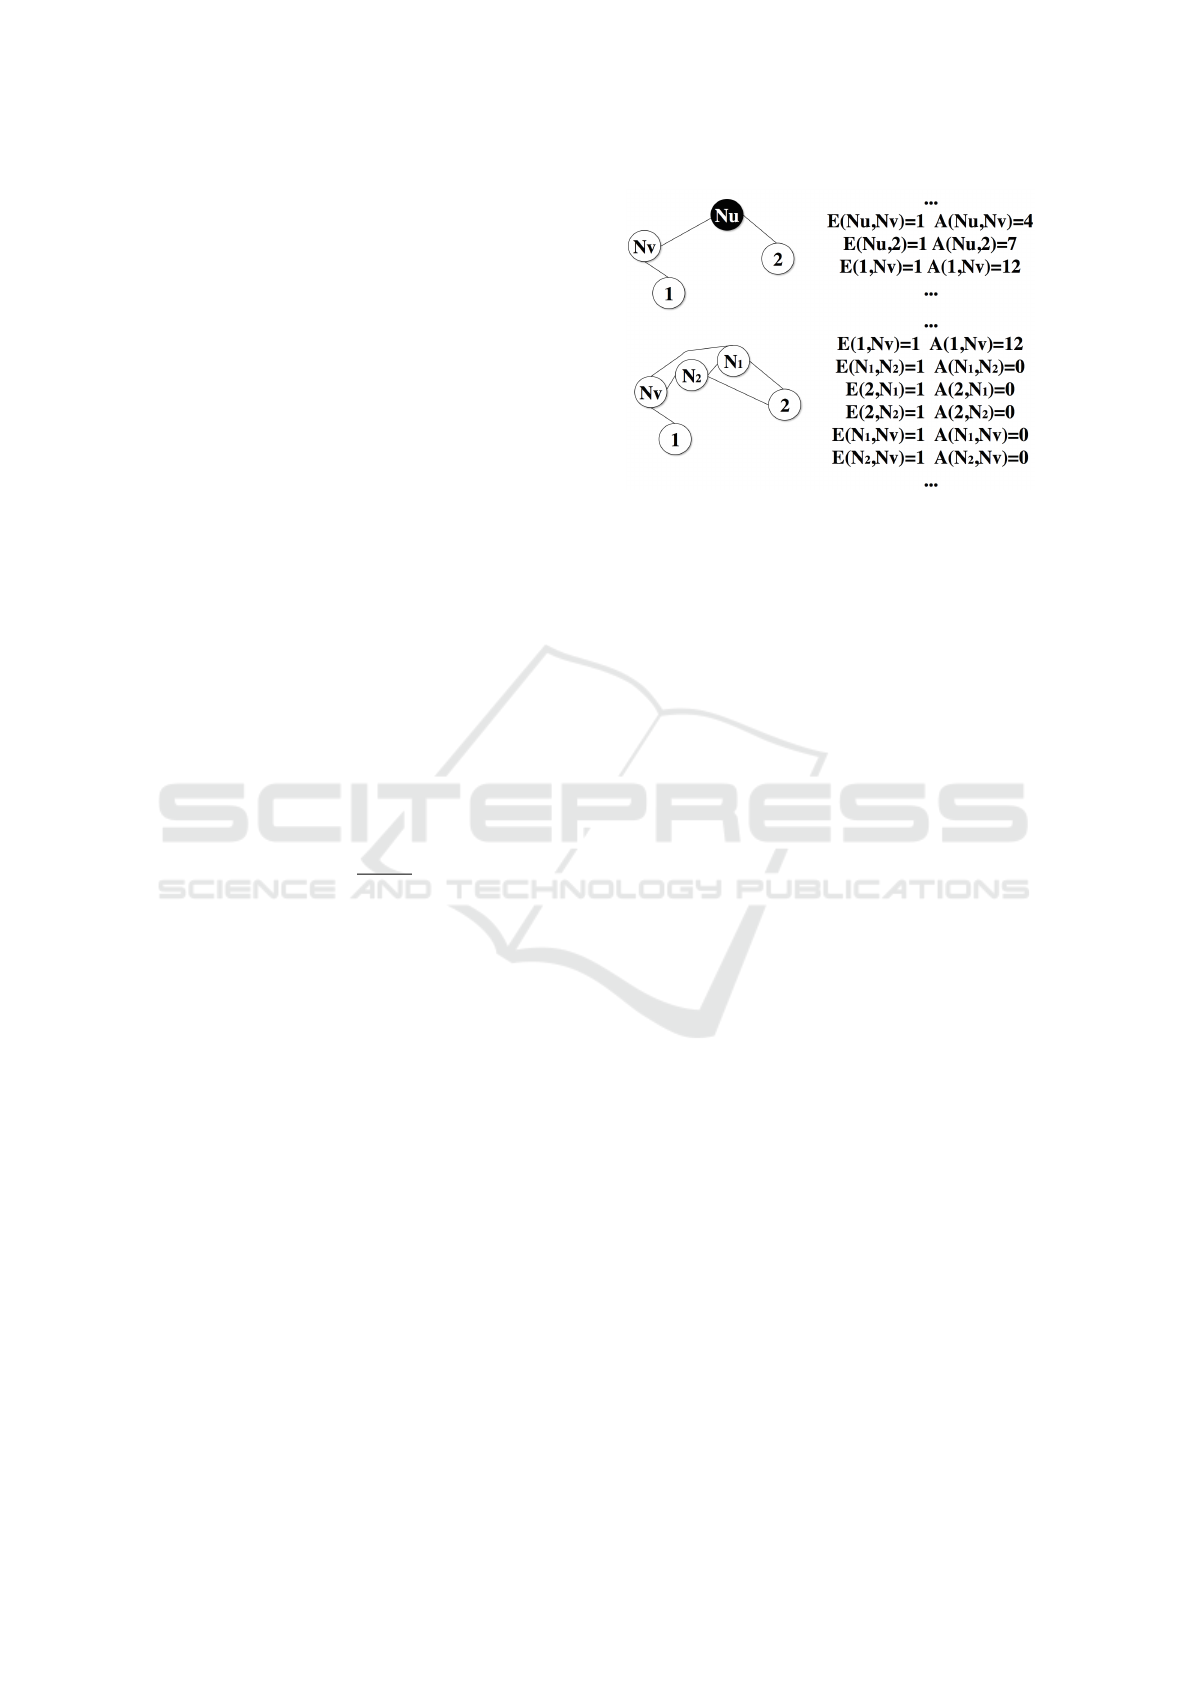
Figure 7: The process of adding new neurons in a part
of AMSOM: N
u
is highlighted as the neuron with the
highest error and N
v
is the neuron among its neighbors
with the largest error. Neurons N
1
and N
2
are added in-
stead of N
u
, matrices E and A are updated accordingly and
weight/position vectors are determined by Equations 15-18.
3.2.3 Architecture Adaptation and Termination
Criterion
As it is described before, initial structure of AMSOM
is adapted through learning and training in order to
find what is optimal for the number of neurons, their
weights and their connections. The adaptation pro-
cess starts by training the initial structure of AMSOM.
When the criteria of adding or removing neurons are
satisfied, then the network is adapted. In order to
maintain (as possible) the initial structure (i.e., rectan-
gular or hexagonal or any other lattice selected), after
this adaptation process we re-evaluate all connections
of all neurons and make sure that each neuron has at
most Q neighbors (where Q is decided in the begin-
ning, i.e., in the case of rectangular lattice, Q = 4):
This can be ensured by checking edge matrix E af-
ter each epoch and if a neuron is found to have more
than Q connections then only the Q-‘recent’ are kept
(utilizing age of edges in matrix A). This process is
presented in Figure 8.
By this training scheme, AMSOM adapts simulta-
neously the structure of the map (number of neurons
and connections) and the weight vectors. Removing
and adding neurons occur when different criteria are
met, so they can be applied in any sequence, depend-
ing on when the criteria are satisfied. By applying
these operations repeatedly, AMSOM is expected to
find a near-optimal structure and representation of a
given dataset.
Finally, like every SOM algorithm, AMSOM has
an upper limit of epochs that training takes place. This
number is set to 1000 but there is also a premature
termination criterion depending on the mean quanti-
zation error change between two consecutive epochs.
ICAART 2016 - 8th International Conference on Agents and Artificial Intelligence
136
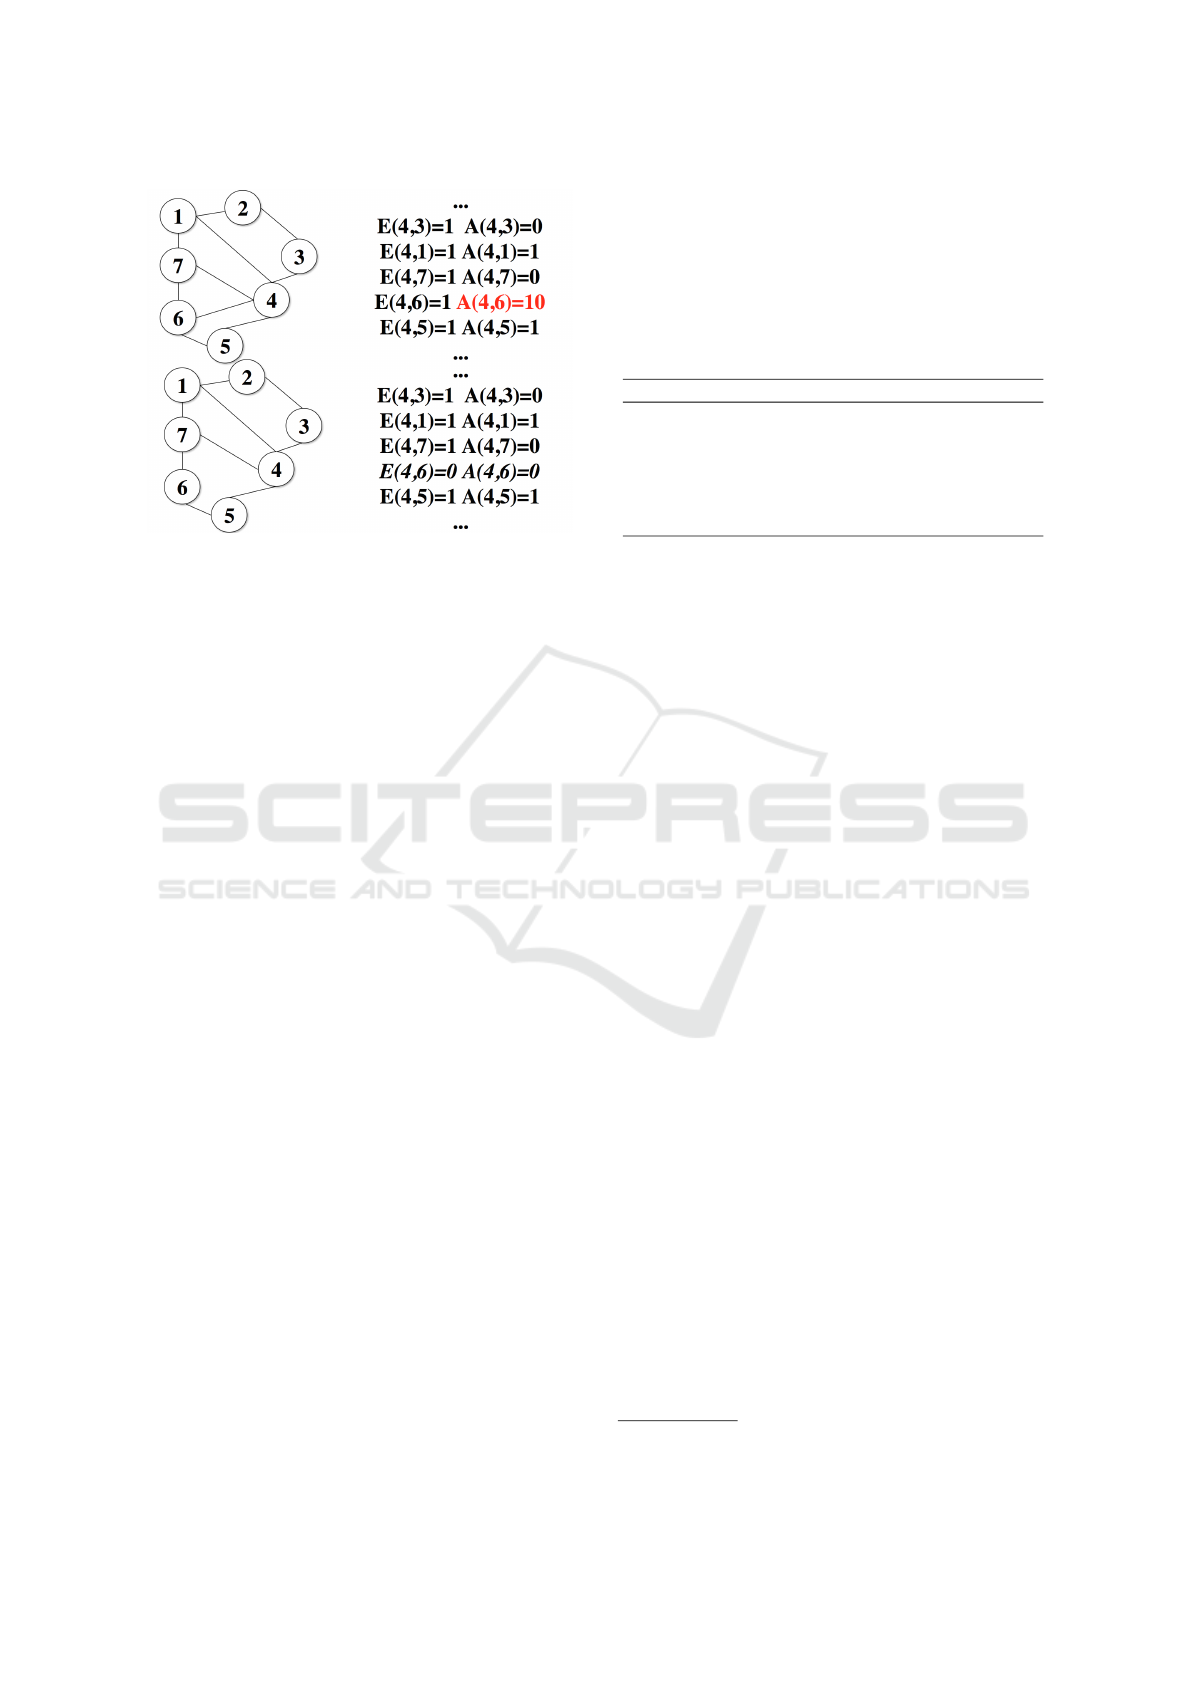
Figure 8: Maintaining the structure of AMSOM: With Q =
4 (i.e., a rectangular grid) neuron 4 is connected to five neu-
rons, so it’s connection with neuron 6 (oldest connection) is
removed.
Thus, if mqe(t) −mqe(t −1) < ε
1
where ε
1
is a small
value (like 1E −06) then the map has reached the de-
sired size (according to the GT provided) and training
is terminated.
3.3 Phase III: AMSOM Finalization
Final phase of AMSOM happens when learning is
complete and structure of the network is not any more
changing. No neurons are added or removed at this
phase and no connections between neurons are added
or removed but weight and position vector adapta-
tion is continued with a lower rate. Purpose of this
process is to smooth out any quantization error and
fine tune weights and positions of the neurons, es-
pecially for neurons added at the latter epochs. For
this purpose, neighborhood function (both for Equa-
tions 11 and 13 is constrained only to the immedi-
ate neighborhood and learning rate α(t) in Equation
(13) is set to 0.001 (even smaller than in phase II).
Phase III is concluded when there is no significant
change in change in mean quantization error (i.e.,
when mqe(t) −mqe(t −1) < ε
2
), where ε
2
is set to
a smaller value than ε
1
(like 1E −10).
4 EXPERIMENTS
AMSOM performance has been tested with several
literature datasets in order to evaluate both map qual-
ity (in terms of topology preservation) and the num-
ber of epochs needed to converge. Quantization Error
(QE) and Topographic Error (TE) were used as in-
trinsic measures of evaluation (for more details read-
ers are encouraged to read (Bauer et al., 1999)). All
datasets were provided by the UCI repository
1
, ex-
cept the CLUSTER dataset which is a simple and
random but large two-dimensional dataset with four
groups. All datasets used with their characteristics are
presented in Table 1.
Table 1: Datasets characteristics.
Dataset name Instances Features Classes
CLUSTER 1000 2 4
IRIS 150 4 3
WINE 178 13 7
IONOSPHERE 351 35 2
CANCER 699 9 2
GLASS 214 10 7
Each dataset in shuffled and split to training, test-
ing and validation set (60%, 20% and 20% respec-
tively). Each experiment was performed 20 times and
the results presented here are average over these runs
(deviations were small and are not presented here).
Results for AMSOM QE and TE (compared to clas-
sic SOM) along with the number of neurons used by
each model are presented in Table 2. From this Table
it is obvious that AMSOM’s performance is much bet-
ter than classic SOM. AMSOM starts from the same
number of neurons as classic SOM but by removing
and adding neurons when necessary reaches a num-
ber which is suitable to represent the dataset. Both
QE and TE are improved using AMSOM algorithm
and this improvement is more significant in TE be-
cause of the neuron position changing which allows
the map to better adjust to the dataset.
Visualization results for three of the datasets are
presented in Figures 9 through 11. In these figures
final positions of the neurons and their final positions
are represented. For each neuron a majority vote crite-
rion was used in order to determine the class that this
neuron represents. For the simple CLUSTER dataset
it is obvious that the four classes are identified and
the grid structure can effectively represent their rela-
tions. For the IRIS dataset one class is completely
identified whereas the other two (which are more sim-
ilar) are also highlighted. Also notice that neurons
that belong to the same class are mostly connected
with each other on the grid and only some sponta-
neous connections between classes exist. Finally, for
the more demanding IONOSPHERE dataset (see the
relatively higher QE), AMSOM manages to differen-
tiate in a great degree the two classes. Neuron grids in
all figures also reveal that the percentage of dead units
(neurons that do not represent any pattern) is signifi-
cantly small, which is an improvement to the classic
1
http://archive.ics.uci.edu/ml/
AMSOM: Adaptive Moving Self-organizing Map for Clustering and Visualization
137
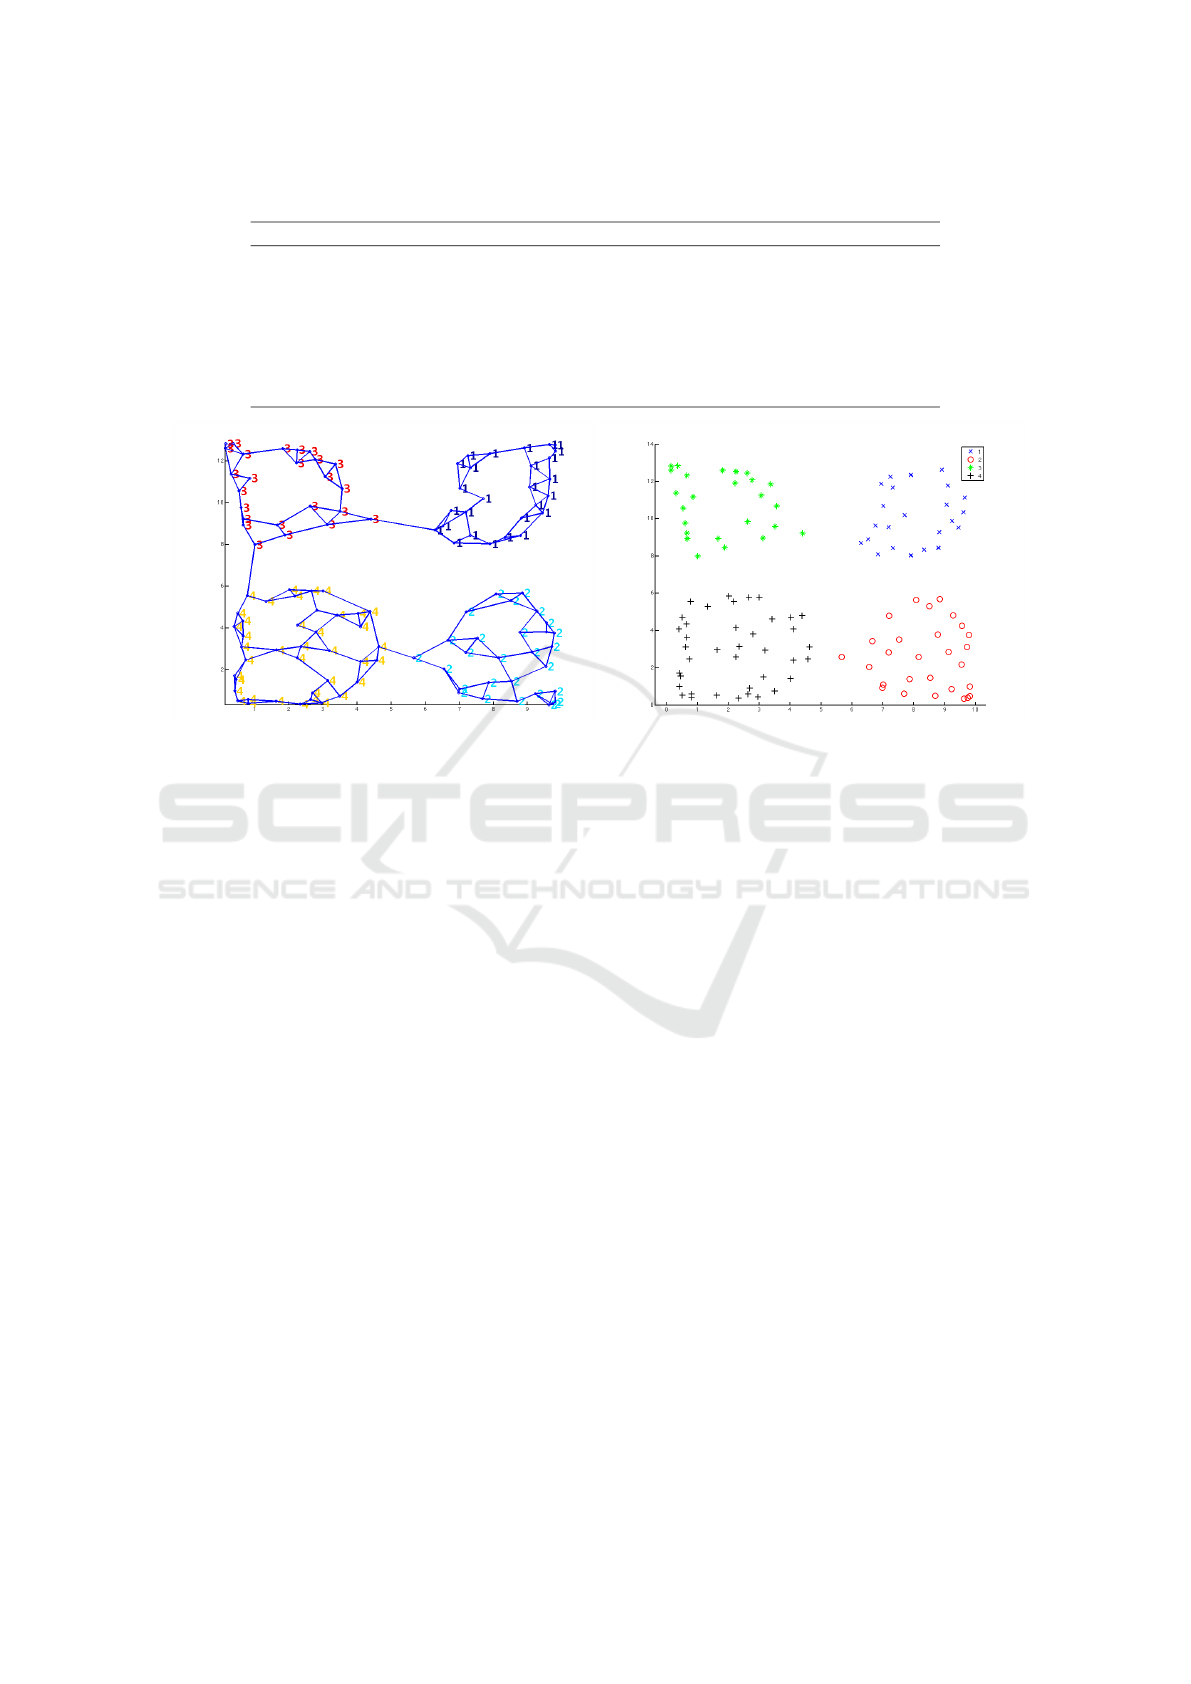
Table 2: Quality of AMSOM compared to classic SOM and number of neurons.
QE TE Number of neurons
Dataset name AMSOM SOM AMSOM SOM AMSOM SOM
CLUSTER 0.108 0.1090 0.028 0.063 121 154
IRIS 0.1047 0.3930 0.009 0.013 37 66
WINE 1.7394 1.8830 0.008 0.017 42 66
IONOSPHERE 2.5697 2.9418 0.0026 0.0057 78 91
CANCER 0.7941 0.9456 0.0145 0.0286 103 132
GLASS 0.9797 1.1178 0.0041 0.0093 43 72
(a) Neuron grid (b) Neuron classes
Figure 9: Visualization results for CLUSTER dataset (4 classes).
SOM algorithm (fewer inactive neurons).
Regarding the spread factor (SF) which controls
the growing threshold (GT ), a value 0.5 was chosen
for this series of experiments because for all datasets
it yielded satisfactory results. In the general case that
there is no prior knowledge on the data examined,
a low value of SF (0-0.3) will allow highlighting of
the most significant clusters. Regarding γ parame-
ter of Equation (13) it was found that it can effec-
tively control the spreading or shrinking of neighbor-
hood during position updating and by this way cre-
ating more isolated or more connected clusters. Sev-
eral experiments were conducted (not presented here
due to space limitations) and showed that small val-
ues of gamma (1 till 10) produce the best results for
all datasets. The higher the γ, the better topographic
preservation (reduced TE) but the quantization error
(QE) rises. Also, high values of γ tend to increase the
number of neurons that remain unused (dead units)
whereas values close to 100 tend to approach the clas-
sic SOM algorithm (position updating is minimal).
Two more parameters that need to be adjusted are
age
max
and t
add
. For both parameters, 30 epochs were
found to be optimal, which is sound given the fact that
30 epochs are enough time to see if current structure
performs well (reduced QE) or if adjustments needed
(adding/removing neurons).
Complexity of the developed algorithm is slightly
increased due to the need for updating matrices A and
E and also due to the more flexible structure. This
overhead is partly counterbalanced by the faster train-
ing process (in all experiments there was a decrease
in epochs number around 20%) since updating neu-
ron positions clearly improves training time (requires
less epochs) but for memory intensive tasks (like big
datasets) this might be become a drawback for the al-
gorithm.
5 CONCLUSION
In this paper we presented AMSOM, an extension
to original SOM algorithm which allows neurons to
change positions according to a similar competitive
technique used in classic SOM training. Moreover,
neurons can be added or removed during this “dou-
ble” training process allowing for a more flexible
structure grid which is able to represent the dataset
more efficiently. Experimental results on different
datasets improve performance of AMSOM compared
to classic SOM algorithm. AMSOM produces bet-
ter reference vectors by reducing the quantization er-
ror, topology is preserved through the neuron moving
by significantly reducing the Topographic Error and
the visualization result matches as much as possible
the original dataset partitions. Also, AMSOM pro-
ICAART 2016 - 8th International Conference on Agents and Artificial Intelligence
138
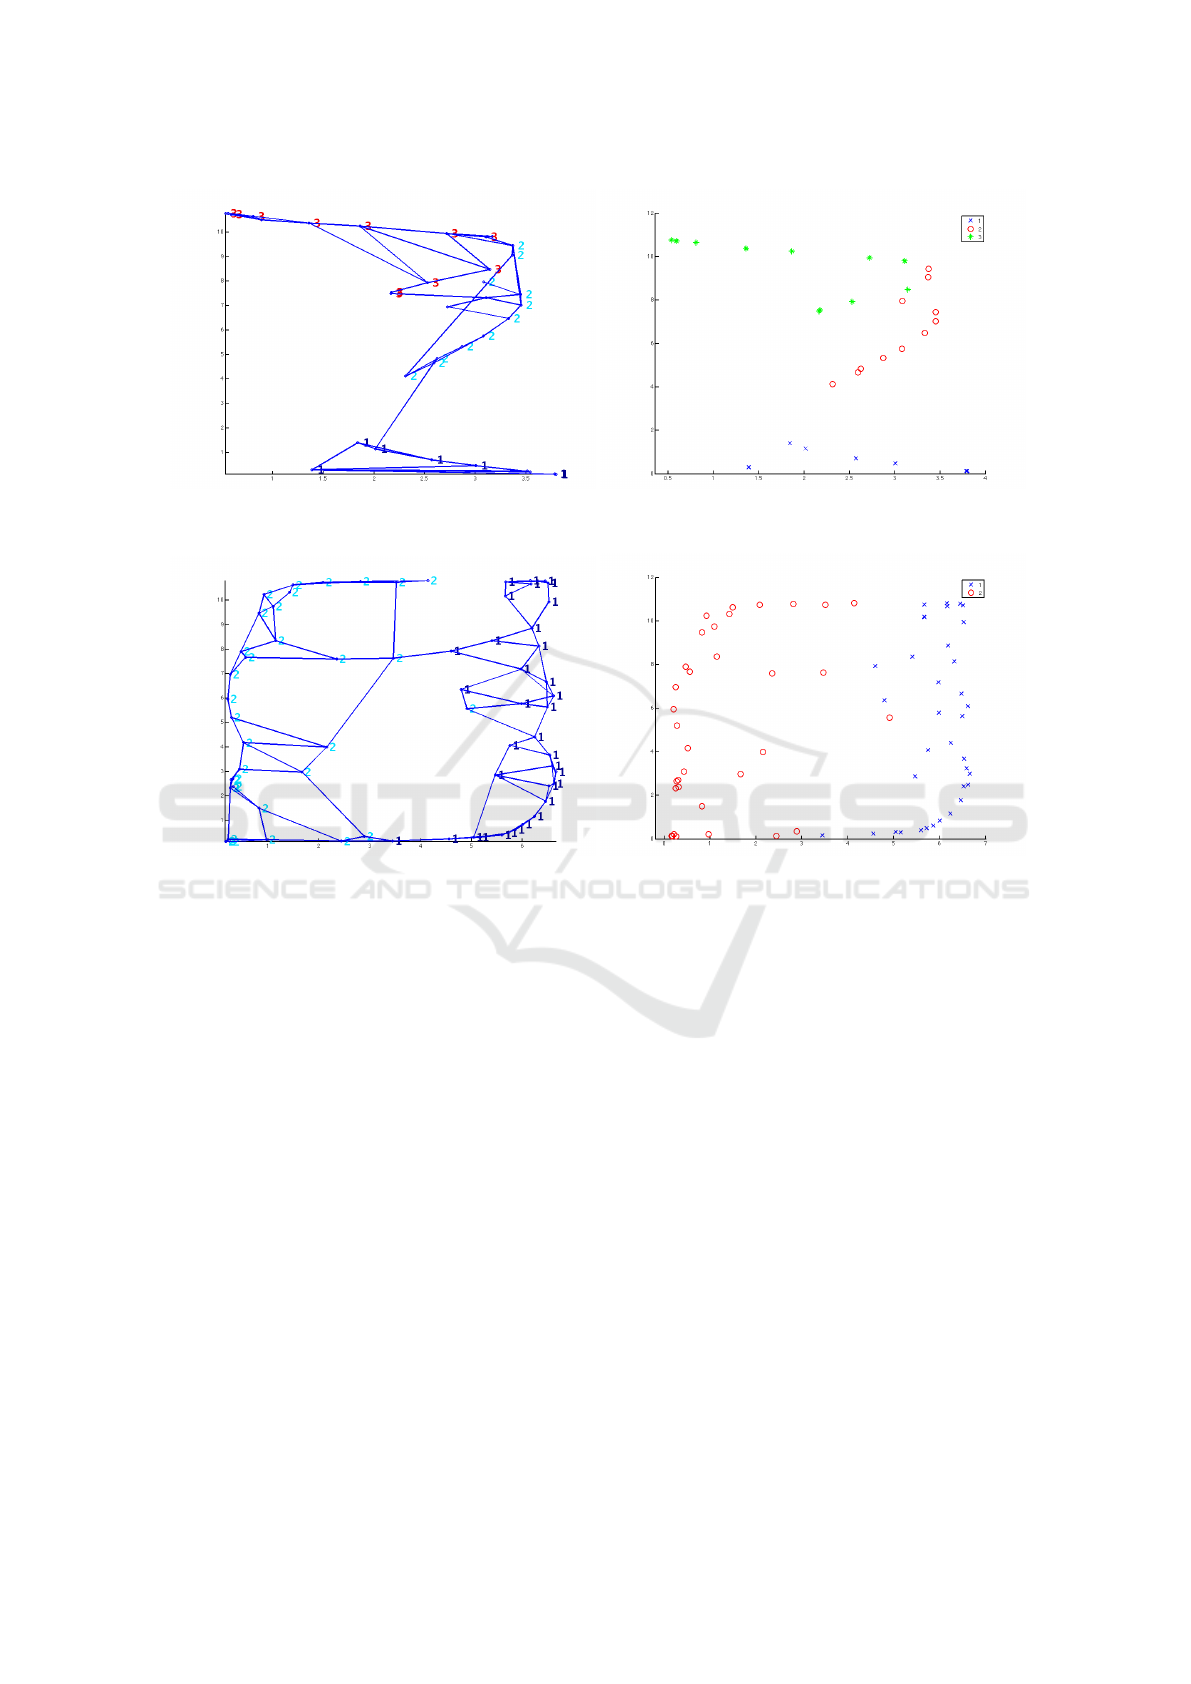
(a) Neuron grid (b) Neuron classes
Figure 10: Visualization results for IRIS dataset (3 classes).
(a) Neuron grid (b) Neuron classes
Figure 11: Visualization results for IONOSPHERE dataset (2 classes).
duces fewer nodes with no significant effect while at
the same time it reduces required number of epochs.
Obtained results give new insights on how to uti-
lize the concept of competitive learning and self-
organization in neural networks and will be exam-
ined in more detail so as to further improve perfor-
mance and investigate behavior in bigger and real-life
datasets (images, text, etc.). For this purpose, draw-
backs of the algorithm (the need to tune four parame-
ters and the memory cost) will be addressed in order
to further facilitate visualization and clustering (espe-
cially in large datasets).
REFERENCES
Alahakoon, D., Halgamuge, S. K., and Srinivasan, B.
(2000). Dynamic self-organizing maps with con-
trolled growth for knowledge discovery. Neural Net-
works, IEEE Transactions on, 11(3):601–614.
Ayadi, T., Hamdani, T. M., and Alimi, A. M. (2012).
MIGSOM: multilevel interior growing self-organizing
maps for high dimensional data clustering. Neural
processing letters, 36(3):235–256.
Bauer, H.-U., Herrmann, M., and Villmann, T. (1999). Neu-
ral maps and topographic vector quantization. Neural
networks, 12(4):659–676.
Blackmore, J. and Miikkulainen, R. (1993). Incremen-
tal grid growing: encoding high-dimensional struc-
ture into a two-dimensional feature map. In Neural
Networks, 1993., IEEE International Conference on,
pages 450–455.
Bortman, M. and Aladjem, M. (2009). A growing and prun-
ing method for radial basis function networks. Neural
Networks, IEEE Transactions on, 20(6):1039–1045.
Ceccarelli, M., Petrosino, A., and Vaccaro, R. (1993). Com-
petitive neural networks on message-passing parallel
computers. Concurrency: Practice and Experience,
5(6):449–470.
Changeux, J.-P. and Danchin, A. (1976). Selective sta-
bilisation of developing synapses as a mechanism
for the specification of neuronal networks. Nature,
264(5588):705–712.
Deboeck, G. and Kohonen, T. (2013). Visual explorations in
finance: with self-organizing maps. Springer Science
& Business Media.
Doherty, K., Adams, R., and Davey, N. (2005). TreeGNG-
AMSOM: Adaptive Moving Self-organizing Map for Clustering and Visualization
139

hierarchical topological clustering. In ESANN, pages
19–24.
Dowling, J. E. (2007). The Great Brain Debate: Nature Or
Nurture? Princeton University Press.
Est
´
evez, P. A., Pr
´
ıncipe, J. C., and Zegers, P. (2012). Ad-
vances in Self-Organizing Maps: 9th International
Workshop, WSOM 2012 Santiago, Chile, December
12-14, 2012 Proceedings. Springer Science & Busi-
ness Media.
Fort, J.-C. (2006). Soms mathematics. Neural Networks,
19(6):812–816.
Fritzke, B. (1994). Growing cell structuresa self-organizing
network for unsupervised and supervised learning.
Neural networks, 7(9):1441–1460.
Fritzke, B. (1995). Growing grida self-organizing net-
work with constant neighborhood range and adapta-
tion strength. Neural Processing Letters, 2(5):9–13.
Fritzke, B. et al. (1995). A growing neural gas network
learns topologies. Advances in neural information
processing systems, 7:625–632.
Han, H.-G. and Qiao, J.-F. (2013). A structure optimisation
algorithm for feedforward neural network construc-
tion. Neurocomputing, 99:347–357.
Hodge, V. J. and Austin, J. (2001). Hierarchical growing
cell structures: TreeGCS. Knowledge and Data Engi-
neering, IEEE Transactions on, 13(2):207–218.
Islam, M., Sattar, A., Amin, F., Yao, X., and Murase, K.
(2009). A new adaptive merging and growing algo-
rithm for designing artificial neural networks. Sys-
tems, Man, and Cybernetics, Part B: Cybernetics,
IEEE Transactions on, 39(3):705–722.
Kohonen, T. (1981). Automatic formation of topological
maps of patterns in a self-organizing system.
Kohonen, T. (1988). The’neural’phonetic typewriter. Com-
puter, 21(3):11–22.
Kohonen, T. (1993). Things you haven’t heard about the
Self-Organizing Map. In Neural Networks, 1993.,
IEEE International Conference on, pages 1147–1156.
IEEE.
Kohonen, T. (2001). Self-organizing Maps, vol. 30 of
Springer Series in Information Sciences. Springer
Berlin.
Kohonen, T. (2012). Self-organization and associative
memory, volume 8. Springer.
Lagus, K., Honkela, T., Kaski, S., and Kohonen, T. (1999).
WEBSOM for textual data mining. Artificial Intelli-
gence Review, 13(5-6):345–364.
Lu, S.-y. (1990). Pattern classification using self-organizing
feature maps. In 1990 IJCNN International Joint Con-
ference on, pages 471–480.
Marsland, S., Shapiro, J., and Nehmzow, U. (2002). A self-
organising network that grows when required. Neural
Networks, 15(8):1041–1058.
Mulier, F. and Cherkassky, V. (1994). Learning rate sched-
ules for self-organizing maps. In Pattern Recognition,
1994. Vol. 2-Conference B: Computer Vision &
Image Processing., Proceedings of the 12th IAPR In-
ternational. Conference on, volume 2, pages 224–228.
IEEE.
Odri, S. V., Petrovacki, D. P., and Krstonosic, G. A. (1993).
Evolutional development of a multilevel neural net-
work. Neural Networks, 6(4):583–595.
Park, Y.-S., Tison, J., Lek, S., Giraudel, J.-L., Coste,
M., and Delmas, F. (2006). Application of a self-
organizing map to select representative species in mul-
tivariate analysis: A case study determining diatom
distribution patterns across France. Ecological Infor-
matics, 1(3):247 – 257. 4th International Conference
on Ecological Informatics.
Rauber, A., Merkl, D., and Dittenbach, M. (2002).
The growing hierarchical self-organizing map: ex-
ploratory analysis of high-dimensional data. Neural
Networks, IEEE Transactions on, 13(6):1331–1341.
Spanakis, G., Siolas, G., and Stafylopatis, A. (2012).
DoSO: a document self-organizer. Journal of Intel-
ligent Information Systems, 39(3):577–610.
Vesanto, J., Himberg, J., Alhoniemi, E., and Parhankangas,
J. (2000). SOM toolbox for Matlab 5. Citeseer.
Wedeen, V. J., Rosene, D. L., Wang, R., Dai, G., Mor-
tazavi, F., Hagmann, P., Kaas, J. H., and Tseng, W.-
Y. I. (2012). The geometric structure of the brain fiber
pathways. Science, 335(6076):1628–1634.
Yang, S.-H. and Chen, Y.-P. (2012). An evolutionary con-
structive and pruning algorithm for artificial neural
networks and its prediction applications. Neurocom-
puting, 86:140–149.
ICAART 2016 - 8th International Conference on Agents and Artificial Intelligence
140
