
Monitoring Energy Consumption on the Service Level
A Procedure Model for Multitenant ERP Systems
Hendrik Müller, Carsten Görling, Johannes Hintsch, Matthias Splieth,
Sebastian Starke and Klaus Turowski
Very Large Business Applications Lab, Faculty of Computer Science, Otto von Guericke University Magdeburg,
Universitätspl. 2, 39106 Magdeburg, Germany
Keywords: Energy Consumption, Accounting, Pricing, Service, Cloud, Enterprise Resource Planning, Multitenancy.
Abstract: In this paper, we describe a procedure model for monitoring energy consumption of IT services. The model
comprises the steps for identifying and extracting the required data, as well as a mathematic model to
predict the energy consumption on both the infrastructure and the service level. Using the example of a
distributed and shared ERP system, in which services are represented by ERP transactions, we evaluate the
procedure model within a controlled experiment. The model was trained on monitoring data, gathered by
performing a benchmark, which triggered more than 1,116,000 dialog steps, initiated by 6000 simulated
SAP ERP users. During the benchmark, we monitored the dedicated resource usage for each transaction in
terms of CPU time, database request time and database calls as well as the energy consumption of all
servers involved in completing the transactions. Our developed procedure model enables IT service
providers and business process outsourcers to assign their monitored hardware energy consumption to the
actual consuming ERP transactions like creating sales orders, changing outbound deliveries or creating
billing documents in watt per hour. The resulting dedicated energy costs can be transferred directly to
overlying IT products or to individual organizations that share a multitenant ERP system. The research is
mainly relevant for practitioners, especially for internal and external IT service providers. Our results serve
as an early contribution to a paradigm shift in the granularity of energy monitoring, which needs to be
carried forward to comply with an integrated and product-oriented information management and the
ongoing extensive use of cloud- and IT service offerings in business departments.
1 INTRODUCTION
Today, a growing amount of business processes is
supported or even autonomously operated by IT.
Energy costs have dramatically increased in recent
years and are to become a major factor in the total
cost of ownership of data centers (Filani et al. 2008;
Orgerie et al. 2014). Consequently, energy
consumption and energy efficiency of IT
components have been investigated by the research
community as well as by IT service providers. While
research mainly addressed energy consumption of
hardware resources like servers or its CPUs and hard
disk drives, information management has
transformed from a technical perspective of “plan-
build-run” to a business perspective of “source-
make-deliver”. Driven by market orientation,
product orientation and product lifecycle
management, business departments consume IT
products delivered by internal and external providers
(Zarnekow et al. 2006). These products do not
typically include the operation of infrastructure
components or complete applications, but the
delivery of fine-granular IT services that utilize
various and virtualized hardware resources
simultaneously. Zarnekow and Brenner (Zarnekow
and Brenner 2003), therefore, argue that “accounting
is no longer based on pre-defined IT development
and operations cost but on product prices. This
allows for direct cost allocation, as the customer of
an IT service directly pays for it by purchasing IT
products.” They further state that “the IT service
provider needs to know his true product costs in
order to be able to calculate his prices.” (Zarnekow
and Brenner 2003) Brandl came to the conclusion
that “resource consumption of applications is a
major cost driver. From a cost accounting
perspective a usage proportional distribution of
Müller, H., Görling, C., Hintsch, J., Splieth, M., Starke, S. and Turowski, K.
Monitoring Energy Consumption on the Service Level - A Procedure Model for Multitenant ERP Systems.
In Proceedings of the 6th International Conference on Cloud Computing and Services Science (CLOSER 2016) - Volume 2, pages 215-222
ISBN: 978-989-758-182-3
Copyright
c
2016 by SCITEPRESS – Science and Technology Publications, Lda. All rights reserved
215

costs, either to applications or to customers, would
be reasonable” (Brandl et al. 2007).
Hence, we state that energy consumption needs
to be monitored on the level of IT services instead of
on the pure hardware level in order to enable usage-
dependent pricing of IT products and energy cost
accounting inside multitenant ERP systems to
individual clients. Therefore, using the example of
an SAP ERP system we developed a procedure
model that enables internal or external IT service
providers to quantify costs for individual services
completed by ERP business transactions. In this
paper, we describe the required steps of the
procedure model and provide a prediction model for
energy costs on the service level. After the
procedure has been implemented, questions similar
to the following can be answered:
How much energy was consumed by
organization “A” for services of “sales and
distribution”?
How much energy did organization B spent
on changing existing outbound deliveries
during the last fiscal year?
Which amount of energy consumed by a
multitenant ERP system can be accounted to
which individual organization?
Furthermore, based on historical data,
predictions of total costs per year grouped by ERP
clients or transactions are possible when adding
energy prices from any internal or external data
source.
In Section 2, we begin with a description of our
research design. We then introduce the developed
procedure model in Section 3. The procedure model
includes the prediction models for infrastructure and
services layer and will be evaluated in Section 4. We
conclude and hold out the prospect of future
research in Section 5.
2 RESEARCH DESIGN
We follow the design science paradigm as described
by Hevner et al. (Hevner et al. 2004). Accordingly,
in our research process we build and evaluate an
artifact in order to address the identified demands,
which are described and motivated in the
introduction. The goal of our research was to
determine a method that helps service providers to
quantify energy costs related to individual provided
IT products and services. For this purpose, we
introduce as the artefact a procedure model that
allows the mapping of measured or predicted energy
costs on the hardware level to single services, which
consecutively support the business process of one or
more customers. The procedure model comprises the
necessary steps, as well as a mathematic model to
predict the energy consumption for a certain
hardware configuration. Accordingly, the research is
mainly relevant for practitioners, especially for
internal and external application-service providers.
We evaluate our artifact by applying it in a
distributed controlled environment. The plausibility
of the prediction model is shown via two
experiments based on measured consumption data
and the research results are communicated in this
paper.
3 PROCEDURE MODEL
In this Section, we introduce the proposed procedure
that includes power prediction models for both
infrastructure and service layer. Thus, we describe a
procedure that enables IT service providers to
determine energy consumption of offered services.
Starting from the measured power consumptions per
minute of servers, we describe how the consumed
energy of particular business transactions can be
quantified and used for further analyses. The
procedure, which we are going to evaluate in Section
4, consists of the following steps:
1. Data source identification
2. ERP workload generation
3. ETL process design
4. Prediction model training and validation
After the last phase has been performed,
providers are able to answer questions like the ones
mentioned in Section 1. Since data is stored inside
the ERP system’s database, custom transactions for
further data processing can be developed depending
on the individually required dimensions of analyses.
In the following, we summarize each phase.
3.1 Data Source Identification
Assuming that the service provider has full access to
the application layer and database layer (and is not
only a reseller or mediator between the customer and
other service providers) he is technically able to
collect power consumption related data on the
hardware components and map them, over the
software components, to some of the logical
components. The relevant measuring points can be
identified at the following locations:
• Power consumption on hardware components
• Resource utilization on software components
• Quantity of usage on logical components
CLOSER 2016 - 6th International Conference on Cloud Computing and Services Science
216
To link these data and obtain a consistent data
basis it is necessary to maintain pairwise matching
identifier in the collected data. In Section 4, we
demonstrate the data connection based on
timestamps, host names and transaction codes.
For SAP ERP systems, the resource consumption
and the quantity of usage, e.g. business transaction
usage, can be gathered from a workload monitor that
provides information about various performance
metrics. According to our experiments, the
following metrics need to be available for each user
activity (dialog step in Figure 1) in order to predict
power consumption of related transactions:
CPU time of application server
database request time
number of database requests
amount of transferred data from database
server to application server
In addition, an increasing amount of hardware
vendors provide power consumption information of
their servers via a standard interface for remote
administration, named Intelligent Platform
Management Interface (IPMI) (Harrell 2015; Intel
2015; Fujitsu 2015). Usually, the provided data can
be extracted into files in the format of comma
separated values (CSV) which holds a consumption
value in Watt for each minute. Both the workload
monitor and a server consumption providing
interface need to be accessible. Furthermore, all
monitored data records must include timestamps, so
that resource usages of dialog steps and power
consumptions can be mapped to each other when
building the prediction models.
3.2 ERP Workload Generation
In order to train the prediction model, data provided
by the previously mentioned sources are required.
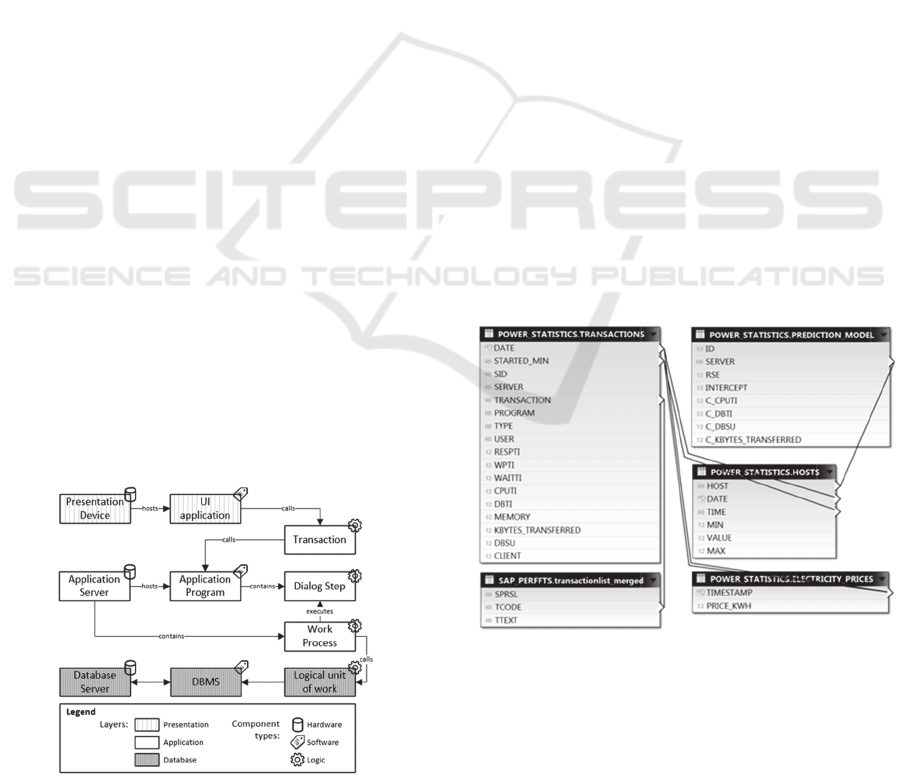
Figure 1: Enterprise resource planning system architecture
(own illustration).
If the ERP system is used productively,
monitoring data of a timeframe that includes
different degrees of utilization can be extracted and
used for model training. In case of ERP systems that
are in implementation phase or stopped for any
reason, benchmarks can be used for simulating a
defined amount of system users that perform
configured transactions. The number of users that
work simultaneously needs to be chosen with the
objective of achieving a maximum range of different
utilization degrees. Figure 1 depicts a typical ERP
system’s architecture and shows the measuring
points identified in Section 3.1 by denoting
component types. The functional principle of the
depicted system architecture is described in more
detail in (SAP01 2015; SAP02 2015; SAP03 2015).
3.3 ETL Process Design
The data that was monitored during the workload
generation need to be processed, whereas power
consumption and resource usage information are
going to be integrated with each other. Therefore,
the database system, which is part of the ERP
system, can be leveraged. Either inside the existing
ERP schema or inside a newly created schema,
tables need to be defined, which correspond to the
structure of the monitored data. An additional table
for holding the coefficients of the prediction models
for each server is required, too. Figure 2 shows an
ER model of tables and attributes that must exist for
storing and processing the measured data.
Figure 2: Tables of ER model.
We explain the chosen structure in more detail when
evaluating its feasibility in Section 4.2. After the
required tables have been created, monitoring data
from the workload generation phase can be
extracted, transformed and loaded (ETL) into the
tables. The resulting ETL process needs to be
Monitoring Energy Consumption on the Service Level - A Procedure Model for Multitenant ERP Systems
217
automated, so that the data can be streamed into the
respective tables during normal operation. Based on
this data, power consumption can be calculated in
real-time using the prediction models created in the
next phase.
3.4 Prediction Model Training and
Validation
Using data from our experiments, we built a
prediction model which predicts the power
consumption of a server based on the monitored
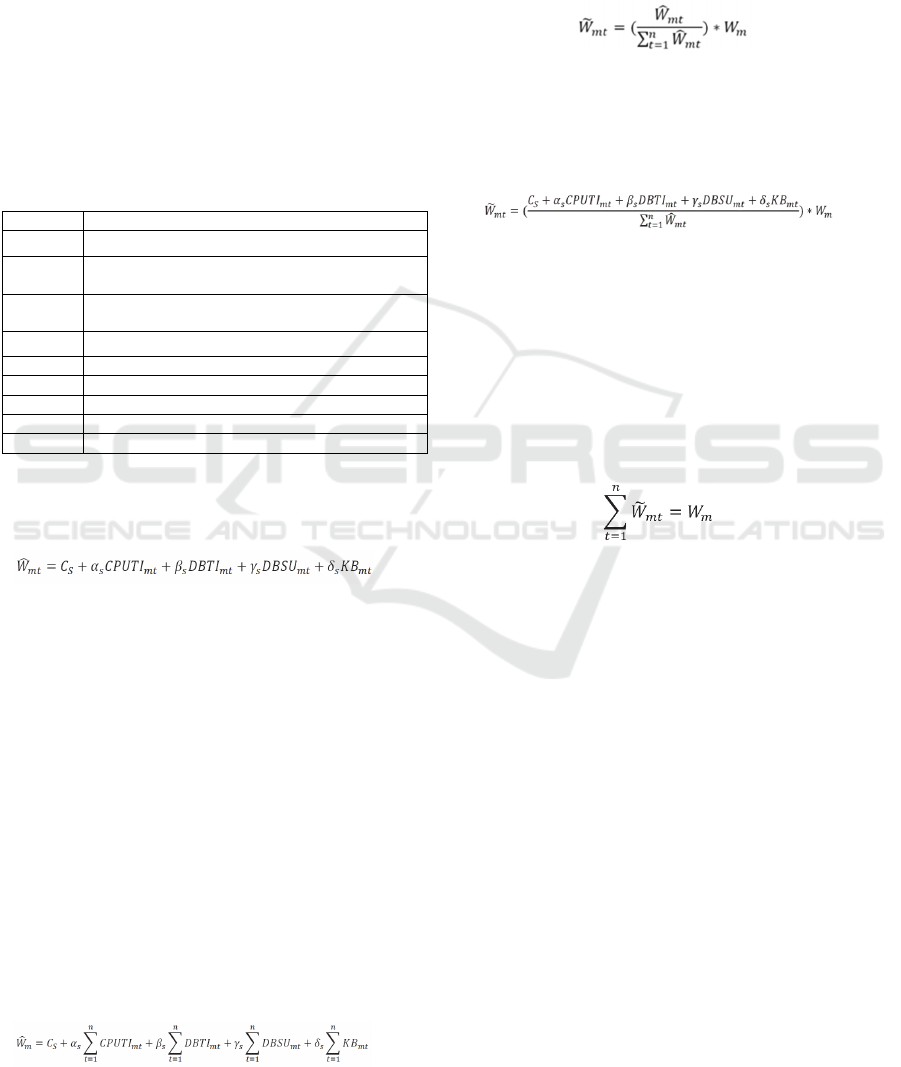
metrics. In the following paragraph we use variables
outlined in Table 1.
Table 1: Used variables and descriptions.
Variable Description
ܹ
Predicted server consumption per minute
ܹ
௧
Predicted server consumption per minute and
transaction
ܹ
෩
௧
Predicted transaction consumption per minute and
transaction
ܹ
Measured consumption per minute
C
s
constant / intercept
CPUTI CPU time on application server in ms
DBTI database request time in ms
DBSU number of database requests
KB transferred data in kilobytes
The model uses a multiple linear regression and
is presented in equation (1), where ܹ
stands for the
predicted watt of a server in a particular minute:
(1)
The model includes a constant C
s,
and the
coefficients alpha, betta, gamma and delta for each
metric, aggregated across all transactions t.
Instantiations of the model can be trained by means
of data collected during the previous phase. For this
purpose, the metrics need to be aggregated for each
minute, so that they represent the total resource
usage by all performed dialog steps within the
system during that minute. The constant C
s
highly
depends on the idle consumption of the respective
server.
For predicting a single transaction’s
consumption, the model can be used, but needs to
consider the remaining transactions within the
focused timeframe, too. When simply applying the
slightly adapted model in equation (2) on metrics for
single transactions, the server’s idle consumption
would be part of any transaction consumption.
(2)
Therefore, the total consumption needs to be
considered in the calculation. We included the total
power consumption W
m
of the respective server into
the model that we created for the services layer and,
in this manner, normalized the predicted transaction
consumption. The resulting calculation looks as
follows:
(3)
When plugging in W
mt
of equation (2) into
equation (3), we get the prediction model for the
normalized energy consumption of a single
transaction within one minute as presented in
equation (4):
(4)
The validation of the server consumption model
(Equation 1) can be performed by comparing the
measured total consumption values and the values
being fitted by the model. The model for consumed
power on services level (Equation 4) needs to be
validated using a plausibility check, since measured
consumption values do not exist on the service level.
Plausibility is assumed if the sum of the predicted
consumptions equals the measured total
consumption of the respective server:
(5)
By training the models of the infrastructure layer
for each server (Equation 1) using monitored data
from the workload generation phase, its coefficients
and the overall residual standard error are
determined. After storing these values inside a table
of the schema created during phase 3, the
coefficients can be used for predicting power
consumption of services by utilizing the model for
services layer (Equation 4). When utilizing database
views, the presented calculations can be stored and
reused. Since SQL provides grouping functionality,
users are able to easily query for energy
consumptions of transactions, clients, users, or
combinations of these within a particular timeframe.
4 PROCEDURE MODEL
EVALUATION
The procedure model, explained in Section 3,
includes the creation of a prediction model for each
server that is part of the ERP system. In the
CLOSER 2016 - 6th International Conference on Cloud Computing and Services Science
218

following section, we evaluate this procedure by
performing a controlled experiment.
In order to be able to introduce all components of
our experiments, we start with introducing the
technical architecture, followed by the workload
generation phase, the data source identification and
the ETL design phase. Since any tool can be used for
extracting data and loading it into our created
schema (see Figure 2), we focus on the model and its
evaluation in the last paragraph of this section.
4.1 Experiment Design
The amount of energy consumed by ERP
transactions is dependent on their usage of
computing resources. SAP ERP systems provide a
detailed built-in monitoring for the utilized resources
of any performed transactions in terms of metrics
like CPU milliseconds, database request times and
many more. Naturally, power consumption can be
measured on the infrastructure layer only and always
includes the sum of all activities performed by the
monitored component. In order to determine the
influence of each metric on the actual consumed
power, we mapped the total resource usage at a time
to the total power consumption of involved servers
at the same time and trained the prediction model on
that data. In this chapter, we describe the
experiments that were performed to generate and
monitor significant load and the related power
consumption.
4.1.1 Technical Infrastructure
In order to generate load and monitor the involved
resources in a controlled environment, we installed a
dedicated SAP ERP system for the purpose of our
experiments. This system was installed following the
three-tier architecture presented in Figure 1. Thus,
the application and database layer are using
dedicated servers. As the hardware characteristics
are not relevant for the scope of the procedure
model, we omit technical server details here.
In our setup, the application layer was distributed
horizontally across four SAP application instances
running on one physical host. This was necessary
due to the limited amount of users, which can be
handled per SAP application instance. In addition,
the landscape we set up includes a central time
server that ensures exact timestamps for all entries
created by different monitoring applications on both
servers. A fourth server was used to provide
prediction functionality using “R” and “Rserve” (R
2015). We integrated this service with our database
in order to build prediction models from within SQL
procedures without media disruption.
4.1.2 Benchmark Runs
For generating a significant and measurable amount
of load, we used the SAP Sales & Distribution (SD)
benchmark, which allowed us to create a defined
number of users per client within a given SAP
system (SAP04 2015). During the benchmark run,
these users will trigger certain transactions
simultaneously. Therefore, the SD benchmark is
typically used for rating the maximum possible
throughput of a server in terms of processed order
items per second and similar metrics. Based on
experiences from a number of test runs, we have
chosen the configuration shown in Table 3 for the
final benchmark run.
Table 2: Benchmark configuration.
Characteristic Value
Number of loops
12
Number of dialog steps
1,116,000
Duration
59 minutes
Total number of users
6000
Number of SAP instances
4
Users per instance
1500
Number of clients
6
Users per client
1000
For our purpose, we configured the SD
benchmark run to simulate up to 6000 users. A client
can handle up to 1000 users, so we created 6 clients
within our system, each representing one service
consumer. During the run, each user will login to the
system and perform six distinct transactions in
twelve loops resulting in a total amount of 1,116,000
dialog steps. The SAP standard transactions listed in
Table 4 were performed.
Table 3: Performed standard transactions.
Transaction Description
VA01
Create sales order with 5 order items
VL01N
Create outbound delivery for this sales order
VA03
Display sales order
VL02N
Change outbound delivery
VA05
Create list of 40 sales orders
VF01
Create billing document
Our benchmark run consisted of the three phases
outlined in Table 5. During the first phase, the
configured users start to log on one after another.
For this phase, we configured a sleep time before a
new user logs in, so the amount of active users
increased gradually and we were able to monitor
resource usage and power consumption for any
application server utilization between 0 and 100%.
Monitoring Energy Consumption on the Service Level - A Procedure Model for Multitenant ERP Systems
219

During the phase of high load, about 6000 users
worked simultaneously within the required number
of clients. When the first users completed all loops,
these start to log off and the number of active users
decreases during the last phase.
Table 4: Benchmark phases.
Phase Active Users Duration
(1) Increasing Load
0001 - 5926 24 min
(2) High Load
5977 - 6000 09 min
(3) Decreasing Load
5866 - 0001 26 min
During the benchmark run, we monitored the
utilization of all CPUs on the application server in
order to ensure that the complete utilization range
was reached within the benchmark interval. The
CPU utilization of both the application server and
database server indicate the three phases listed in
Table 5. Since the database server of the used SAP
system comprises significantly more powerful
hardware components than the application server
(see Table 2), its total CPU utilization reached a
maximum of about 15% during the “high load”
phase. Therefore, our trained prediction model
cannot be used to predict the power consumption of
this server based on data gathered from higher
utilization rates. However, we utilized the
application server to its limit, thus, further physical
application servers would need to be added on
application layer of the SAP system, in order to
achieve higher database utilizations. In such cases of
system changes, a new prediction model needs to be
built. In the following section, we describe the
metrics that were monitored during the benchmark
run and further processed to be used for training the
prediction model.
4.2 Monitoring and Result Processing
As described in the previous section, we performed
the SAP SD benchmark in order to generate load.
During the three phases of the benchmark (see Table
4), we monitored the metrics listed in Table 6 for
each minute.
Table 5: Monitored Metrics.
Metric
Granularity Data Source
Power Consumption
Server IRMC Interface
CPU Time
Dialog Step Workload Monitor
Wait Time
Dialog Step Workload Monitor
Database Time
Dialog Step Workload Monitor
Database Requests
Dialog Step Workload Monitor
Transferred Kilobytes
Dialog Step Workload Monitor
Memory Used
Dialog Step Workload Monitor
An increasing amount of hardware vendors
provide power consumption information of their
servers via a standard interface for remote
administration, named Intelligent Platform
Management Interface (IPMI) (Harrell 2015; Intel
2015; Fujitsu 2015). For both servers that we used in
our experiment, we connected to the Integrated
Remote Management Controller (IRMC), which is a
similar interface developed by Fujitsu (Fujitsu
2015), and exported the mean consumed power in
Watt for each benchmark minute. The remaining
metrics are provided by the workload monitor which
is available within any SAP ERP system through the
transaction ST03 (Hienger and Luttig 2015). For
each dialog step performed by any user, the system
creates a record, which holds performance
information (including the ones listed in Table 6), a
timestamp and information about the related user,
application instance and client. Thus, for all
1,116,000 performed dialog steps, the above metrics
have been created and can be exported as a file in
the format of comma-separated-values (CSV).
Finally, we imported all metrics into a common
database schema, called “Power_Statistics”, which
we created inside the database of our ERP system.
The tables of the schema’s entity relationship (ER)
model are presented in Figure 2. The connectors
indicate columns that were joined for subsequent
analysis. All exported metrics from the SAP
workload monitor like CPU time and database
requests were imported into the table
“Transactions”. Information about consumed power
was imported into the table “Host”. Furthermore, we
added tables for storing the coefficients of the
prediction models and energy prices, which can be
obtained from any data source, including external
web services or the ERP system itself. After the
prediction models have been created (see Section
3.4), data can be queried in various dimensions by
means of database views. Under
http://mrcc.ovgu.de/fileadmin/media/documents/fujit
su_lab/Power_Statistics_Schema.zip, we provide
SQL files that can be used to create the
“Power_Statistics” schema including all tables and
views, of which we used some in Section 4.
4.3 Power Prediction Model Evaluation
Using the metrics listed in Table 6, we trained the
prediction models that are described in Section 3.4
for both the application and the database server.
Figure 3 shows (on the left) a high accuracy of the
application server’s model (Equation 1 in Section
3.4) by comparing the fitted vales with the actual,
CLOSER 2016 - 6th International Conference on Cloud Computing and Services Science
220

measured values of total power consumption for
each minute of the benchmark run.
Figure 3: Fitted and measured values for the application
server (left) and the database server (right).
For the application server, its CPU time
represented the most significant metric. For the
database server, the model achieved less but still
convenient accuracy as presented in Figure 3 on the
right. A reason for the difference in accuracy might
be that we were only able to utilize the CPU of the
database server up to 15%, because of its highly
performant hardware configuration and the fact that
we only used one application server in the
benchmark run. The number of database requests
influenced the total power consumption of the
database server most significantly.
After training the models for the infrastructure
layer, we were able to use its coefficients for the
model on the service layer, which is represented in
Equation 4 of Section 3.4. We validated the model
as describes in Equation 5 and proofed that the sum
of the predicted power consumptions of all
performed transactions on application and database
layer during one minute equalled the aggregated
power consumption of the application server and the
database server in that minute. We wrote an SQL
query that performs the calculation as shown in
Figure 4.
Figure 4: Validation of model on the service level.
As can be seen, we queried the table “Hosts” and the
view “Total_Transaction_Consumption” for its
aggregated consumed power within each minute and
showed that the results equal each other. Therefore,
the total power consumption of all servers that form
the SAP ERP system was accounted to performed
transactions on a usage-based manner.
4.4 Result Processing
After the model has been stored inside the
“Power_Statistics”-schema, the power consumption
of any performed transaction can be predicted. We
created views to simplify the analysis in different
dimensions and to add further information like short
descriptions about the actual services that are
completed by the transactions (e.g.
“transactionlist_merged” in Figure 2). Grouping for
clients enables an accounting of consumed energy to
firms that share a multitenant ERP system. The data
can be used either directly within the system by
implementing power-related transactions or by
additional applications. When adding energy prices,
occasioned costs can be monitored on the service
level. To show this exemplary, we added the median
industrial electricity price within the international
energy agency (IEA) of 2013 (Marvin 2013) into an
additionally created table. After joining consumed
power and energy prices, we were able to group
costs by transactions or clients and predict expected
costs per year based on historical data, as shown in
the example presented in Figure 5.
Figure 5: Transaction costs per minute and year.
Since the benchmark that we used for performing
transactions produces a highly homogenous
workload inside each client of the system, the costs
for a single transaction or a single client per minute
differ only slightly. More significant differences
become visible when predicting costs on a yearly
basis (see Figure 5).
5 CONCLUSION AND FUTURE
RESEARCH
In this paper, we described a procedure model that
can be used in conjunction with SAP ERP systems
for quantifying energy costs on the service level.
IT service providers who apply the model are
able to calculate prices of their IT products on a
usage-based manner. In case of multiple
Monitoring Energy Consumption on the Service Level - A Procedure Model for Multitenant ERP Systems
221

organizations using one multitenant ERP system, the
application service provider (ASP) will be able to
allocate energy costs directly to the causing client
that represents the organization. Therefore, we built
prediction models for both the infrastructure and the
services layer. The models use multiple linear
regressions and predict power consumptions based
on resources that are monitored by the ERP system.
We evaluated the procedure and prediction models
using a distributed SAP ERP system that includes
one application server and one database server. In
order to generate a sufficient amount of workload
that can be monitored, we performed an industry
standard benchmark that triggered 1,116,000 dialog
steps by 6000 users. The prediction models on
infrastructure layer were trained using monitored
metrics from the benchmark run. Identified constants
and coefficients of the model could then be used for
predicting power consumption on the service level.
Our procedure model includes storing all metrics,
models and total consumptions inside tables of a
power statistics data schema which can be extended
to hold information on energy prices. The tables and
views can be queried and grouped in various
dimensions allowing detailed energy costs analysis
for transactions or clients or both. The developed
procedure model contributes to a required paradigm
shift in the granularity of energy monitoring in order
to comply with an integrated and product-oriented
information management.
In future work, we plan to generalize the
procedure model so that it can be applied in different
kinds of ERP systems. Furthermore, we work on
extending our model to map energy consumed by IT
services to the actual offered IT products. Therefor
the model needs to consider service oriented
architectures (SOA) in order to achieve an
integration of infrastructure power consumption and
IT product energy costs.
REFERENCES
Brandl, D.-W.-I.R., Bichler, M. & Ströbel, M., 2007. Cost.
accounting for shared IT infrastructures.
Wirtschaftsinformatik, 49(2), pp.83–94.
Filani, D. et al., 2008. Dynamic Data Center Power
Management: Trends,Issues,and Solutions. Intel
Technology Journal, 12(1).
Fujitsu, 2015. FUJITSU Software ServerView Suite -
Remote Management. Available at:
http://manuals.ts.fujitsu.com/file/11470/irmc-s4-ug-
en.pdf.
Harrell, B., 2015. IMM and IMM2 Support on IBM
System x and BladeCenter Servers. Available at:
https://lenovopress.com/tips0849?cm_mc_uid=752447
91481414367799244&cm_mc_sid_50200000=145509
5617.
Hevner, A.R. et al., 2004. Design Science in Information
Systems Research. MIS Quarterly, 28(1). Available at:
http://dblp.uni-
trier.de/db/journals/misq/misq28.html#HevnerMPR04.
Hienger & Luttig, 2015. Workload Monitor (ST03 or
ST03N). Available at: http://wiki.scn.sap.com/wiki/
pages/viewpage.action?pageId=17472.
Intel, 2015. Intelligent Platform Management. Available
at: http://www.intel.com/content/www/us/en/servers/
ipmi/ipmi-home.html.
Marvin, J., 2013. Industrial Electricity Prices in the IEA.
Available at: https://www.gov.uk/government/statis
tical-data-sets/international-industrial-energy-prices.
Orgerie, A.-C., De Assuncao, M.D. & Lefevre, L., 2014.
A Survey on Techniques for Improving the Energy
Efficiency of Large Scale Distributed Systems. ACM
Computing Surveys, 46(4), pp.1–35.
R, 2015. About Rserve. Available at: https://rforge.net/
Rserve/.
SAP01, 2015. SAP R/3 and SAP R/3 Enterprise:
Application Servers. Available at:
https://help.sap.com/saphelp_46c/helpdata/en/fc/eb2e8
a358411d1829f0000e829fbfe/content.htm.
SAP02, 2015. SAP R/3 and SAP R/3 Enterprise: Work
Processes. Available at: https://help.sap.com/saphelp_
46c/helpdata/en/fc/eb2e7d358411d1829f0000e829fbfe
/content.htm.
SAP03, 2015. SAP Transactions. Available at:
http://help.sap.com/saphelp_45b/helpdata/en/41/7af4c
2a79e11d1950f0000e82de14a/content.htm.
SAP04, 2015. Sales and Distribution (SD and SD-
Parallel). Available at: http://global.sap.com/
campaigns/benchmark/appbm_sd.epx.
Zarnekow, R. & Brenner, W., 2003. A product-based
information management approach. In ECIS. pp.
2251–2263.
Zarnekow, R., Brenner, W. & Pilgram, U., 2006.
Integrated information management, Springer.
CLOSER 2016 - 6th International Conference on Cloud Computing and Services Science
222
