
Evaluating the Effects of Convolutional Neural Network Committees
Fran Juri
ˇ
si
´
c, Ivan Filkovi
´
c and Zoran Kalafati
´
c
University of Zagreb, Faculty of Electrical Engineering and Computing, Unska 3, 10000 Zagreb, Croatia
Keywords:
Convolutional Neural Network, Commitee, Ensemble.
Abstract:
Many high performing deep learning models for image classification put their base models in a committee as
a final step to gain competitive edge. In this paper we focus on that aspect, analyzing how committee size
and makeup of models trained with different preprocessing methods impact final performance. Working with
two datasets, representing both rigid and non-rigid object classification in German Traffic Sign Recognition
Benchmark (GTSRB) and CIFAR-10, and two preprocessing methods in addition to original images, we report
performance improvements and compare them. Our experiments cover committees trained on just one dataset
variation as well as hybrid ones, unreliability of small committees of low error models and performance
metrics specific to the way committees are built. We point out some guidelines to predict committee behavior
and good approaches to analyze their impact and limitations.
1 INTRODUCTION
Convolutional neural networks (CNNs) have become
one of the most used approaches for various computer
vision problems, with especially notable results in im-
age classification (Krizhevsky et al., 2012; Simonyan
and Zisserman, 2014; Szegedy et al., 2015). Chal-
lenges related to object detection, classification and
segmentation frequently receive many CNN submis-
sions, and it is not uncommon for such approaches to
hold state-of-the-art results, more so for large scale
problems with vast amounts of data (Russakovsky
et al., 2014). To achieve highly competitive re-
sults, just coming up with new model architectures
is no longer enough. Today’s models push the lim-
its of hardware capacity, can take weeks to train, and
are carefully fine-tuned for that last push to achieve
state-of-the-art result. While deep models distinguish
themselves by being able to learn high level abstract
representations from data alone, they are prone to
having many minute detail parameters. Those pa-
rameters can be manually set with reasonable effort
for decent results, but must be carefully considered to
push the model to its limits.
To get more out of deep models some top scoring
results additionally use image preprocessing methods
and organize multiple trained models into committees
or ensembles (Ciresan et al., 2012; Jin et al., 2014).
The rationale is that committees smooth out decision
function, giving a boost to correct classifications by
eliminating outliers from individual trained models,
while different preprocessing methods can emphasize
distinguishing object features.
In this paper we focus on evaluating those as-
pects and how they impact baseline results. We work
with two datasets; German Traffic Sign Recognition
Benchmark - GTSRB (Stallkamp et al., 2011) and
CIFAR-10 (Krizhevsky, 2009) which present different
challenges, such as rigid and non-rigid object classes,
and use well known models for each. We evaluate
models trained on original images and two prepro-
cessing methods, combined into homogeneous and
hybrid committees. Our results show some fine de-
tails about the work of committees, and point out
good practices and possible pitfalls. To help better
understand the performance impact committees have,
we introduce a novel metrics (to the best of our knowl-
edge), specific to the ways committees are assembled,
and distinguishing missclassifications that exemplify
committee limitations.
The remainder of this paper is organized as fol-
lows. In Section 2 an overview of previous work
is given. Publicly available traffic sign classification
dataset GTSRB and general visual object classifica-
tion dataset CIFAR-10 are outlined in Subsection 3.1.
Also, used models based on CNNs are presented in
the same section. Committee experiments are de-
scribed in Section 4, together with presentation of our
performance metrics. In the end we discuss experi-
ment results and provide a conclusion (Section 5).
560
Juriši
´
c, F., Filkovi
´
c, I. and Kalafati
´
c, Z.
Evaluating the Effects of Convolutional Neural Network Committees.
DOI: 10.5220/0005719305600565
In Proceedings of the 11th Joint Conference on Computer Vision, Imaging and Computer Graphics Theory and Applications (VISIGRAPP 2016) - Volume 4: VISAPP, pages 560-565
ISBN: 978-989-758-175-5
Copyright
c
2016 by SCITEPRESS – Science and Technology Publications, Lda. All rights reserved

2 RELATED WORK
Work by (Krizhevsky et al., 2012) and (Szegedy et al.,
2015) on ImageNet dataset (Russakovsky et al., 2014)
exemplified true power of CNNs for general visual
object classification. While shallow learning is based
on extraction of hand-crafted features and involves a
lot of painstaking work and human insight into the na-
ture of data, CNNs automatically extract multi-scale
features that are most discriminative for given prob-
lems.
One of the first uses of committees involving
convolutional neural networks paired them with a
multi-layer perceptron trained on HOG/HAAR fea-
tures (Ciresan et al., 2011) for the purpose of traffic
sign classification in German Traffic Sign Recogni-
tion Benchmark (Stallkamp et al., 2011). In the same
paper there is also experimentation with several pre-
processing methods to help with sometimes low qual-
ity of source images. Their two model MLP/CNN
committee had 99.15% recognition rate compared to
98.73% of the best single CNN. In a continuation of
this work committees consisting purely of CNNs with
various preprocessing methods were used on several
datasets (Ciresan et al., 2012). In the case of the afore-
mentioned GTSRB dataset, the final model consisted
of five trained models for original images and four
preprocessing methods, resulting in a committee of
25 CNNs and 99.46% recognition rate.
Further application of neural network commit-
tees (Jin et al., 2014) on GTSRB improved recog-
nition rate to 99.65% by training five models with
three preprocessing methods and original images with
hinge loss and putting them in an ensemble of 20
CNNs, wherein the individual networks had average
recognition rates of 98.96 ± 0.20%.
On large-scale ImageNet dataset (Russakovsky
et al., 2014), most of the high scoring models em-
ploy an ensemble of trained models in a last attempt
to further reduce error rates and push state-of-the-
art results. The main source of deep learning fame,
AlexNet (Krizhevsky et al., 2012) swept the ILSVRC-
2012 challenge with its single CNN achieving 18.2%
top-5 error rate, while averaging five such models
brought the error rate down to 16.4%. Adding two
more CNNs pre-trained on Fall 2011 release of the
ImageNet dataset to the five CNN ensemble further
reduced the top-5 error to 15.3%.
The ILSVRC-2013 challenge attracted much
more deep learning submissions. Again the winning
approach of classification challenge used averaging of
several CNN models (Zeiler and Fergus, 2014). In the
final submission a single CNN model achieved top-
5 error rate of 12.15% while an average of multiple
models brought it down to 11.7%. In their paper they
also give error rates for models trained only on 2012
dataset as 16.5% (a) and 16.0% (b) for single CNNs,
and 14.8% for an 5×(a) & 1×(b) ensemble.
At ILSVRC-2014 challenge, deep learning gave
even better error rates with even deeper models.
GoogleNet (Szegedy et al., 2015) won the classifica-
tion challenge with 6.67% top-5 error using an en-
semble of seven trained single CNNs and a large num-
ber of crops per image. Image crops are defined
as random image samples from original source im-
age. Single CNN/single crop model had the base
10.07% top-5 error, while single CNN/144 crops
had 7.89% and seven CNN/single crop ensemble had
8.09% top-5 errors. On the same competition the
VGG model (Simonyan and Zisserman, 2014) which
won the localization challenge, also achieved impres-
sive classification results with 7.5% top-5 error rate
using an ensemble of seven different deep architec-
tures. They successfully brought it down to 6.8%
post-submission by averaging two models and uti-
lizing multi-crop and dense evaluation similar to the
GoogleNet submission. Their best single CNN model
had 7.5% top-5 validation error. From all these re-
sults we can see that final score optimizing methods
such as model ensembles, preprocessing methods and
dense cropping don’t give sufficient improvement to
match baseline results of newer generation methods,
but make the main difference between top scorers
where model resource efficiency is heavily traded for
small but important boost in recognition rates.
3 METHODOLOGY
3.1 Datasets and Models
3.1.1 CIFAR-10
CIFAR-10 (Krizhevsky, 2009) is a dataset consisting
of color images of resolution 32 × 32 pixels labeled
into 10 significantly distinct categories. The training
set has 50000 and the test set has 10000 images. Main
challenges this dataset presents are small resolution
images and non-rigid but visually distinct categories.
The model we use (Krizhevsky et al., 2012) has four
convolutional layers, each followed by a ReLU acti-
vation, pooling and local response normalization in
feature maps. The architecture is shown in Figure 1
and its definition is also readily available in frame-
works such as cuda-convnet2 (Krizhevsky, 2014)
and Caffe (Jia et al., 2014).
Evaluating the Effects of Convolutional Neural Network Committees
561
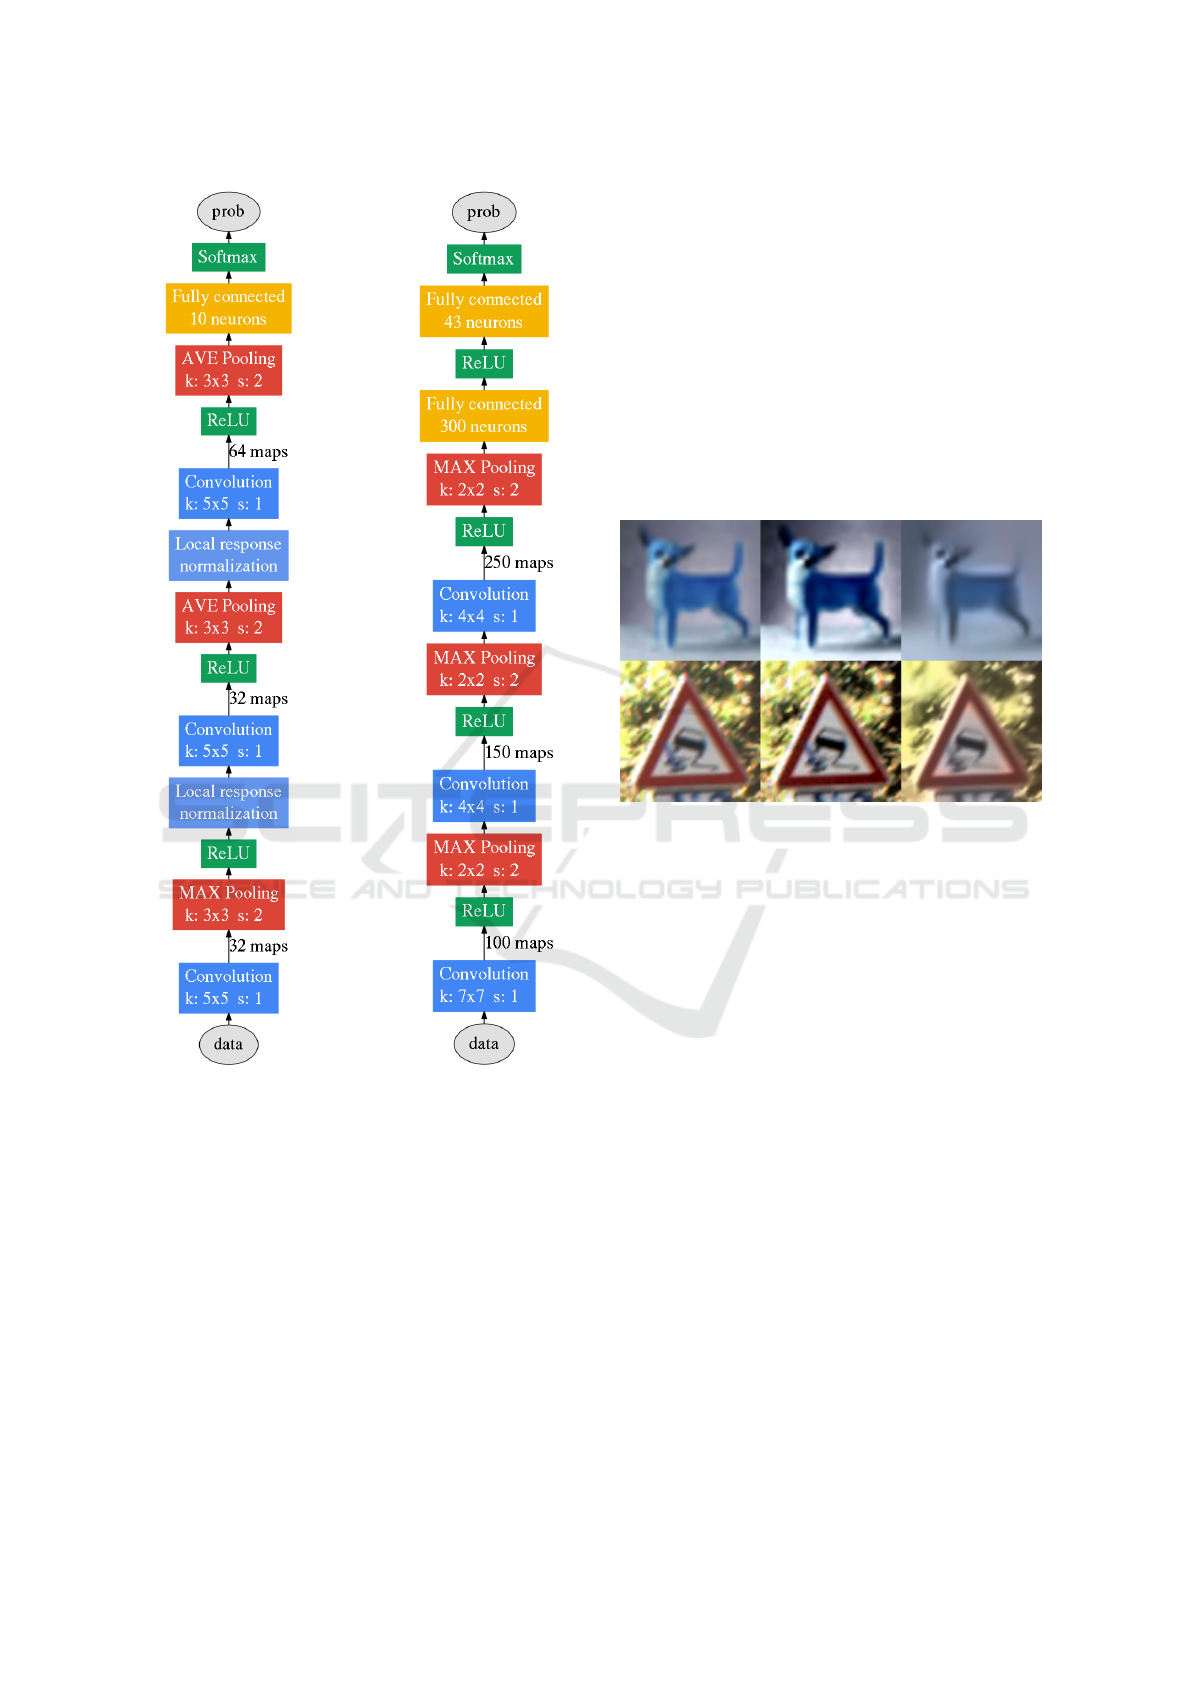
Figure 1: CifarNet (Krizhevsky et al., 2012) model archi-
tecture and our variant of the model used by (Ciresan et al.,
2012).
3.1.2 GTSRB
The German Traffic Sign Recognition Bench-
mark (Stallkamp et al., 2011) introduced a classifi-
cation dataset of German traffic signs extracted from
annotated videos. It has 43 classes and presents a
rigid object classification problem with fine-grained
classes, as many traffic signs are very similar at small
resolutions. The makeup of classes is disproportion-
ate, in accordance to their occurrence in real world.
The dataset from the final phase of competition has a
total of 1728 different physical traffic signs organized
in tracks of 30 images of increasing resolution per
physical sign, resulting in 39210 training and 12630
testing images. On this dataset we use a slightly modi-
fied model (Figure 1) from (Ciresan et al., 2012), with
added ReLU activations and dropout during training
after the first fully connected layer. Additionally,
during training we enlarge to original annotations to
53 ×53 and then take random crops of 48× 48 which
are the input dimensions of the network. GTSRB con-
tains quite a bit of images where annotated box is not
finely fitted to the traffic sign in image, so additional
translational and scale variance helps.
3.2 Preprocessing Methods
Figure 2: Examples of images from CIFAR-10 and GTSRB
in order: original, pixel intensity equalization, non-local
means denoising.
In addition to working with original images, we
also use histogram equalization of pixel intensities
and non-local means denoising to pre-process images
with examples for both datasets shown in Figure 2.
Both methods were chosen for being fairly simple and
available with most image processing libraries. Find-
ing optimal image preprocessing methods is out of
the scope of this paper, but we rather aim to evalu-
ate how the additional varied information they pro-
vide impacts the performance of a committee.
4 EXPERIMENTS
To get committee scores, we use 30 trained models
for each considered metric and simulate the ’build-
ing’ of a committee by randomly adding individual
CNNs one by one and averaging their scores. This
method is most common in deep models and we don’t
use others to avoid the different problem of commit-
tee forming. Each such run gives specific recognition
rates dependent on the ordering of individual models,
so for metrics tied to committee size alone we cal-
culate mean and standard deviation over 1000 runs.
VISAPP 2016 - International Conference on Computer Vision Theory and Applications
562

Table 1: Individual model and committee correct recognition rates (%) for GTSRB and CIFAR-10 datasets. Hybrid commit-
tees have equal numbers of constituting models.
Preprocessing 1 CNN 6 CNN 30 CNN
GTSRB final phase test set
Originals (a) 98.52 ± 0.23 98.89 ± 0.13 98.98
HistEq (b) 98.51 ± 0.18 98.80 ± 0.10 98.87
NlMeansDenoising (c) 96.39 ± 0.21 96.80 ± 0.14 96.87
(a) and (b) - 98.98 ± 0.13 99.15
(b) and (c) - 98.78 ± 0.13 98.90
(a) and (c) - 98.55 ± 0.13 98.66
(a), (b) and (c) - 98.87 ± 0.14 99.05
CIFAR-10
Originals (a) 81.16 ± 0.27 83.16 ± 0.13 83.25
HistEq (b) 77.96 ± 0.33 80.31 ± 0.16 80.75
NlMeansDenoising (c) 76.45 ± 0.30 78.37 ± 0.16 78.67
(a) and (b) - 82.72 ± 0.16 83.28
(b) and (c) - 81.41 ± 0.10 81.81
(a) and (c) - 82.11 ± 0.14 82.56
(a), (b) and (c) - 82.54 ± 0.15 82.92
Table 2: Correct classification rate (CCR) is defined by the number of examples assigned the correct label divided by number
of all examples. Base correct classification rate is based upon examples that are correctly classified by all single models, while
inconsistent ones have both correct and incorrect classifications. Base error are examples that are wrongly classified by all
CNNs. True improvement (Equation 1) is evaluated as the increase in CCR once base CCR is deducted.
Data Base CCR Inconsistent Base err. Avg. CNN 30 CNN Impro.
GTSRB original 95.86% 4.04% 0.10% 98.52% 98.98% 117.67%
GTSRB HistEq 96.27% 3.56% 0.17% 98.51% 98.87% 115.90%
GTSRB original & HistEq 95.17% 4.74% 0.09% 98.51% 99.15% 119.29%
CIFAR10 original 58.58% 36.51% 4.91% 81.16% 83.25% 109.66%
CIFAR10 HistEq 53.28% 40.38% 6.34% 77.96% 80.75% 111.30%
CIFAR10 original & HistEq 52.15% 43.46% 4.39% 80.34% 83.28% 110.43%
For committees consisting of models learned with dif-
ferent preprocessing methods, we add to the growing
committee one of each together, in order to keep the
makeup balanced.
In Table 1 we compare recognition rates for indi-
vidual models and committees of several sizes. Visu-
alization for select models are presented in Figure 3,
where we show average performance dependent on
committee size as well as sample single runs.
Committees based upon a single preprocessing
method show similar increases in performance, with
the final result more tied to performance of individual
models. Hybrid model performance is not easily an-
ticipated as it can give slight boosts or reductions, if
the combined preprocessing methods prove compati-
ble for that dataset and model.
It is important to observe that, as opposed to
smooth increases in average recognition rates as
committee size grows, in some cases adding models
to an existing committee does not consistently in-
crease recognition rate, but can in fact be noticeably
detrimental as shown in Figure 3. The effect is much
more present in GTSRB dataset than CIFAR-10.
Our reasoning is that this is due to much higher
base recognition rate in GTSRB, leaving less room
for smooth improvement and a greater chance for
individual models to make matching errors. The
opposite effect can also happen when a smaller com-
mittee performs above the convergent value which
is achieved as committee size grows. We believe
that a good indicator for this problem is the increase
in recognition rate achieved by putting models in
a committee. An improvement of ∼ 2% appears
in related work (Krizhevsky et al., 2012; Szegedy
et al., 2015) including ours for CIFAR-10, even with
a smaller number of individual models, while an
improvement of ∼ 0.5% (Ciresan et al., 2012; Jin
et al., 2014) present in our GTSRB results seems
to require a larger number of individual models to
be achieved reliably. To give a performance metric
unique to committees, we break down classifications
of individual models, as a committee is not able to
impact any labels that are consistently assigned by all
single models. We give a special metric (Equation 1)
Evaluating the Effects of Convolutional Neural Network Committees
563
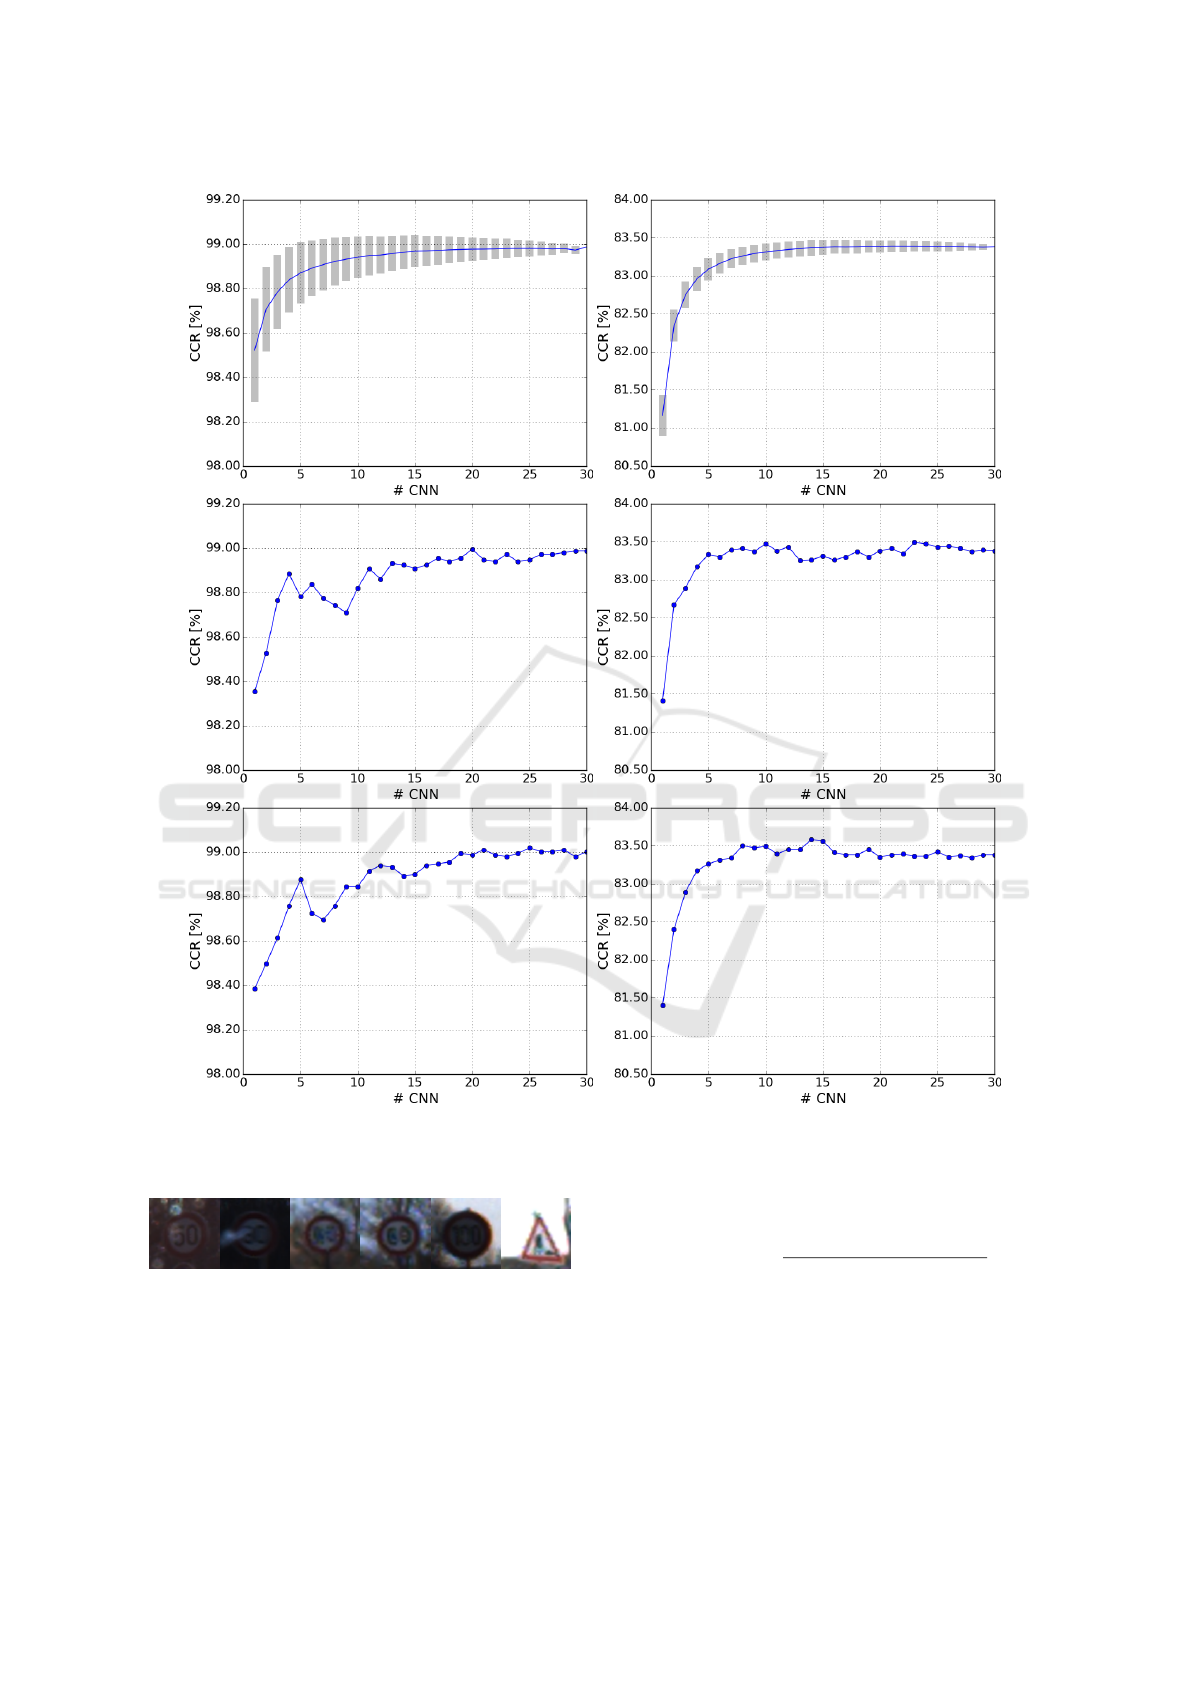
Figure 3: Committee performance dependent on the number of constituting CNNs trained on original images from GTSRB
(left) and CIFAR-10 (right). The top plots show average and standard deviation over 1000 committee constructing runs, while
center and bottom show sample single runs.
Figure 4: Images from GTSRB test set that all 30 models
trained on original images give the same wrong label.
for committee performance as correct classification
rate shared by all constituting models and the im-
provement over average single model by a committee
of 30 CNNs on inconsistently classified examples.
Average recognition rates for single models and
committees come from Table 1.
Improvement =
Committee − BaseCCR
AverageCNN − BaseCCR
(1)
Table 2 shows that on GTSRB individual models have
much more consistent classifications, which could in
large be due to traffic sings being rigid in contrast to
visually varying CIFAR-10 classes. It also shows that
on GTSRB committees prove relatively more effec-
tive compared to CIFAR-10, as they give more of an
improvement on examples that are disputable. This
VISAPP 2016 - International Conference on Computer Vision Theory and Applications
564

also brings up missclassifications consistent across
all individual models, which are interesting as they
showcase model, training method or dataset limita-
tions. We show all such examples for models trained
on original GTSRB images in Figure 4.
These experiments provide valuable insight into
how committees boost model performance scores and
help us with assumptions on what they can and cannot
do.
5 CONCLUSION
In this paper and work of others we observe some
consistencies in results achieved using committees
of base deep models. For considered problems that
are not saturated, even smaller committees improve
recognition rates by a value close to 2%. However,
when room for improvement is much smaller, com-
mittees need to be much larger or built with greater
care to be reliable, as smaller committees could have
a significant amount of wrongly classified examples
when individual models make similar errors. We
show statistics for committees of various sizes on two
datasets, trained on original or preprocessed images,
as well as hybrid committees. When using a single
preprocessing method to build committees, the in-
crease achieved is similar and the final recognition
rate depends largely on average performance of in-
dividual models. Hybrid committees prove more of
a challenge, since the right choice of preprocessing
method combinations can boost or reduce results de-
pending on whether the preprocessing methods prove
compatible for that dataset and model.
We also looked into performance metrics specific
for committees since they can only improve results on
examples that individual models do not consistently
classify. Defining base correct classification rate as
the examples all individual models classify correctly,
we calculated true improvement as the increase of
correct classifications above the base. Results of this
metric showed an ∼ 117% increase on GTSRB and
∼ 110% increase on CIFAR-10, giving a much better
insight on how much committees help rather than just
the increase in recognition rate. Overall, we brought
to light intricacies of a much used but not elaborated
approach to boost final model performance.
ACKNOWLEDGEMENT
This work has been supported by the Croatian Science
Foundation under the project UIP-11-2013-1544.
REFERENCES
Ciresan, D. C., Meier, U., Masci, J., and Schmidhuber,
J. (2011). A committee of neural networks for traf-
fic sign classification. In IJCNN, pages 1918–1921.
IEEE.
Ciresan, D. C., Meier, U., and Schmidhuber, J. (2012).
Multi-column deep neural networks for image classi-
fication. In CVPR, pages 3642–3649. IEEE.
Jia, Y., Shelhamer, E., Donahue, J., Karayev, S., Long,
J., Girshick, R. B., Guadarrama, S., and Darrell, T.
(2014). Caffe: Convolutional architecture for fast fea-
ture embedding. CoRR, abs/1408.5093.
Jin, J., Fu, K., and Zhang, C. (2014). Traffic sign recog-
nition with hinge loss trained convolutional neural
networks. Intelligent Transportation Systems, IEEE
Transactions on, PP(99):1–10.
Krizhevsky, A. (2009). Learning multiple layers of features
from tiny images.
Krizhevsky, A. (2014). One weird trick for parallelizing
convolutional neural networks. CoRR, abs/1404.5997.
Krizhevsky, A., Sutskever, I., and Hinton, G. E. (2012). Im-
agenet classification with deep convolutional neural
networks. In Advances in Neural Information Pro-
cessing Systems 25, pages 1097–1105. Curran Asso-
ciates, Inc.
Russakovsky, O., Deng, J., Su, H., Krause, J., Satheesh, S.,
Ma, S., Huang, Z., Karpathy, A., Khosla, A., Bern-
stein, M. S., Berg, A. C., and Fei-Fei, L. (2014). Ima-
genet large scale visual recognition challenge. CoRR,
abs/1409.0575.
Simonyan, K. and Zisserman, A. (2014). Very deep con-
volutional networks for large-scale image recognition.
CoRR.
Stallkamp, J., Schlipsing, M., Salmen, J., and Igel, C.
(2011). The German Traffic Sign Recognition Bench-
mark: A multi-class classification competition. In
IEEE International Joint Conference on Neural Net-
works, pages 1453–1460.
Szegedy, C., Liu, W., Jia, Y., Sermanet, P., Reed, S.,
Anguelov, D., Erhan, D., Vanhoucke, V., and Rabi-
novich, A. (2015). Going deeper with convolutions.
In The IEEE Conference on Computer Vision and Pat-
tern Recognition (CVPR).
Zeiler, M. D. and Fergus, R. (2014). Visualizing and under-
standing convolutional networks. In Computer Vision
- ECCV 2014 - 13th European Conference, Zurich,
pages 818–833.
Evaluating the Effects of Convolutional Neural Network Committees
565
