
Profiling Student Behavior in a Blended Course
Closing the Gap between Blended Teaching and Blended Learning
Nynke Bos
1
and Saskia Brand-Gruwel
2
1
University of Amsterdam, Faculty of Social and Behavioural Sciences,
P.O. Box 19268, 1000 GG Amsterdam, The Netherlands
2
Open University of the Netherlands, Faculty Psychology and Educational Sciences,
P.O. Box 2960, 6401 DL Heerlen, The Netherlands
Keywords: Blended Learning, Blended Teaching, Learning Analytics, Recorded Lectures, Formative Assessment,
Individual Differences, Cluster Analysis, Learning Dispositions.
Abstract: Blended learning is often associated with student-oriented learning in which students have varying degrees
of control over their learning process. However, the current notion of blended learning is often a teacher-
oriented approach in which the teacher identifies the used learning technologies and thereby offers students
a blended teaching course instead of a blended learning course (George-Walker & Keeffe, 2010). A more
student-oriented approach is needed within educational design of blended learning courses since previous
research shows that students show a large variation in the way they use the different digital learning
resources to support their learning. There is little insight into why students show distinct patterns in their use
of these learning resources and what the consequences of these (un)conscious differences are in relation to
student performance. The current study explores different usage patterns of learning resources by students in
a blended course. It tries to establish causes for these differences by using dispositional data and determines
the effect of different usage patterns on student performance.
1 INTRODUCTION
When discussing learning technologies, there seems
to be consensus about its positive impact on
education. Phrases as ‘new potential’, ‘rapid and
dramatic change’ and ‘fast expansion’ are frequently
used when describing new learning technologies.
This is no different for blended learning as the
abovementioned phrases are used to characterize
current developments within the blended learning
domain (Henderson et al., 2015).
The definition of blended learning is not clearly
defined and can relate to combinations of
instructional methods (e.g. discussions, (web)
lectures, simulations, serious games or small
workgroups), different pedagogical approaches (e.g.
cognitivism, connectivism), various educational
transfer methods (online and offline) or it can relate
to various technologies used (e.g. e-learning,
podcasts or short video lectures (Bliuc et al., 2007;
Porter et al., 2016).
The common distinction lies in the two different
methods used within the learning environment: face-
to-face (offline) versus online learning activities.
Blended learning is often associated with
student-oriented learning, in which students have
varying degrees of control over their own learning
process. Blended learning could contribute to the
autonomy of the students in which they have more
control over their learning path and this autonomy
should encourage students to take responsibility for
their own learning process (Lust et al., 2013). This
approach towards blended learning is in line with a
constructivist pedagogical model and is believed to
assist in a flexible learning environment where
student autonomy and reflexivity is strengthened
(Orton-Johnson, 2009). However, in most cases the
design of blended learning is mostly aimed at
putting technology into the learning environment
without taking into account how that technology
contributes to the learning outcomes (Verkroost et
al., 2008) or encourages student autonomy and
reflexivity. The current notion of blended learning is
often a teacher-oriented approach in which the
teacher determines the learning technologies without
considering how these learning technologies
Bos, N. and Brand-Gruwel, S.
Profiling Student Behavior in a Blended Course - Closing the Gap between Blended Teaching and Blended Learning.
In Proceedings of the 8th International Conference on Computer Supported Education (CSEDU 2016) - Volume 2, pages 65-72
ISBN: 978-989-758-179-3
Copyright
c
2016 by SCITEPRESS – Science and Technology Publications, Lda. All rights reserved
65

contribute to flexible learning, student autonomy and
course performance. This so called ‘blended
teaching’ approach (George-Walker and Keeffe,
2010) lacks a focus on students. To improve the
educational design of blended learning, a focus on
students is needed so students can choose the ‘right’
learning technologies to be suit their own learning
path. What the teacher determines as the ‘right’
technology does not necessary match with the
perspective of the learner and will not automatically
lead to more student-oriented learning (Oliver and
Trigwell, 2005) or encourages student autonomy and
reflexivity.
When blended learning design focuses on
students and their choices to use the ‘right’ learning
technologies, there is a large variety in the choices
students display when using the different learning
resources to support their learning. Students either
heavily rely on a single preferred supporting
technology (Inglis et al., 2011) do not use the
technology at all (Lust et al., 2011) or apply it in
such a way to substitute for the face-to-face
activities (Bos et al., 2015), thereby de facto creating
their own online course. One blended teaching
course can thereby lead to different blended learning
courses. There is little insight into why students do
or do not use certain learning technologies and what
the consequences of these (un)conscious choices are
in relation to student performance, although research
suggests that goal-orientation (Lust et al., 2013),
approaches to learning (Ellis et al., 2008) may be an
important predictor of frequency and engagement of
use.
Several studies conducted a cluster analysis
based on the use of these different learning resources
to identify different usage patterns. For example
Lust et al., (2013) found four different clusters that
reflect differences in the use of the digital learning
resources: the no-users, the intensive-active users,
selective users and intensive superficial users.
Similarly another study (Kovanović et al., 2015)
found, also based on cluster analysis, several
different user profiles based on the use of digital
learning resources and suggest that these differences
might be related to differences in students’
metacognition and motivation.
One of the advantages of blended learning is that
the learning activities take place in an online
environment, which easily generates data about
these online activities. The methods and tools that
aim to collect, analyse and report learner-related
educational data, for the purpose of informing
evidence-based educational design decisions is
referred to as learning analytics (Long and Siemens,
2011). Learning analytics measures variables such as
total time online, number of online sessions or hits
in the learning management systems (LMS) as a
reflection of student effort, student engagement and
participation (Zacharis, 2015). Learning data
analysis from students in a blended learning setting
provides the opportunity to monitor students’ use of
different learning technologies throughout the course
and might provide insight in the gap between the
education design of the course and the different
learning paths of students.
To better understand student behaviour in a
blended learning setting, learning data analysis
needs to be complemented with a set of indicators
that goes beyond clicks and durations of use. One
solution is to combine data from online learning
activities with learning dispositions, values and
attitudes, which should be measured through self-
report surveys (Shum and Crick, 2012) such as the
Motivated Strategies for Learning Questionnaire
(MSLQ) (Pintrich et al. 1991). Learners’
orientations towards learning—their learning
dispositions—influence the nature of how students
engage with new learning opportunities. Someone
who is able to self-regulate his or her own learning
process is more likely to use a deep approach
towards learning (Vermunt, 1992) Students who use
an external regulation strategy are more likely to use
a surface approach towards learning. So, adding
learning dispositions to data collected from online
learning activities could provide better
understanding of students’ regulation strategies and
their use of learning technologies, and subsequently
explain differences in student performance. Indeed,
preliminary research shows that dispositional data
adds to the predictive power of learning analytics
based on prediction models (Tempelaar et al., 2015).
To close the gap between blended teaching and
blended learning a deeper understanding of the
causes of individual differences of the use of
learning resources is needed so the educational
design process can be optimized. Dispositional data
could be used to determine if differences in students
their metacognition and motivation can explain
differences in the use of learning resources and what
the consequences of these differences are for student
performance.
This research aims to answer the following
questions:
Q1: Which differences in the use of learning
resources can we distinguish?
Q2: Can these differences be explained by
dispositional data?
Q3: Do these differences in the use of learning
CSEDU 2016 - 8th International Conference on Computer Supported Education
66

resources have an impact on student performance?
2 METHODS & MATERIALS
2.1 Participants
The participants were 516 freshmen law students
(218 male, 298 female, Mage = 22.1, SD = 4.9)
enrolled in a mandatory course on Contract Law.
Students repeating the course or taking the course as
an elective were removed from the results.
2.2 The Blended Learning Course
The course on Contract Law (CL) was an eight-
week course. The course had a regular outline for
each week.
On the first day of the week students were
offered a regular face-to-face lecture in which
theoretical concepts were addressed. These lectures
were university style lectures, with the instructor
lecturing in front of the class. The lectures were
recorded and made available directly after the
lecture had taken place and were accessible until the
exam had finished. If parts of the lectures were
unclear, students could use the recorded lectures to
revise these parts or revise the entire lecture if
needed.
The course consisted of 7 face-to-face lectures,
with a 120-minute duration and a 15-minute break in
half time. Lecture attendance was not mandatory.
During the week several small workgroups were
organized with mandatory attendance. Before these
workgroups, students had to complete several
assignments in the digital exercise book, which
contains additional study materials, supplemented
with three short essay questions. The students were
expected to have studied the digital exercise book
before entering the small workgroups. Responding
to the short essay questions was not mandatory, but
highly recommended by the instructor. In total there
were seven exercises that contained short essay
questions.
In the final segment of the week students were
offered a case-based lecture in which theoretical
concepts were explained with cases and specific
situations of Contract Law. These seven case-based
lectures were also recorded and made available
directly after the lecture had taken place and were
accessible until the exam had finished. All the
recorded lectures were made available through the
learning management system (LMS) Blackboard.
To finalize the week students could take a short
formative assessment in which the concepts of the
week were assessed. These formative assessments
contained multiple-choice questions in which
knowledge and comprehension were assessed.
Completion of these formative assessments was not
mandatory. In total there were seven formative
assessments available to students.
2.3 Measurement Instruments
The data collected from all the online activities
(recorded lectures, short essay questions, formative
assessments) was supplemented with the collection
of learning disposition data and attendance to the
face-to-face lectures: the regular lectures and the
case-based lectures.
2.3.1 Attendance to the Face-to-Face
Lectures
During the entire time frame of the lectures, student
attendance was registered on an individual level by
scanning student cards upon entry of the lecture hall.
The scanning continued until 15 minutes after the
lecture had started. The presence of the students was
registered for all fourteen lectures of the course,
seven regular lectures and seven case-based lectures.
Attendance to the regular lectures and the case-based
lectures was separately registered in the database.
2.3.2 Use of the Recorded Lectures
The viewing of the recordings was monitored on an
individual level and could be traced back to date,
time, amount and part of the lecture viewed. For
each lecture a separate recording was made, which
made it possible to track the viewing trends for that
specific recorded lecture.
2.3.3 Short Essay Questions
Since the digital exercise book was offered to
students through the LMS, answers given to the
short essay questions were also stored in the LMS.
These answers were not scored, students were
provided with model answers at the end of the week.
The LMS registered if a student had answered the
questions for that specific week.
2.3.4 Formative Assessments
For each formative assessment a log file within the
LMS was created to determine if a student
completed the formative assessment. For each
separate assessment a log file was created. The
Profiling Student Behavior in a Blended Course - Closing the Gap between Blended Teaching and Blended Learning
67

participation for the multiple choice and short essay
questions was stored separately.
2.3.5 Motivated Strategies for Learning
Questionnaire
The Motivated Strategies for Learning Questionnaire
(MSLQ) is a self-report instrument for students that
assess both student motivations and their
metacognitive ability to regulate learning (Pintrich et
al., 1991). The MSLQ contains 81 questions of
which 31 items determine a student’s motivational
orientation towards a course and 50 items to assess
metacognition. The motivational orientation can be
divided into six subscales: intrinsic goal orientation,
extrinsic goal orientation, task value, self-efficacy,
control beliefs and test anxiety. Metacognition can
be scored on nine subscales: rehearsal, elaboration,
organization, critical thinking, metacognitive self-
regulation, time and study environment, effort
regulation, peer learning and help seeking. For a
complete description of the MSLQ and each of its
subscales we refer to the manual of the MSQL
(Pintrich et al., 1991). For the purpose of this
research we used four motivation scales (intrinsic
goal orientation, extrinsic goal orientation, task
value and self-efficacy) and three metacognition
scales (critical thinking, metacognitive self-
regulation and peer learning) since these different
subscales can be, directly or indirectly, influenced
by their educational design within a blended learning
course.
The MSLQ was offered to students during the
first week of the course. In the second week a
reminder was sent out participants.
2.3.6 Final Grade
At the end of the course students took a summative
assessment, which consisted of 25 multiple-choice
questions and four short essay questions. Final
grades were scored on a scale from 1 to 10 with 10
the highest and 5.5 as a pass mark.
2.4 Data Analysis
To establish differences in the use of learning
resources a two-step cluster analysis with attendance
data, use of the recorded lectures, essay questions
and formative assessments was conducted. A two-
step cluster analysis determines the natural and
meaningful clusters that appear within an
educational blended setting. The two-step method is
preferred over other forms of cluster analysis when
both continuous and categorical variables are used
(Chiu et al., 2001) and when the amount of clusters
is not pre-determined.
Next a MANOVA between the different clusters
was conducted to determine significant differences
in student motivations and their metacognition
between those clusters (MSLQ). The MANOVA
was used to determine if dispositional data could
explain the existence of different clusters and
subsequently the differences in the use of learning
resources.
The last step in the data analysis was to conduct
an ANOVA with cluster membership as a factor and
with the final assessment as the dependent variable,
to determine if differences in the use of the learning
resources lead to significant differences in student
performance.
3 RESULTS
To determine the natural occurring patterns based on
the use of learning recourses a cluster analysis was
conducted. As can be seen in Table 1 the auto-
clustering algorithm indicated that four clusters was
the best model, because it minimized the Bayesian
Information Criterion (BIC) value and the change in
them between adjacent numbers of clusters.
Table 1: BIC changes in de auto-clustering procedure.
Number
of
Clusters
Schwarz's
Bayesian
Criterion (BIC)
BIC
Change
a
Ratio of
BIC
Changes
b
1 2217.94
2 1908.87 -309.06 1.33
3 1694.06 -214.82 1.54
4 1581.20 -112.86 2.27
5 1573.28 -7.92 1.11
6 1573.55 .28 1.04
a. The changes are from the previous number of clusters in the
table.
b. The ratios of changes are relative to the change for the two-
cluster solution.
Table 2 provides insight into the four different
clusters and their use of the learning recourses. For
each cluster the means of the use are presented as
well as the means for the entire population.
Students in cluster 1 hardly attend any of the
regular and case-based lectures; they hardly use the
short essay questions or the formative assessment
but show an average use of recordings of the
lectures. They seem to have a slight preference to
watch the recordings of the face-to-face lectures
over the case-based lectures. Students in cluster 2
CSEDU 2016 - 8th International Conference on Computer Supported Education
68
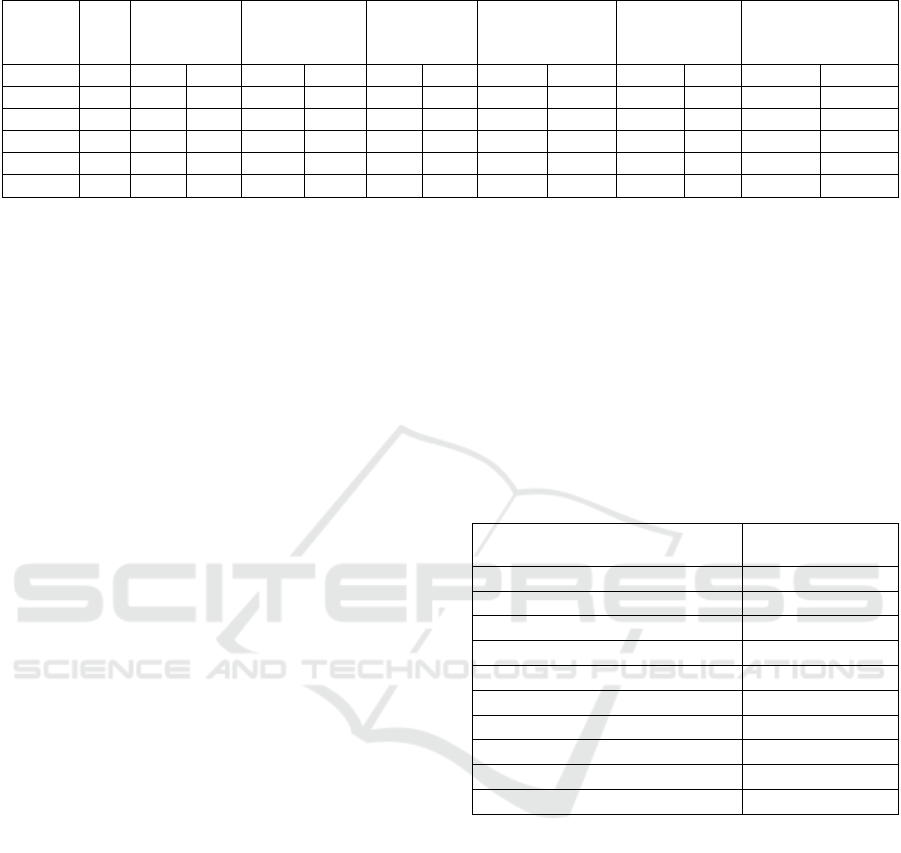
Table 2: Means of the learning data of the clusters.
Lectures Case‐based
Lectures
Short
Essay
Formative
Assessments
Recorded
Lectures
(minutes)
Recorded
Lectures:Case
Based(minutes)
Cluster N M SD M SD M SD M SD M SD M SD
1 103 .28 .63 .12 .35 .53 .99 .49 .87 612 528 384 417
2 143 1.52 1.79 .17 .43 4.58 2.00 3.23 2.03 245 234 209 215
3 186 .39 .86 .21 .57 5.80 1.36 4.83 1.91 1013 421 740 493
4 84 4.80 1.87 2.43 1.83 5.68 2.07 4.93 1.93 301 363 371 326
Total 516 1.40 2.06 .54 1.19 4.39 2.57 3.53 2.45 604 516 462 447
attend some regular lectures, but they hardly attend
any of the case-based lectures. They show an
average activity on the use of the short essay
questions and formative assessments. Students in
cluster 3 hardly attend any of either type of face-to-
face lectures, but they compensate their lack of
attendance by watching the online recordings of both
types of lectures. They show an above average
activity on the assessments with a slight preference
for essay over multiple-choice questions. Students in
cluster 4 attend a well above average amount of the
face-to-face lectures. They also show an above
average activity on the assessments, but with a slight
preference for multiple-choice questions over short
essay questions. They show a modest use of the
recorded lectures.
To determine if the occurrence of these different
clusters could be explained by dispositional data, we
determined if there were significant differences
between the scores on the subscales of the MSLQ
between the four clusters. In total 103 students filled
out the MSLQ, which is 20% of the population. First
the reliability of the subscales of the MSLQ was
calculated. These results can be found in Table 3
The reliability of the subscales intrinsic goal
orientation, extrinsic goal orientation and
metacognitive self-regulation seems to be
insufficient. Therefore these subscales were
eliminated for further analysis. The low reliability of
the subscales is party caused by the limited items
that are used to measure these subscales (n=4) and
by the lower participation rate.
To determine which subscales of the MSLQ
differ significantly between the four clusters a
MANOVA was performed. Since the four clusters
differ in size, a GT2 Hochberg was chosen to
calculate the post-hoc analysis. The results show that
only the scales of self-efficacy and peer learning
differ among the four different clusters.
Cluster 1 students have a high self-efficacy
(M=5.03, SD=1.09) while cluster 4 shows a low
self-efficacy (M=4.35, SD=.72). Cluster 4 students
also show a strong preference for peer learning
(M=3.52, SD=1.28), as do students in cluster 2
(M=3.55, SD=1.34). On the other hand cluster 3
students tend to dislike learning with peers (M=2.49,
SD=1.16). The occurrence of the four different
clusters can, to some extent, be explained by the
dispositional data. To be more specific, the learning
dispositions that show a significant difference
between the four clusters are the tendency to
(dis)like learning with peers and the sense of
competence on the subject matter.
Table 3: Reliability of the subscales of the MSLQ
(n=103).
Reliability
(Cronbach’s Alpha)
Subscale
Motivation
Intrinsic goal orientation .45
Extrinsic goal orientation .51
Task value .76
Self-efficacy .90
Learning strategies
Critical thinking .76
Metacognitive self-regulation .65
Peer learning .72
To establish if the different patterns in the use of
learning resources and subsequently cluster
membership lead to differences in student
performance, an ANOVA was performed with
cluster membership as the factor variable and the
final grade as the dependent variable. A GT2
Hochberg performed the post-hoc analysis since the
clusters differ in size. The results of the ANOVA
can be found in table 4.
Results of the ANOVA showed that students in
cluster 1 and 2 have significant lower course
performance than students in cluster 3 and 4. There
is no significant difference in course performance
between students in cluster 3 and cluster 4.
Profiling Student Behavior in a Blended Course - Closing the Gap between Blended Teaching and Blended Learning
69

Table 4: Average score on the assessment for the different
clusters.
Cluster
number
N 1 2
1 103 4.04
2 143 4.44
3 186 5.16
4 84 5.41
Note: α = 0.05
4 DISCUSSION
The current study explores the different usage
patterns by students of (digital) learning resources. It
tries to establish the causes for these differences by
using dispositional data and determines the effect of
these different usage patterns on student
performance.
Results indicate that there are four usage patterns
of the learning resources as defined by a two-step
cluster analysis. These differences in user patterns
show similarities with previous determined profiles
of technology uses in a blended learning setting: the
no-users (cluster 1), superficial users (cluster 2),
selective active users (cluster 3) and intensive active
users (cluster 4) (Lust et al., 2013; Kovanović et al.,
2015). However, our results revealed that cluster 3
students show a clear preference for online learning
activities and avoid face-to-face activities and are
hence called the selective online users.
When adding dispositional data, gathered by the
MSLQ, to the four clusters we see some emerging
patterns that could explain the causes for differences
in the use of (digital) learning resources. The no-
users in cluster 1 are characterized by a high score
on the subscale of self-efficacy, which may indicate
that they tend to overestimate their performance at
the beginning of the course and they are confident
they will do well. This overestimation presumably
leads them to decide against attending face-to-face
lectures or using the online assessment tools to
determine if they master the subject matter.
The superficial users, cluster 2, are a more
balanced group showing a moderate activity on the
use of all learning resources. Although the MSLQ
showed no significant difference in the subscales for
this group, they have the lowest score of the four
clusters on the subscale extrinsic goal orientation.
Their desire to do well in this course is less evident
compared to the other clusters. This lack of desire
reflects in their superficial use of learning resources:
they use most learning resources in a modest way,
just enough to get by but eventually they fail the
course.
The selective online users in cluster 3 tend to
dislike peer learning. Their tendency to avoid their
peers reflects in their behaviour to compensate their
lecture attendance with online recordings. They
show a slight preference for open essay questions
relative to multiple-choice questions. This usage
pattern reflects a mastery approach towards although
their lack of lecture attendance would suggest
otherwise, as indicated by Wiese and Newton
(2013). They suggest that students with a surface
learning strategy tend to use learning technologies as
a substitute for other learning activities. However,
current research shows that students with a mastery
approach do substitute face-to-face lectures with
online recordings of these lectures.
The intensive active users in cluster 4 visit the
face-to-face lectures most frequently and are
distinguished by a low level of self-efficacy. A low
level of self-efficacy suggests they are insecure
about their performance in the course. They
primarily visit the face-to-face to find reassurance
via the lecturers or their peers. This need for
reassurance is reflected in their use of formative
digital quizzes, in which they prefer to use the
multiple-choice questions above the short essay
questions. They have a need to assess and reflect on
their progress and performance.
In the current research dispositional data play
only a minor role in explaining the differences
between usages of the different learning resources.
This is in contrast with Tempelaar et al. (2015) who
found that learning disposition data serves as a good
proxy at the start of the course for predictive
modelling. The students in the research of
Tempelaar et al., (2015) are more diverse, often with
an international background.
Differences in the use of learning recourses do
have an impact on student performance. Learning
analytics is often used to predict student
performance and to model learning behaviour
(Verbert et al., 2012) but more important is its
purpose to detect undesirable learner behaviour
during a course and adapt the blended course design
so the probability that these behaviours occur is
reduced and redirected. For example, students in
cluster 1 tend to overestimates their skills, resulting
in an underuse of the learning resources. This cluster
would benefit from an educational design that allows
students to gain insight into their own
overestimation.
One of the claimed advantages of blended
learning is that students gain control over their own
learning path and take responsibility for their own
CSEDU 2016 - 8th International Conference on Computer Supported Education
70

learning (Lust et al., 2013; Orton-Johnson, 2009).
This research shows that students display variety in
the use of learning resources and are designing their
own learning paths or creating their own blends.
However, while these different learning paths do
reflect control of the student, these self-composed
learning paths do not necessary lead to better course
performance. The teacher centred approach, in
which the ‘right’ technology and learning path for
the student have been chosen supplement the course
(Oliver and Trigwell, 2005), is not well embedded in
the current educational design of blended learning,
which implies that using a specific learning
technology is the learner’s decision (Lust et al.,
2011). A more student-centred approach contains an
embedded design of these learning technologies in
which the design either addresses or avoids these
individual differences and consequently redirects
unwanted behaviours. Students need certain
guidance in how to combine learning resources into
an effective learning strategy (Inglis et al., 2011)
since many students don’t seem to master the
metacognitive skills required to control their
learning (Lust et al., 2011) and subsequently do not
choose the learning resources that are the most
effective for them.
The use of data from online learning—learning
analytics—supplemented with dispositional data
gives valuable information about how and why
students use certain learning resources in a blended
course. The use of dispositional data confirms
recommendations made by Shum and Crick (2012)
wherein they conclude that learning analytics
research should be contextualized with a broader set
of indicators.
4.1 Limitations of Current Research
This research uses contextualized data for learner
data analysis in a blended learning setting. However,
even when this context is added, it still reduces the
use of learning resources to visits, clicks and scores
on questionnaires. Research on blended learning
using learning analytics should focus on learning
and ask questions like “What did people learn from
attending this lecture?” rather than, “Did people
attend this lecture?”
Another limitation of the current research is the
known calibration and inaccuracy problems with
self-reports about study tactics (Winne and
Jamieson-Noel, 2002). Students often consider
themselves as self-regulated learners while the
tactics they use to regulate their learning are
ineffective. Moreover, even within a single course
these self-reports about regulation of learning differ
as a function of the task before them (Winne, 2006).
5 CONCLUSIONS
This study showed that there are distinct patterns
between students, which reflects the differences in
use of learning resources in a blended learning
setting. These distinct patterns cause a gap between
blended teaching and learning, with different
patterns leading to differences in student
performance. These distinct patterns can be partially
explained by learning dispositions: student
motivations and their metacognitive ability to
regulate learning. Especially the subscales self-
efficacy and peer learning show significant
differences between different groups of students.
Students with a low self-efficacy have a tendency to
engage in all the learning resources and choose face-
to-face lectures over recorded lectures. Students with
high self-efficacy are confident they will do well in
the course, which causes them to hardly use the
learning resources. Students with a low sense of peer
learning tend to choose lecture recordings over face-
to-face lectures. They use these as a substitute for
lecture attendance.
Although the majority of the subscales of the
MSLQ do not show a significant difference between
the four groups of students, they provide us with
new insights in the gap between blended teaching
and blended learning. The suggestion of Shum and
Crick (2012) to combine learner data with learner
dispositions seems to lead to new insights into why
students do or do not use certain learning
technologies and what the consequences of these
(un)conscious choices are in relation to student
performance.
This research shows that when designing a
blended learning course, the individual differences
in the use of learning resources needs to considered,
but moreover it supports the finding that students
needs specific guidance in the determine what is the
‘right’ (digital) learning resource(s) that supports
their learning.
REFERENCES
Bliuc, A., Goodyear, P. and Ellis, R. (2007). Research
focus and methodological choices in studies into
students' experiences of blended learning in higher
education. The Internet and Higher Education, 10(4),
pp.231-244.
Profiling Student Behavior in a Blended Course - Closing the Gap between Blended Teaching and Blended Learning
71

Bos, N., Groeneveld, C., van Bruggen, J. and Brand-
Gruwel, S. (2015). The use of recorded lectures in
education and the impact on lecture attendance and
exam performance. Br J Educ Technol, p.n/a-n/a.
Chiu, T., Fang, D., Chen, J., Wang, Y. and Jeris, C.
(2001). A robust and scalable clustering algorithm for
mixed type attributes in large database environment.
Proceedings of the seventh ACM SIGKDD
international conference on Knowledge discovery and
data mining - KDD '01.
Ellis, R., Goodyear, P., Calvo, R. and Prosser, M. (2008).
Engineering students' conceptions of and approaches
to learning through discussions in face-to-face and
online contexts. Learning and Instruction, 18(3),
pp.267-282.
George-Walker, L. and Keeffe, M. (2010). Self-
determined blended learning: a case study of blended
learning design. Higher Education Research &
Development, 29(1), pp. 1-13.
Henderson, M., Selwyn, N. and Aston, R. (2015). What
works and why? Student perceptions of ‘useful’ digital
technology in university teaching and learning. Studies
in Higher Education, pp.1-13.
Inglis, M., Palipana, A., Trenholm, S. and Ward, J. (2011).
Individual differences in students' use of optional
learning resources. Journal of Computer Assisted
Learning, 27(6), pp.490-502.
Kovanović, V., Gašević, D., Joksimović, S., Hatala, M.
and Adesope, O. (2015). Analytics of communities of
inquiry: Effects of learning technology use on
cognitive presence in asynchronous online
discussions. The Internet and Higher Education, 27,
pp.74-89.
Long, P. and Siemens, G. (2011). Penetrating the Fog:
Analytics in Learning and Education. Educause
Review, (46).
Lust, G., Elen, J. and Clarebout, G. (2013). Students’ tool-
use within a web enhanced course: Explanatory
mechanisms of students’ tool-use pattern. Computers
in Human Behavior, 29(5), pp.2013-2021.
Lust, G., Vandewaetere, M., Ceulemans, E., Elen, J. and
Clarebout, G. (2011). Tool-use in a blended
undergraduate course: In Search of user profiles.
Computers & Education, 57(3), pp.2135-2144.
Oliver, M. and Trigwell, K. (2005). Can 'Blended
Learning' Be Redeemed?. elea, 2(1), p.17.
Orton-Johnson, K. (2009). ‘I've stuck to the path I'm
afraid’: exploring student non-use of blended learning.
British Journal of Educational Technology, 40(5),
pp.837-847.
Pintrich, P., Smith, D., Garcia, T. and Mckeachie, W.
(1993). Reliability and Predictive Validity of the
Motivated Strategies for Learning Questionnaire
(Mslq). Educational and Psychological Measurement,
53(3), pp.801-813.
Porter, W., Graham, C., Bodily, R. and Sandberg, D.
(2016). A qualitative analysis of institutional drivers
and barriers to blended learning adoption in higher
education. The Internet and Higher Education, 28,
pp.17-27.
Porter, W., Graham, C., Bodily, R. and Sandberg, D.
(2016). A qualitative analysis of institutional drivers
and barriers to blended learning adoption in higher
education.
The Internet and Higher Education, 28,
pp.17-27.
Shum, S. and Crick, R. (2012). Learning dispositions and
transferable competencies. Proceedings of the 2nd
International Conference on Learning Analytics and
Knowledge - LAK '12.
Tempelaar, D., Rienties, B. and Giesbers, B. (2015). In
search for the most informative data for feedback
generation: Learning analytics in a data-rich context.
Computers in Human Behavior, 47, pp.157-167.
Verkroost, M. J., Meijerink, L., Lintsen, H., and Veen, W.
(2008). Finding a balance in dimensions of blended
learning. International Journal on ELearning, 7, 499-
522.
Verbert, K., Drachsler, H., Manouselis, N., Wolpers, M.,
Vuorikari, R. and Duval, E. (2011). Dataset-driven
research for improving recommender systems for
learning. Proceedings of the 1st International
Conference on Learning Analytics and Knowledge -
LAK '11.
Vermunt, J. D. H. M. (1992) Leerstijlen en sturen van
leerprocessen in het hoger onderwijs: naar
procesgerichte instructie in zelfstanding denken
[Learning styles and regulation of learning in higher
education: towards process-oriented instruction in
autonomous thinking] (Amsterdam, Lisse: Swets &
Zeitlinger).
Wiese, C. and Newton, G. (2013). Use of Lecture Capture
in Undergraduate Biological Science Education. cjsotl,
pp.1-24.
Winne, P. (2006). How Software Technologies Can
Improve Research on Learning and Bolster School
Reform. Educational Psychologist, 41(1), pp.5-17.
Winne, P. and Jamieson-Noel, D. (2002). Exploring
students’ calibration of self reports about study tactics
and achievement. Contemporary Educational
Psychology, 27(4), pp.551-572.
Zacharis, N. (2015). A multivariate approach to predicting
student outcomes in web-enabled blended learning
courses. The Internet and Higher Education, 27,
pp.44-53.
CSEDU 2016 - 8th International Conference on Computer Supported Education
72
