
Geoinformation System for Analytical Control and Forecast of the
Earth’s Magnetosphere Parameters
Andrei V. Vorobev and Gulnara R. Shakirova
Ufa State Aviation Technical University, Marx str., 12, Ufa, Russian Federation
Keywords: Geoinformation System, Web Service, Geomagnetic Field, Space Weather, Spatial Data.
Abstract: Geomagnetic field and its variation can influence on systems and objects of various origins. The estimation
of the influence requires an effective approach to analyze the principles of distribution of geomagnetic field
parameters on the Earth’s surface, its subsoil and in circumterrestrial space. The main thing here is how to
register and monitor parameters of geomagnetic field both globally and for the given geodetic coordinates.
All data measured and collected about geomagnetic field is distributed in various sources and storages. It is
obvious that necessity in integrated information space is very acute. Development of such integrated
information space will provide a possibility to get any data about geomagnetic field at any point of the
Earth’s surface at any moment of time. The obvious way to solve the problem is to implement innovative
information technologies there. In particular the most expectations are about using geoinformation systems
to solve the problem. In this paper the authors suggest an approach to study, monitoring, analyze and
visualize space weather and geomagnetic field parameters, which is based on modern Web and
geoinformation technologies. This solution is the project GEOMAGNET with four web services and mobile
applications included.
1 INTRODUCTION
“Data is next Intel Inside” is one of the key
principles of modern information technologies. One
of the best examples of this is a special class of
information systems, which is widely known as GIS.
GIS stands for geographical information system and
is aimed to store, query, manipulate and display
geospatial data which is referred to information
explaining where something is and what is at a given
location. In other words GIS can process any data
which contains location (geodetic latitude and
longitude, address, etc.). With GIS this data can be
overlaid on top of one another on a single map. GIS
may be used for any number of different purposes
and may combine countless sources of data that can
be manipulated and updated at any time.
In the modern World, specialists in many spheres
pay great attention to correlations between external
geomagnetic variations (GMV) and possibilities of
existence and evolution of objects and systems. This
interest is based on idea that some components of
GMV or their combinations can influence on
biological, technical, geological and other objects
and systems in common and on human in particular.
As a result, the distorted normal conditions of
existence force these objects and systems to either
adapt to the changes of magnetic state (via
deformation, mutation, etc.) or keep existing there in
stressed (unstable) mode (Chizhevskii, 1976)
(Vernadsky, 2004).
The problem of monitoring of geomagnetic field
(GMF) and its variations parameters is partially
solved by a number of magnetic observatories –
scientific organizations for parametric and
astronomical observations of the Earth’s
magnetosphere (Vorobev and Shakirova, 2015). The
registered information is regularly sent to the
International centers in Russia, USA, Denmark and
Japan, where the information is registered, analyzed
and partially available to the broader audience with
some delay. All data measured and collected about
geomagnetic field is distributed in various sources
and storages. It is obvious that necessity in
integrated information space is very acute.
Development of such integrated information space
will provide a possibility to get any data about
geomagnetic field at any point of the Earth’s surface
at any moment of time. And the initial step here is
concerned with specialized applications which
Vorobev, A. and Shakirova, G.
Geoinformation System for Analytical Control and Forecast of the Earth’s Magnetosphere Parameters.
In Proceedings of the 2nd International Conference on Geographical Information Systems Theory, Applications and Management (GISTAM 2016), pages 193-200
ISBN: 978-989-758-188-5
Copyright
c
2016 by SCITEPRESS – Science and Technology Publications, Lda. All rights reserved
193

provide calculation of parameters of normal
(undisturbed) geomagnetic field in real-time mode
for any point on the Earth’s surface.
The obvious way to solve the problem is to
implement innovative information technologies
there. In particular the most expectations are about
using geoinformation systems to solve the problem.
In this paper the authors suggest an approach to
study, monitoring, analyze and visualize
geomagnetic field, its variations and anomalies,
which is based on modern Web and geoinformation
technologies.
2 GEOMAGNETIC FIELD AND
ITS VARIATIONS
The first question to be discussed is what
geomagnetic field is and why is it important to study
this subject? According to the modern science, the
Earth’s outer core is liquid and mainly iron. Its
chemical elements (such as iron and nickel)
respectively make ~85.5 % and ~5.2 % of Earth’s
core mass fraction, i.e. totally more than 90 %.
Permanent rotations of the Earth and its core cause
the constant flows inside of the core and
corresponding electric currents. According to the
laws of magnetic hydrodynamics, these flows and
currents provide the existence of geomagnetic field
(Campbell, 2003).
Geomagnetic field is a complex structured
natural matter with ambiguous field characteristics,
which is distributed in the Earth (and near-Earth)
space and interacts with both astronomical objects
and terrestrial objects / processes on the Earth’s
surface, subsoil and in near-Earth space (Mandea,
2011)(Merrill, 1996).
Because of the permanent interaction with the
magnetic fields, which are generated by the Sun, the
planets of the Solar system and other celestial bodies
and systems, the Earth’s magnetic field can be
significantly deformed. Herewith geomagnetic field
becomes some kind of protective shield, which
prevents a penetration of the Solar wind to the
geospace (the Solar wind is a flow of ionized
particles, which radially spreads from the solar
corona to the outer space). The Solar wind interacts
with this barrier, flows around the Earth and creates
a special region with the geomagnetic field inside,
which is known as the Earth’s magnetosphere with
its typical teardrop shape.
Geomagnetic variations are declinations of
observed amplitude parameters of the Earth’s
magnetosphere from the calculated values, which are
defined as a normal (or undisturbed) state of
geomagnetosphere. The events and processes, which
cause geomagnetic variations, have various and
independent origin. Besides, all local and global
deformations of geomagnetosphere significantly
differ by both their amplitude-frequency and
probabilistic estimations and characteristics. As a
result the actual picture of geomagnetic field is a
complicated superposition of probabilistic set of
geomagnetic variations, which are caused by the
number of uncoordinated events. That’s why their
estimation by traditional physical quantities
(magnetic field intensity, frequency, magnetic
induction, etc.) is useful.
Today the specialists in many scientific and
applied spheres (such as biology, medicine,
geophysics, geology, technics, sociology,
psychology and many others) consider parameters of
geomagnetic field and its variations as one of the
key factors, which can influence on systems and
objects of various origins. They pay great attention
to correlations between external geomagnetic
variations and existence and evolution of various
objects and systems.
This interest is based on idea that some
components of geomagnetic variations or their
combinations can influence on biological, technical,
geological and other objects and systems in common
and on human in particular. As a result, distorted
normal conditions of existence force these objects
and systems to either adapt to changes of magnetic
state (via deformation, mutation, etc.) or keep
existing there in stressed (or unstable) mode
(Vorobev and Shakirova, 2015).
The full vector of the Earth’s magnetic field
intensity in any geographical point with
spatiotemporal coordinates is defined as follows:
B
ge
= B
1
+ B
2
+ B
3
,
where B
1
is an intensity vector of GMF of
intraterrestrial sources; B
2
is a regular component of
intensity vector of geomagnetic field of
magnetosphere currents, which is calculated in solar-
magnetosphere coordinate system; B
3
is a
geomagnetic field intensity vector component with
technogenic origin.
The normal (or undisturbed) geomagnetic field is
supposed as a value of B
1
vector with excluding a
component, which is caused by magnetic properties
of rocks (including magnetic anomalies). So, this
component can be excluded as a geomagnetic
variation:
GISTAM 2016 - 2nd International Conference on Geographical Information Systems Theory, Applications and Management
194
B
0
= B
1
– ΔB '
1
,
where B
0
is an undisturbed GMF intensity in the
point with the spatiotemporal coordinates; ΔB'
1
is a
component of GMF of intraterrestrial sources, which
represents magnetic properties of the rocks.
Solving the problem of analytical estimation of
B
0
parameters, it is helpful to represent the model of
main field by spherical harmonic series, which
depend on geographical coordinates.
The scalar potential of induction of
intraterrestrial sources geomagnetic field U [nT·km]
in the point with spherical coordinates r, θ, λ is
defined by the expression (1).
),cos(
)sin(
)cos(
1
10
m
n
n
N
n
E
n
m
m
n
m
n
E
P
r
R
mh
mg
RU
(1)
where r is a distance from the Earth’s center to the
observation point (geocentric distance), [km]; λ is a
longitude from Greenwich meridian, [degrees]; θ is a
polar angle (collatitude, θ = (π/2)-φ’, [degrees],
where φ’ is a latitude in spherical coordinates,
[degrees]); R
E
is an average radius of the Earth, R
E
=
6371.03, [km]; g
n
m
(t), h
n
m
(t) are spherical harmonic
coefficients, [nT], which depend on time; P
n
m
are
Schmidt normalized associated Legendre functions
of degree n and order m.
In geophysical literature the expression (1) is
widely known as a Gaussian and generally
recognized as an international standard for
undisturbed state of geomagnetic field.
The amount of performed spherical harmonic
analysis is significant. However a problem of
spherical harmonic optimal length is still acute.
Thus, the analyses with great amount of elements
prove Gauss hypothesis about convergence of
spherical harmonic, which represents a geomagnetic
potential. As usual in spherical harmonic analyses
the harmonics are limited by 8–10 elements. But for
sufficiently homogeneous and highly accurate data
the harmonics series can be extended up to 12 and
13 harmonics. Coefficients of harmonics with higher
orders by their values are compared with or less than
error of coefficients definition.
Due to temporal variations of the main field the
coefficients of harmonic series (spherical harmonic
coefficients) are periodically (once in 5 years)
recalculated with the new experimental data. The
changes of the main field for one year (or secular
variation) are also represented by spherical
harmonics series, which are available
at http://www.ngdc.noaa.gov/
IAGA/vmod/igrf11coeffs.txt.
Schmidt normalized associated Legendre
functions P
n
m
from expression (1) in general can be
defined as an orthogonal polynomial, which is
represented as follows (2).
...],cos
)32)(12(42
)3)(2)(1)((
cos
)12(2
)1)((
[cossin
)!()!(
...531))(cos(
4
2
mn
mnmnm
m
m
n
nn
mnmnmnmn
n
mnmn
mnmn
P
(2)
where ε
m
is a normalization factor (ε
m
= 2 for m ≥ 1
and ε
m
= 1 for m = 0); n is a degree of spherical
harmonics; m is an order of spherical harmonics.
3 GIS TO ANALYZE AND
VISUALIZE GEOMAGNETIC
FIELD
The most common problem to be solved is to
calculate parameters of normal geomagnetic field in
the point with given geographical coordinates. Its
solution is based on applications of special type
which are known as geomagnetic calculators. Here
is a list of the most popular services:
NGDC NOAA (http://www.ngdc.noaa.gov/
geomag-web/)
INTERMAGNET (http://www.intermagnet.
org/data-donnee/data-eng.php)
British Geological Survey (http://
www.intermagnet.org/data-donnee/data-eng.php)
U.S. Geological Survey (http://
geomag.usgs.gov/)
etc.
All of them provide the simplest functionality. When
a user enters a location to be calculated, the
application estimates parameters of geomagnetic
field in the point. The common problem here is
concerned with defining a location to be studied. All
applications provide simple input fields for geodetic
coordinates of the point. A user has to know exact
parameters of the place that is impossible
sometimes. So, it is a limitation of the application,
and some users are aware of using it due to this
reason.
Another problem is reliability of calculation
results. It is well-known that parameters of
geomagnetic field depend on three values: latitude,
longitude and altitude of the point. All applications
suppose altitude as 0 km by default, so results of
Geoinformation System for Analytical Control and Forecast of the Earth’s Magnetosphere Parameters
195

calculation are correct just for this elevation. A user
can enter the altitude value into input field, but these
data is also specific. Nobody knows the elevation of
his position (except the professionals). So, this value
is always referred to as 0.
To improve geomagnetic calculators the authors
suggest the following points to be added:
maps, e.g. geographical information
technologies. Geomagnetic field is estimated by
geodetical coordinates of a given point on Earth.
This class of data is referred to as geospatial and
is traditionally processed by geoinformation
systems and technologies. With a map in
application a user can simply pick up the point
by mouse clicking.
altitude calculation. To increase the accuracy of
calculation it is necessary to provide an actual
value of an altitude of the given point. The best
solution is to get the value automatically on the
basis of geodetic latitude and longitude of a
point. However this feature does not exclude a
possibility of correcting data just to see how
magnetic field changes with elevation.
visualization. The most popular approach to
visualize parameters of geomagnetic field is a set
of contours. Each contour is a curve along which
the parameter of geomagnetic field has a
constant value. A user chooses a parameter to be
visualized and the system renders on the map a
set of contours, which represent a distribution of
magnetic field on the Earth’s surface.
three-dimensional representation. It is obvious,
that in this case geoinformation system provides
much more information than any other system or
technology. And it is even more important due to
the dynamic properties and multilevel scale
ability.
To provide the defined requirements the authors
suggested and developed specialized Web-based
information system for calculation of parameters of
geomagnetic field "S-Service" (Geomagnetic
Calculator (WMM2015)) – one of the four services
provided by GEOMAGNET.
4 WEB-PORTAL "GEOMAGNET"
In 2014 GIMS Research Laboratory (Russian
Federation) with support of Russian Foundation of
Basic Research introduced an innovative
geographical web-portal “Geomagnet”
(http://www.geomagnet.ru/index-en.html) with four
services providing observation, analysis, three-
dimensional visualization and calculation of
parameters of geomagnetic field.
One of them is the application (service) for
calculation of parameters of normal geomagnetic
field – S-Service (http://www.geomagnet.ru/S/index-
en.html) (Vorobev and Shakirova, 2015).
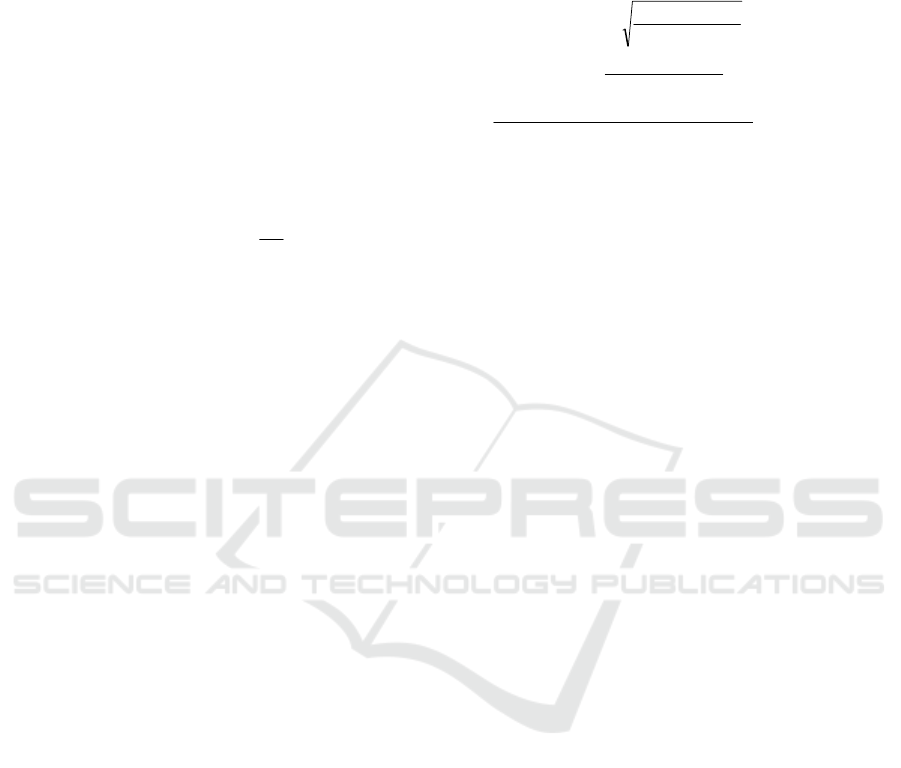
S-Service (Geomagnetic Calculator
(WMM2015)) is a Web-based application providing
calculation parameters of geomagnetic field and
secular variations according to the set of coordinates
and dates (Fig. 1). A user of any level can calculate
and analyze parameters of geomagnetic field at his
current location or at any other point on the Earth.
S-Service is a responsive application which does
not depend on device type and parameters and looks
and works similarly at any devices – from phones to
tablets to desktops. This platform- and device-
independency is realized on the basis of special
framework “Bootstrap” (http://getbootstrap.com/)
that is a set of programming libraries for HTML,
CSS and JavaScript (JQuery). Flexibility and
performance of the application are also increased by
supporting HTML5 and CSS3 standards.
Interface of the application consists of two
functional parts. First (and the biggest) panel was
developed for map rendering. All manipulations
with geospatial data are visualized in this area
(markers, zoom, geolocation, contours, etc.).
Another panel is used to display information about
both initial (spatiotemporal coordinates) and
calculated (characteristics of geomagnetic field)
parameters. Information panel also provides a
possibility to see coordinates of the mouse pointer
during its moving on map.
Functions providing map rendering and
functionality are based on two APIs: ESRI ArcGIS
for JavaScript and Google Maps API. Depending on
the demand and available functionality scripts in the
application operate with either one or both of them.
For example, to initialize the map the following
ArcGIS API functions are used:
require(["esri/map",
"dojo/domReady!"], function(Map) {
map = new Map("map", {
basemap: "streets",
center: [54.7249, 55.9425],
zoom: 5,
minZoom: 3,
sliderPosition: "top-right"
});
});
GISTAM 2016 - 2nd International Conference on Geographical Information Systems Theory, Applications and Management
196
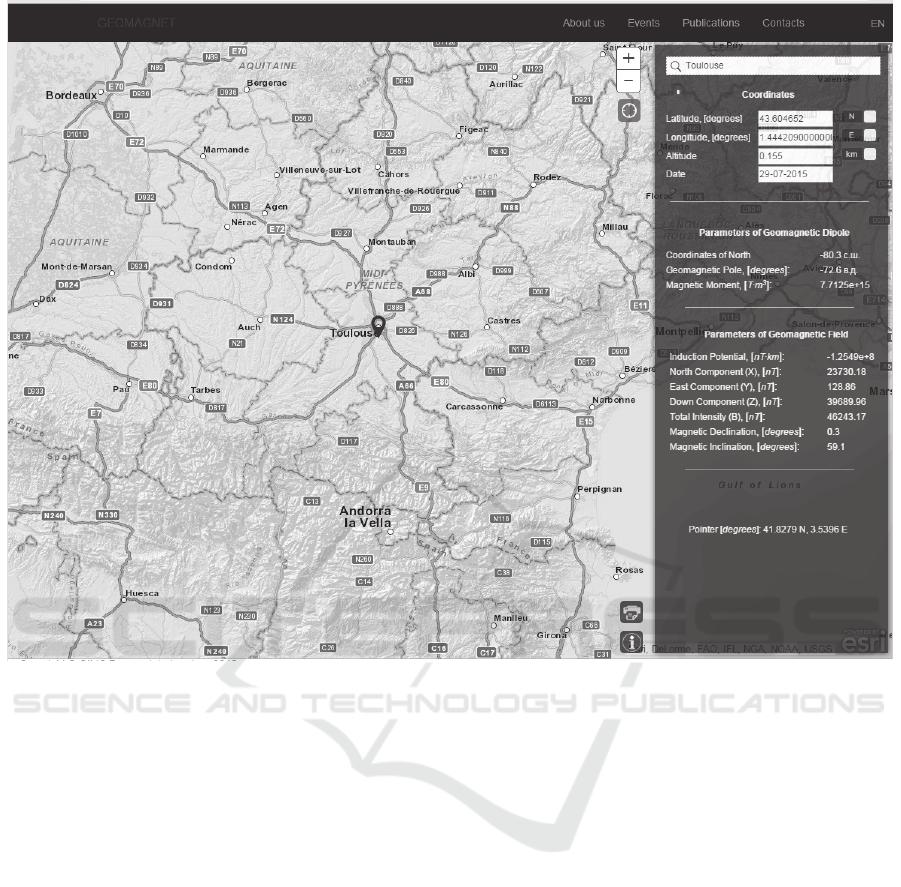
Figure 1: S-Service / Geomagnetic Calculator (WMM2015) (http://geomagnet.ru/WMM/index.html).
The code fragment creates a map instance which
is centered at default coordinates (54.7249, 55.9425)
and located in “div” HTML-element with id equal to
“map”. Due to demands of interface conception the
“sliderPosition” option is also set. This option sets a
position of zoom slider on the map and it is
necessary to declare it in map initialization code,
because CSS settings of map elements can be just
partially changed from ESRI CSS (http://
js.arcgis.com/3.12/dijit/themes/claro/claro.css).
To calculate parameters of geomagnetic field a
user has to define spatiotemporal coordinates of the
point on the Earth’s surface. In S-Service geodetic
latitude and longitude can be defined by various
ways.
The simplest way to define the current
geographical position of the user is a geolocation
function (Haklay, 2007). This function takes IP
address of device, which a user operates to access
the Internet. This possibility allows the user to get
the point without its searching on the map or filling
the appropriate input fields.
Another way to define a point is to pick it up on
the map. A user can move through the map (using
keyboard or mouse) and click at the point. All
necessary spatiotemporal parameters of the point are
calculated automatically and immediately displayed
on screen
Both mentioned ways of point definition do not
require exact coordinates of location. All necessary
geospatial data can be obtained automatically. More
complicated way is concerned with entering
coordinates into input fields. It is a good way to
calculate parameters of geomagnetic field and see
the point on map with high accuracy (up to a few
meters). After that the application displays the point
on the map and the parameters of normal
geomagnetic field there.
Also S-Service provides a geocoding
functionality to define a point to be calculated.
Geocoding is a transformation from address full
form “postal code, country, city, street, building
number” or short form (just one item or their
combination) into the coordinates set “north latitude,
east longitude”. To find the point a user enters
address of the place he is interested in.
Geoinformation System for Analytical Control and Forecast of the Earth’s Magnetosphere Parameters
197

Parameters of geomagnetic field in the
geographical point depend on its elevation. With
defined geographic coordinates S-Service gets
elevation value automatically. However ArcGIS API
does not provide any obvious methods to get this
value. That is why there is another cartographical
technology in S-Service code – Google Maps API.
In the API the application uses a special service
"ElevationService" which provides elevation data
for all locations on the Earth surface. It is an object
with an asynchronous interaction: after sending a
request to the server a user (or a web page) does not
wait for its response and keeps performing all
existing operations (or start new ones) in
background mode.
Parameters of geomagnetic field are calculated
according to mathematical model that is represented
in previous chapters. Its program realization in PHP
is a set of functions to calculate such parameters as:
north component of geomagnetic field induction
vector;
vertical component of geomagnetic field
induction vector;
magnetic declination and dip;
scalar potential of geomagnetic field induction
vector.
PHP script of calculation of parameters of
geomagnetic field generates result set in XML
format. In S-Service XML is preferred format due to
large amount of parameters and the necessity of their
processing and decomposition on client side. There
are also some other known approaches to get a set of
different values, but this way seem to be the most
effective for the authors.
It is important to mention that this realization is
based on the authors-suggested algorithm of
calculation of parameters of geomagnetic field. The
algorithm supposes special scheme to minimize the
possible error because of the rounding. The error of
the calculation is less than 2 %.
Geomagnetic variations are mainly caused by
events of the solar activity (space weather). Its
parameters are measured in 24-7-mode by satellites
and ground observatories. However the problem is
still the same: a lot of heterogeneous data, which is
hard to find and use. Real-time mode monitoring of
the space weather is provided by another service in
web-portal “Geomagnet”. This application is M-
Service ("Space Monitoring of GMF Parameters").
M-Service is a powerful tool for monitoring,
analysis and three-dimensional representation of the
geomagnetic field parameters (Fig. 2). Data is
obtained from satellite observations in real time
mode. A user can choose single or group of
parameters and visualize them on globe with both
histograms and isolines, generated according to data
in KML format.
The service is based on technology of a software
interface for accessing graphics hardware from
within a web browser without installing additional
plug-ins. In particular realization of M-Service is
based on Cesium API – a set of modern technologies
of globe rendering in Web via HTML5, the most
important of which is WebGL.
An instance of the globe is created with
“Viewer” a base Cesium widget for building
applications:
var viewer =
new Cesium.Viewer('cesiumContainer',
{ homeButton:false,
navigationHelpButton:false,
baseLayerPicker:false});
An interface to datasources, which turn arbitrary
KML-data into an “EntityCollection” for generic
consumption is performed with special method-
constructor “KmlDataSource”:
var dataSource =
new Cesium.KmlDataSource();
The innovation solution of web-portal “Geomagnet”
is a web application "G-Service", which provides
registration and visualization of partial observations
of the geomagnetic field with a high density
distribution over the surface of the Earth (Fig. 3).
The data comes on the portal from mobile devices
with the developed in the laboratory GIMS
application G-module (https://play.google.
com/store/apps/details?id=com.hiktronic. Gims4rc).
The application detects and transmits to the server
measurement data from the magnetic sensors, which
are inbuilt in the vast majority of today's mobile
devices.
Along with control, visualization and processing
of the parameters of geomagnetic field and its
variations web-portal "Geomagnet" is a powerful
tool for monitoring and analyzing the space weather.
Space weather parameters are measured by both
astronomical and geophysical observatories and
satellite observations. Measured data is stored in
heterogeneous sources – relational databases, textual
files, image data, etc. However the most of the data
is available via web services, for example, from
NOAA Space Weather Prediction Center
(http://www.swpc.noaa.gov/SWN).
GISTAM 2016 - 2nd International Conference on Geographical Information Systems Theory, Applications and Management
198
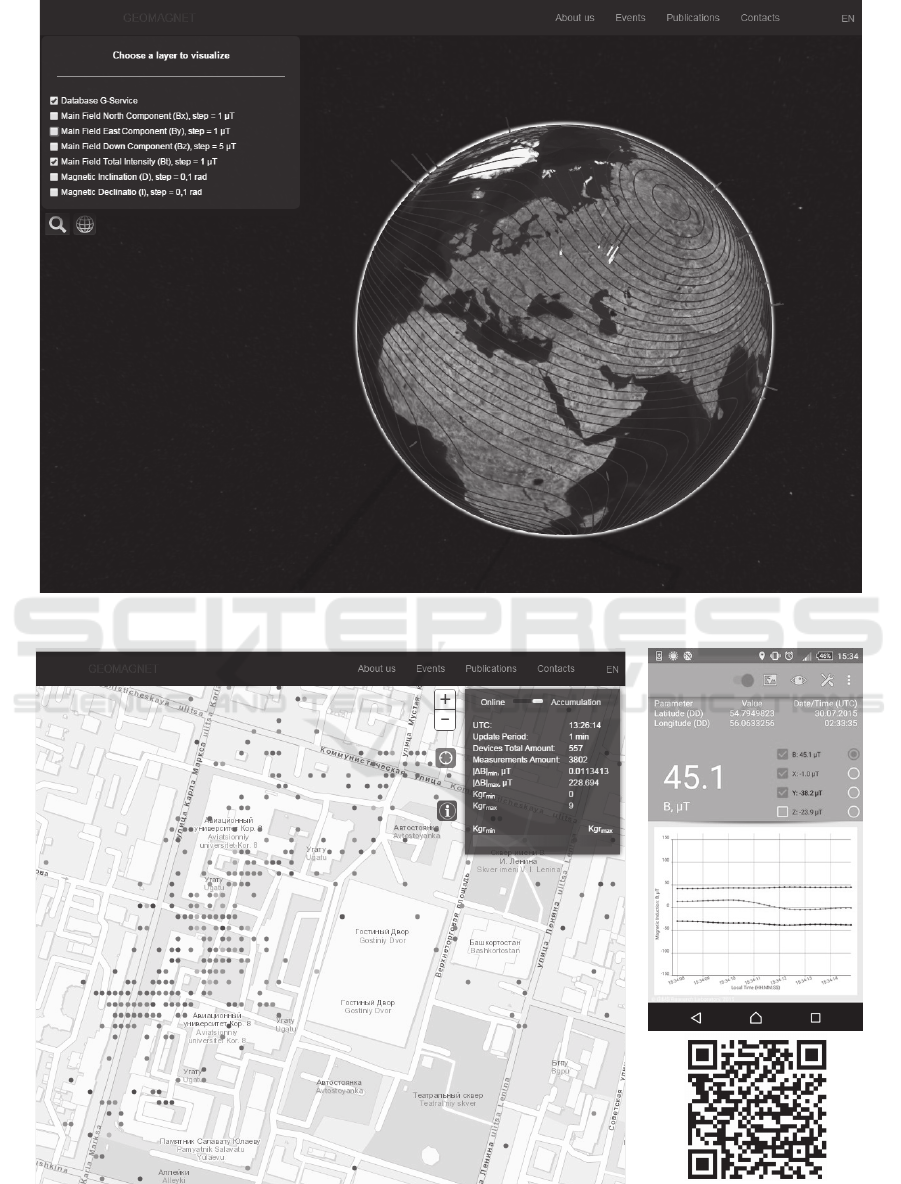
Figure 2: M-Service (http://geomagnet.ru/M/index.html).
Figure 3: G-Service (http://geomagnet.ru/GroundMonitoring/) and G-module.
Geoinformation System for Analytical Control and Forecast of the Earth’s Magnetosphere Parameters
199

Web application "I-service" ("Solar Activity:
Monitoring and Analysis") allows users to monitor
solar weather in real time (on the basis of satellite
observations) and carry out a comprehensive
analysis of its parameters, to assess how their values
change for different periods of time (from one hour
to several days). Data analysis is also available in
amplitude and frequency mode by single or groups
of parameters of space weather.
It is also necessary to mention that
GEOMAGNET includes a set of mobile
applications: "Ground Monitoring App", "Solar
Activity App", "Intellection Test Module App",
"Magnetic Error Calculator App" and others. The
applications provide collection and transmition of
data about magnetic state parameters. Today the
applications are widely used by specialists in
geophysics, medicine, metrology and many other
areas (about several thousand downloads all around
the world). Data obtained is stored on server and
available via web-portal "Geomagnet", so any user
can access it anywhere anytime.
5 CONCLUSION
Geomagnetic field is a complex structured natural
matter with ambiguous field characteristics, which is
distributed in the Earth (and near-Earth) space and
interacts with both astronomical objects and objects /
processes on the Earth’s surface, subsoil and in near-
Earth space. Geomagnetic field and its variation can
influence on systems and objects of various origins.
The estimation of the influence requires an effective
approach to analyze the principles of distribution of
geomagnetic field parameters on the Earth’s surface,
its subsoil and in circumterrestrial space. The
approach causes a complicated problem to be
solved, which is concerned with modeling and
visualization of geomagnetic field and its variations
parameters. The most effective and obvious solution
to this problem is supposed to be a geoinformation
system.
Web-portal "Geomagnet" (Russian Federation)
provides the complex calculation, analysis and
2D/3D-visualization of geomagnetic field and its
variations parameters. Geomagnetic field and its
variations models, which are represented and
described by "Geomagnet", meet the requirements of
specialists in various areas. They effectively provide
formatting and structuring the data about the Earth
magnetosphere parameters and their further analysis.
ACKNOWLEDGEMENTS
The reported study was supported by RFBR,
research projects No. 14-07-00260-a, 14-07-31344-
mol-a, 15-17-20002-d_s, 15-07-02731_a, and the
grant of President of Russian Federation for the
young scientists support MK-5340.2015.9.
REFERENCES
Campbell, W. H., 2003. Introduction to Geomagnetic
Fields, Cambridge University Press, 2
nd
edition.
Chizhevskii, A. L., 1976. Earth echo of sun storms, Mysl.
Moscow (in Russian).
Haklay, M., Singleton, A., Parker, C., 2008. Web Mapping
2.0: The Neogeography of the Geo Web. In
Geography Compass, 2, 2011-2039.
Mandea, M., Korte M. (Eds), 2011. Geomagnetic
Observations and Models. In IAGA Special Sopron
Series. Vol 5", Springer.
Merrill, R. T., McElhinny, M. W., McFadden, P. L., 1996.
The Magnetic Field of the Earth. Academic Press.
Vernadsky, V. I., 2004. The biosphere and the noosphere,
Iris Press, Moscow (In Russian).
Vorobev, A. V., Shakirova, G. R., 2015. Modeling and
2D/3D-visualization of geomagnetic field and its
variations parameters. In 1st International Conference
on Geographical Information Systems Theory,
Applications and Management (GISTAM).
GISTAM 2016 - 2nd International Conference on Geographical Information Systems Theory, Applications and Management
200
