
ppbench
A Visualizing Network Benchmark for Microservices
Nane Kratzke and Peter-Christian Quint
Lübeck University of Applied Sciences, Center of Excellence COSA, Lübeck, Germany
Keywords:
Microservice, Container, Docker, Cluster, Network, Performance, Reference, Benchmark, REST, SDN.
Abstract:
Companies like Netflix, Google, Amazon, Twitter successfully exemplified elastic and scalable microservice
architectures for very large systems. Microservice architectures are often realized in a way to deploy services
as containers on container clusters. Containerized microservices often use lightweight and REST-based mech-
anisms. However, this lightweight communication is often routed by container clusters through heavyweight
software defined networks (SDN). Services are often implemented in different programming languages adding
additional complexity to a system, which might end in decreased performance. Astonishingly it is quite com-
plex to figure out these impacts in the upfront of a microservice design process due to missing and specialized
benchmarks. This contribution proposes a benchmark intentionally designed for this microservice setting. We
advocate that it is more useful to reflect fundamental design decisions and their performance impacts in the
upfront of a microservice architecture development and not in the aftermath. We present some findings regard-
ing performance impacts of some TIOBE TOP 50 programming languages (Go, Java, Ruby, Dart), containers
(Docker as type representative) and SDN solutions (Weave as type representative).
1 INTRODUCTION
Recent popularity of container technologies, notably
Docker (Docker Inc., 2015), and container cluster so-
lutions like Kubernetes/Borg (Verma et al., 2015) and
Apache Mesos (Hindman et al., 2011) show the in-
creasing interest of operating system virtualization
to cloud computing. Operating system virtualization
provides an immanent and often overseen cloud in-
frastructure abstraction layer (Kratzke, 2014) which
is preferable from a vendor lock-in avoiding point of
view, but also raises new questions.
A lot of companies share technological vendor lock-in
worries (Talukder et al., 2010) due to a lack of cloud
service standardization, a lack of open source tools
with cross provider support or shortcomings of cur-
rent cloud deployment technologies. The dream of
a ’meta cloud’ seems far away, although it is postu-
lated that all necessary technology has been already
invented but not been integrated (Satzger et al., 2013).
Container and container cluster technologies seem to
provide solutions out of the box for these kind of
shortcomings. Alongside this increasing interest in
container and container clusters the term microser-
vices is often mentioned in one breath with container
technologies (Newman, 2015).
"In short, the microservice architectural style is an
approach to developing a single application as a suite
of small services, each running in its own process
and communicating with lightweight mechanisms, of-
ten an HTTP resource API. [...] Services are inde-
pendently deployable and scalable, each service also
provides a firm module boundary, even allowing for
different services to be written in different program-
ming languages." (Blog Post from Martin Fowler)
Container technologies seem like a perfect fit for
this microservice architectural approach, which has
been made popular by companies like Google, Face-
book, Netflix or Twitter for large scale and elastic
distributed system deployments. Container solutions,
notably Docker, providing a standard runtime, image
format, and build system for Linux containers deploy-
able to any Infrastructure as a Service (IaaS) environ-
ment. From a microservice point of view, container-
ization is not about operating system virtualization, it
is about standardizing the way how to deploy services.
Due to REST-based protocols (Fielding, 2000) mi-
croservice architectures are inherently horizontally
scalable. That might be why the microservice archi-
tectural style is getting more and more attention for
real world cloud systems engineering. However, there
are almost no specialized tools to figure out perfor-
Kratzke, N. and Quint, P-C.
ppbench - A Visualizing Network Benchmark for Microservices.
In Proceedings of the 6th International Conference on Cloud Computing and Services Science (CLOSER 2016) - Volume 2, pages 223-231
ISBN: 978-989-758-182-3
Copyright
c
2016 by SCITEPRESS – Science and Technology Publications, Lda. All rights reserved
223

mance impacts coming along with this architectural
style. These performance impacts might be due to
fundamental design decisions
(1) to use different languages for different services,
(2) to use REST APIs for service composition,
(3) to use few but big or many but small messages,
(4) to encapsulate services into containers,
(5) to use container clusters to handle complexity
1
,
(6) to deploy services on virtual machine types,
(7) to deploy services to different cloud providers.
This list is likely not complete. Nevertheless, it
should be obvious for the reader that network perfor-
mance is a critical aspect for the overall performance
of microservice architectures. And a system architect
should be aware of these impacts to ponder what im-
pacts are acceptable or not. Some design decisions
like to use a specific programming language, to de-
sign APIs for few but big or many but small mes-
sages have to be made very early. For instance: It
is simply not feasible to develop a service and run
performance benchmarks in the aftermath to find out
that the used programming language is known to have
problems with specific message sizes. Of course there
exist network benchmarks to measure network perfor-
mance of infrastructures (for example iperf (Berkley
Lab, 2015)) or for specific web applications (for ex-
ample httperf (HP Labs, 2008)). However, these tools
do not support engineers directly in figuring out what
the performance impact of specific programming lan-
guages, message sizes, containerization, different vir-
tual machine types, cloud provider infrastructures,
etc. in the upfront of a microservice design might
be.
Therefore, we propose a highly automated bench-
marking solution in Section 2. Our proposal is in-
tentionally designed for the microservice domain and
covering above mentioned performance impacts for
upfront design decisions. We implemented our pro-
posal as a software prototype and describe how to
download, install and use the benchmark in Section
3. Additionally, we present exemplary results in Sec-
tion 4. The performed experiments have been de-
rived from above mentioned design questions as ex-
amples how to use ppbench to answer microservice
related performance questions. Section 5 reflects re-
lated work and shows how ppbench is different com-
pared with already existing network benchmarks. We
conclude our findings and provide an outlook in Sec-
tion 6.
1
And therefore accept performance impacts of software
defined networks which are often used under the hood of
container clusters.
Table 1: Used programming languages and HTTP libraries.
Language Version server library client library
Go 1.5 net/http + gorilla/mux net/http
Ruby 2.2 Webrick httpclient
Java 1.8 com.sun.net.httpserver java.net + java.io
Dart 1.12 http + start http
Ping and pong services are implemented in all of mentioned languages
to compare programming language and HTTP library impact on network
performance. HTTP libraries are used in a multithreaded way, so that
services should benefit from multi-core machines. Ppbench is designed to
be extended for arbitrary programming languages and HTTP libraries, so
the above list can be easily extended.
2 BENCHMARK DESIGN
The proposed benchmark is designed intentionally to
support upfront design decision making regarding mi-
croservice related performance aspects. To some de-
gree the benchmark might be useful to measure gen-
eral HTTP performance as well. But this is not the
intended purpose.
To analyze the network performance impact of con-
tainer, software defined network (SDN) layers and
machine types on the performance impact of dis-
tributed cloud based systems using REST-based pro-
tocols, several basic experiment settings are provided
(see Figure 1). All experiments rely on a basic ping-
pong system which provides a REST-based protocol
to exchange data. This kind of service coupling is
commonly used in microservice architectures. The
ping and pong services are implemented by an extend-
able list of different programming languages shown in
Table 1. HTTP requests can be send to this ping-pong
system from a siege host. Via this request the inner
message length between pong and ping server can be
defined. So it is possible to measure round-trip la-
tencies between ping and pong for specific message
sizes. This can be astonishingly tricky to realize with
standard network benchmarks (see Section 5).
Instead of using existing HTTP benchmarking tools
like Apachebench or httperf we decided to develop
a special benchmarking script (ppbench). Ppbench
is used to collect a n% random sample of all possi-
ble message sizes between a minimum and maximum
message size. The ping server relays each request to
the pong server. And the pong server answers the
request with a m byte long answer message (as re-
quested by the HTTP request). The ping server mea-
sures the round-trip latency from request entry to the
point in time when the pong answer hit the ping server
again. The ping server answers the request with a
JSON message including round-trip latency between
ping and pong, the length of the returned message, the
HTTP status code send by pong and the number of
CLOSER 2016 - 6th International Conference on Cloud Computing and Services Science
224
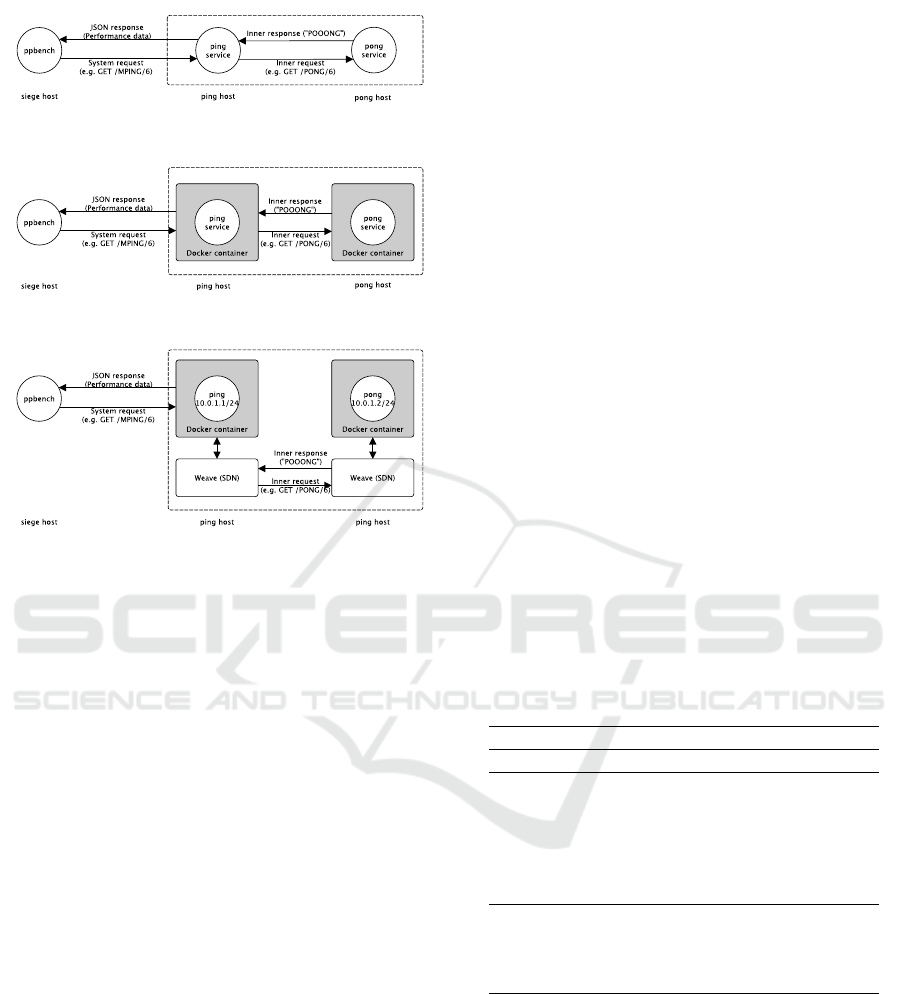
(a) Bare experiment to identify reference performance with con-
tainerization and SDN applied.
(b) Container experiment to identify impact of containers (here
Docker, other solutions are extendable).
(c) SDN experiment to identify impact of SDN (here Weave, other
solutions are extendable).
Figure 1: Deployment modes.
retries to establish a HTTP connection between ping
and pong.
The Bare deployment mode shown in Figure 1(a) is
used to collect performance data of a barely deployed
ping-pong system (that means without containeriza-
tion or SDN involved).
The Container deployment mode shown in Figure
1(b) is used to figure out the impact of an additional
container layer to network performance. This deploy-
ment mode covers the trend to use containerization in
microservice architectures. Docker is only a type rep-
resentative for container technologies. Like the ping
and pong services can be implemented in other pro-
gramming languages, this is can be done for the con-
tainer technology as well and is due to further exten-
sions of the prototype.
The SDN deployment mode shown in Figure 1(c) is
used to figure out the impact of an additional SDN
layer to network performance. This covers the trend
to deploy containers onto container clusters in modern
microservice architectures. Container clusters often
rely on software defined networking under the hood.
Weave (Weave Works, 2015) has been taken as a type
representative for a container focused SDN solution
to connect ping and pong containers. Because every
data transfer must pass the SDN between ping and
pong, the performance impact must be due to this ad-
ditional SDN layer. Other SDN solutions like flannel
(CoreOS, 2015) are possible and due to further exten-
sions of the presented prototype (see Section 6).
3 OPERATING GUIDELINE
All relevant statistical data processing and data pre-
sentation are delegated by ppbench to the statistical
computing toolsuite R (R Core Team, 2014). Ppbench
can present benchmark data in an absolute (scatter
plots or confidence bands) or a relative way (com-
parison plots) to support engineers in drawing general
and valid conclusions by visualizing trends and confi-
dence intervals (Schmid and Huber, 2014).
On the one hand ppbench is a reference implemen-
tation of the ping- and pong-services written in dif-
ferent programming languages (Go, Ruby, Java and
Dart) and provided with different but typical cloud
deployment forms (bare, containerized, connected via
a SDN solution, see Figure 1). So we explain how
to setup hosts to operate ping and pong-services in
the mentioned deployment modes. Ppbench is on the
other hand a command line application to run bench-
marks and analyze and visualize their results. So we
will explain how to install the frontend to run bench-
marks, and how to use it to analyze and visualize re-
sults.
Table 2: Commands of ppbench.
Command Description
run Runs a ping pong benchmark.
latency-comparison-plot Plot round-trip latencies (relative)
latency-plot Plot round-trip latencies (absolute)
request-comparison-plot Plot requests per second (relative)
request-plot Plot requests per second (absolute)
transfer-comparison-plot Plot data transfer rates (relative)
transfer-plot Plots data transfer rates (absolute)
citation Citation information about ppbench.
help Display help documentation
summary Summarizes benchmark data.
naming-template Generates a JSON file for naming.
Setup Ping and Pong Hosts. The process to setup
ping and pong hosts is automated to reduce possible
configuration errors and increase data quality. After a
virtual machine is launched on an IaaS infrastructure,
it is possible to do a remote login on ping and pong
hosts and simply run
cd pingpong
./install.sh
to install all necessary packages and software
on these hosts. The initial setup is done via
ppbench - A Visualizing Network Benchmark for Microservices
225

Table 3: Options for the run command of ppbench.
Option Description Default Example
-host Ping host - -host http://1.2.3.4:8080
-machine Tag to categorize the machine - -machine m3.2xlarge
-experiment Tag to categorize the experiment - -experiment bare-go
-min Minimum message size in bytes 1 -min 10000
-max Maximum message size in bytes 500000 -max 50000
-coverage Defines sample size between min and max 0.05 -coverage 0.1
-repetitions Repetitions for each message 1 -repetitions 10
-concurrency Concurrent request 1 -concurrency 10
-timeout Timeout in seconds for a HTTP request 60 -timeout 5
cloud-init. This will download the latest ver-
sion of ppbench from github.com where it is
under source control and provided for public
(https://github.com/nkratzke/pingpong).
Starting and Stopping Services. The installation
will provide a start- and a stop-script on the host,
which can be used to start and stop different ping and
pong services in different deployment modes (bare,
containerized, SDN, see Figure 1). In most cases, a
benchmark setup will begin by starting a pong service
on the pong host. It is essential to figure out the IP ad-
dress or the DNS name of this pong host (PONGIP).
This might be a private (IaaS infrastructure internal)
or public (worldwide accessible) IP address. The ping
host must be able to reach this PONGIP. To start the
Go implementation of the pong service provided as a
Docker container we would do the following on the
pong host:
./start.sh docker pong-go
Starting ping services works basicly the same. Addi-
tionally the ping service must know its communicat-
ing counterpart (PONGIP). To start the Go implemen-
tation of the ping service provided in its bare deploy-
ment mode, we would do the following on the ping
host:
./start.sh bare ping-go {PONGIP}
By default all services are configured to run on port
8080 for simplicity reasons and to reduce configura-
tion error liability.
The Command Line Application. Ppbench is
written in Ruby 2.2 and is additionally hosted on
RubyGems.org for convenience. It can be easily in-
stalled (and updated) via the gem command provided
with Ruby 2.2 (or higher).
gem install ppbench
Ppbench can be run on any machine. This machine
is called the siege host. It is not necessary to deploy
the siege host to the same cloud infrastructure because
ppbench is measuring performance between ping and
pong, and not between siege and ping. In most cases,
ppbench is installed on a workstation or laptop out-
side the cloud. Ppbench provides several commands
to define and run benchmarks and to analyze data.
ppbench.rb help
will show all available commands (see Tables 2, 3, 4).
For this contribution, we will concentrate on defining
and running a benchmark against a cloud deployed
ping-pong system and on doing some data analytics.
Running a Benchmark. A typical benchmark run
with default options can be started like that:
ppbench.rb run
--host http://1.2.3.4:8080 \
--machine m3.2xlarge \
--experiment bare-go \
benchmark-data.csv
The benchmark will send an defined amount of re-
quests to the ping service (hosted on IP 1.2.3.4 and
listening on port 8080). The ping service will forward
the request to the pong service and will measure the
round-trip latency to handle this request. This bench-
mark data is returned to ppbench and stored in a file
called benchmark-data.csv. The data is tagged to
be run on a m3.2xlarge instance, and the experiment is
tagged as bare-go. It is up to the operator to select ap-
propriate tags. The tags are mainly used to filter spe-
cific data for plotting. This logfile can be processed
with ppbench plot commands (see Table 2).
Because tags for machines and experiments are often
short and not very descriptive, there is the option to
use more descriptive texts. The following command
will generate a JSON template for a more descriptive
naming which can be used with the -naming option.
ppbench.rb naming-template *.csv \
> naming.json
There are further command line options to define
message sizes, concurrency, repetitions, and so on
(see Table 3).
Plotting Benchmark Results. Ppbench can plot
transfer rates, round-trip latency and requests per sec-
ond. We demonstrate it using transfer rates:
CLOSER 2016 - 6th International Conference on Cloud Computing and Services Science
226

Table 4: Options for the plot commands of ppbench.
Option Description Default Example
-machines Consider only specific machines All machines -machines m3.xlarge,m3.2xlarge
-experiments Consider only specific experiments All experiments -experiments bare-go,docker-go
-recwindow Plot TCP standard receive window 87380 -recwindow 0 (will not plot the window)
-yaxis_max Maximum value on Y-axis biggest value -yaxis_max 50000
-xaxis_max Maximum value on X-axis biggest value -xaxis_max 500000
-yaxis_ticks Ticks to present on Y-axis 10 -yaxis_ticks 20
-xaxis_ticks Ticks to present on X-axis 10 -xaxis_ticks 30
-withbands Flag to plot confidence bands no plot -withbands
-confidence Percent value for confidence bands 90 -confidence 75
-nopoints Flag not to plot single data points plot -nopoints
-alpha Transparency (alpha) for data points 0.05 -alpha 0.01
-precision Number of points for medians 1000 -precision 100
-naming Use user defined names
2
not used -naming description.son
-pdf Tell R to generate a PDF file no pdf -pdf example.pdf
-width Width of plot (inch, PDF only) 7 -width 8
-height Height of plot (inch, PDF only) 7 -height 6
ppbench.rb transfer-plot \
--machines m3.xlarge,m3.2xlarge \
--experiments bare-go,bare-dart \
*.csv > plot.R
The plot will contain only data collected on machines
tagged as m3.xlarge or m3.2xlarge and for experi-
ments tagged as bare-go or bare-dart. The result is
written to standard out. So it is possible to use pp-
bench in complex command pipes.
To add medians and confidence bands we simply have
to add the -withbands option. To surpress plot-
ting of single measurements we only have to add the
-nopoints flag. This is in most cases the best op-
tion to compare absolute values of two or more data
series avoiding the jitter of thousands of single mea-
surements (we use this mainly in Section 4).
ppbench.rb transfer-plot \
--machines m3.2xlarge \
--experiments bare,weave \
--withbands --nopoints \
*.csv > plot.R
Above mentioned commands can be used to show and
compare absolute values. But it is possible to com-
pare data series in a relative way as well. That is what
system architects are normally interested in. There is
a comparison plot command for every metric (latency,
transfer rate, request per second, see Table 2). For a
relative comparison of the above mentioned example
we would do something like that:
ppbench.rb transfer-comparison-plot \
--machines m3.2xlarge \
--experiments bare,weave \
*.csv > plot.R
All series are shown relatively to a reference data se-
ries. The reference data series is in all cases the first
combination of the -machines and -experiments
entries. In the above shown example, this would be
the data series for the bare experiment executed on a
m3.2xlarge machine.
4 EVALUATION
Table 5 shows all experiments which have been per-
formed to evaluate ppbench. The experiments had not
the intention to cover all microservice related perfor-
mance aspects but to show exemplarily how to use
ppbench to answer microservice related performance
questions formulated exemplary in Section 1. We
evaluated ppbench using the following experiments:
(1) Language impact (P1 - P4)
(2) Container impact (C1 - C4)
(3) General SDN impact (S1 - S4)
(4) Impact of SDN/VM type combinations (V1 - V6)
We only present data that was collected in AWS
(Amazon Web Services) region eu-central-1. We
cross checked AWS data with data collected in GCE
(Google Compute Engine). Due to page limita-
tions GCE data is not presented but it fully sup-
ports our findings. We intentionally worked with a
very small set of instance types (m3.large, m3.xlarge
and m3.2xlarge) that show high similarities with
other public cloud virtual machines types like GCE
machine types (n1-standard-2, n1-standard-4, n1-
standard-8) according to (Kratzke and Quint, 2015a).
Although this covers only a small subset of possi-
ble combinations, it is fully sufficient to show how
ppbench can be used to figure out interesting perfor-
mance aspects.
Figuring out Language Impact (P1 - P4). We used
the experiments P1 (Go), P2 (Java), P3 (Ruby) and
ppbench - A Visualizing Network Benchmark for Microservices
227

P4 (Dart) to figure out the performance impact of dif-
ferent programming languages (see Table 5). All ex-
periments rely on the bare deployment mode shown
in Figure 1(a). Communication between REST-based
services is mainly network I/O. Network I/O is very
slow compared with processing. Programming lan-
guage impact on network I/O should be minor. Net-
work applications are waiting most of their time on
the I/O subsystem. So a "faster" programming lan-
guage shall have only limited impact on performance.
However, ppbench showed that reality is a lot more
complicated. We think this has nothing to do with the
programming languages itself, but the performance
(buffering strategies and so on) of the "default" HTTP
and TCP libraries delivered with each programming
language (see Table 1). However, we did not com-
pared different HTTP libraries for the same language.
We used requests per second as metric to visualize
language impact on REST-performance (Figure 2).
Most interesting curve is the non-continuous curve
for Dart (Figure 2, lightblue line). It turned out that
these non-continuous effects are aligned to the stan-
dard TCP receive window TCP
window
(Bormann et al.,
2014). Therefore, we highlighted (throughout com-
plete contribution) TCP
window
(87380 bytes on the
systems under test) as dotted lines to give the reader
some visual guidance. At 3× TCP
window
we see a very
sharp decline for Dart. Some similar non-continuous
effects can be seen at around 8.7kB ≈
1
10
TCP
window
for Java and Ruby.
Taking Figure 2 we now can recommend specific pro-
gramming languages for specific ranges of message
sizes. Go can be recommended for services produc-
Table 5: Experiments for Evaluation, Docker has been cho-
sen as container technology. Weave has been chosen as
SDN technology.
Ping service Pong service
Exp. Lang. Mode VM Lang. Mode VM
P1/V5 Go Bare m3.2xl Go Bare m3.2xl
P2 Java Bare m3.2xl Java Bare m3.2xl
P3 Ruby Bare m3.2xl Ruby Bare m3.2xl
P4 Dart Bare m3.2xl Dart Bare m3.2xl
C1/V3 Go Bare m3.xl Go Bare m3.xl
C2 Go Con. m3.xl Go Con. m3.xl
C3 Dart Bare m3.xl Dart Bare m3.xl
C4 Dart Con. m3.xl Dart Con. m3.xl
S1/V1 Go Bare m3.l Go Bare m3.l
S2/V2 Go SDN m3.l Go SDN m3.l
S3 Ruby Bare m3.l Ruby Bare m3.l
S4 Ruby SDN m3.l Ruby SDN m3.l
V4 Go SDN m3.xl Go SDN m3.xl
V6 Go SDN m3.2xl Go SDN m3.2xl
Abbreviations for AWS VM types:
m3.l
ˆ
= m3.large; m3.xl
ˆ
= m3.xlarge; m3.2xl
ˆ
= m3.2xlarge
Requests per second in relative comparison
(bigger is better)
Message Size (kB)
Ratio (%)
0kB 50kB 150kB 250kB 350kB 450kB
0% 20% 40% 60% 80% 110% 140% 170% 200%
●
●
●
●
Reference: Go (Exp. P1) on m3.2xlarge
Java (Exp. P2) on m3.2xlarge
Ruby (Exp. P3) on m3.2xlarge
Dart (Exp. P4) on m3.2xlarge
Figure 2: Exemplary programming language impact on re-
quests per second (Experiments P1 - P4)
ing messages fitting in [0...
1
2
TCP
window
], Java can
be recommended for services with messages within
[
1
2
TCP
window
...TCP
window
], Dart for services produc-
ing messages fitting only in [2 × TCP
window
...3 ×
TCP
window
], and finally Ruby for big messages fitting
only in [4× TCP
window
...[. These detailed insights are
astonishingly complex and surprising, because there
exist the myth in cloud programming community that
Go is one of the most performant languages for net-
work I/O in all cases. Ppbench showed that even
Ruby can show better performances, although Ruby
is not known to be a very processing performant lan-
guage.
Figuring out Container Impact (C1 - C4). Contain-
ers are meant to be lightweight. So containers should
show only small impact on network performances.
According to our above mentioned insights we used
the Go implementations for the ping-pong system to
figure out the impact of containers for services imple-
mented in languages with continuous performance
behavior. We used the Dart implementation to fig-
ure out the container impact for services implemented
in languages with non-continuous performance be-
havior. For both implementations we used the bare
deployment mode shown in Figure 1(a) to figure out
the reference performance for each language (C1, C3;
see Table 5). And we used the container deployment
mode in Figure 1(b) to figure out the impact of con-
tainers on network performance (C2, C4; see Table5).
We used round-trip latency as metric to visualize
container impact on REST-performance (Figure 3).
Containerization of the Dart implementation shows
about 10% performance impact for all message sizes
CLOSER 2016 - 6th International Conference on Cloud Computing and Services Science
228

Round−trip latency in relative comparison
(smaller is better)
Message Size (kB)
Ratio (%)
0kB 50kB 150kB 250kB 350kB 450kB
90% 110% 130%
●
●
●
Reference on m3.xlarge (Exp. C1/C3)
Dockerized Go (Exp. C2 compared with C1) on m3.xlarge
Dockerized Dart (Exp. C4 compared with C3) on m3.xlarge
Figure 3: Examplary container impact on latencies (Exper-
iments C1 - C4).
(slightly decreasing for bigger messages). The con-
tainerization impact on the Go implementation is only
measurable for small message sizes but around 20%
which might be not negligible. For bigger message
sizes it is hardly distinguishable from the reference
performance. We can conclude, that containerization
effects might be language specific.
Figuring out SDN Impact (S1 - S4). SDN solutions
contend for the same CPU like payload processes.
SDN might have noticable performance impacts. Ac-
cording to our above mentioned insights, we used the
Go implementation for the ping-pong system to fig-
ure out the impact of SDN. Due to the fact that the Go
implementation did not show the best network per-
formance for big message sizes, we decided to mea-
sure the performance impact with the Ruby imple-
mentation as well (best transfer rates for big message
sizes). For both languages we used the bare deploy-
ment mode shown in Figure 1(a) to figure out the ref-
erence performance (S1, S3; see Table 5). And we
used the SDN deployment mode in Figure 1(b) to fig-
ure out the impact of SDN on network performance
(S2, S4; see Table 5). We used intentionally the small-
est machine type (m3.large, virtual 2-core system) of
our machine types to stress CPU contentation effects
of the ping and pong services and the SDN routing
processes.
Data transfer rates are used to visualize SDN impact
on REST-performances. Figure 4 shows relative im-
pact of a SDN layer to REST-performance for Go
and Ruby implementations. In second and higher
TCP
window
the SDN impact is clearly measurable for
Go and Ruby. The impact for both languages seem
to play in the same league (about 60% to 70% of
the reference performance). Go seems to be a little
less vulnerable for negative performance impacts due
to containerization than Ruby. We see even a posi-
tive impact of SDNs for Ruby in the first TCP
window
.
Remember, we identified non-continuous behavior
for Ruby (and for Java as well) at
1
10
TCP
window
. It
turned out that the SDN solution attentuated the non-
Data transfer in relative comparison
(bigger is better)
Message Size (kB)
Ratio (%)
0kB 50kB 150kB 250kB 350kB 450kB
20% 50% 80% 120%
●
●
●
Reference (Exp. S1, S3) on m3.large
Go, SDN deployed (Exp. S2 compared with S1) on m3.large
Ruby, SDN deployed (Exp. S4 compared with S3) on m3.large
Figure 4: Exemplary SDN impact on transfer rates (Exper-
iments S1 - S4).
continuous effect in the first TCP
window
for the Ruby
implementation. This attentuation showed in average
a positive effect on network performance in the 1st
TCP
window
.
Figuring out VM Type Impact on SDN Perfor-
mance (V1 - V6). SDN impact on network perfor-
mance can be worse (see Figure 4). This has mainly
to do with effects where service processes contend
with SDN processes for the same CPU on the same
virtual machine. So, these effects should decrease on
machine types with more virtual cores. We reused
the introduced experiments S1 (as V1) and S2 (as
V2) to figure out the performance impact of SDNs
on a virtual 2-core system (m3.large). We reused the
bare deployed experiment C1 (as V3) to figure out
the reference performance on a virtual 4-core system
(m3.xlarge) and compared it with the same but SDN
deployed experiment V4. We did exactly the same
with V5 (reuse of P1) und V6 on a virtual 8-core sys-
tem (m3.2xlarge). All experiments (see Table 5) used
the Go implementation for the ping-pong system due
to Go’s continous network behavior.
Figure 5 compares the performance impact of the
SDN deployment mode shown in Figure 1(c) with the
bare deployment mode shown in Figure 1(a) on dif-
ferent VM types (2-core, 4-core and 8-core). We saw
exactly the effect we postulated. The SDN impact on
8-core machine types is less distinctly than on 4- or
2-core machine types. While 2- and 4-core machine
types show similar performance impacts in first and
second TCP
window
. The 2-core machine type looses
significantly in the third and higher TCP
window
. High
core machine types can effectively attentuate the neg-
ative impact on network performance of SDN solu-
tions.
Summary. Programming Languages (or their stan-
dard HTTP and TCP libraries) may have a substan-
tial impact on REST-performance. Three out of four
analyzed languages showed non-continous network
behavior, so that messages being only some bytes
larger or smaller may show completely different la-
ppbench - A Visualizing Network Benchmark for Microservices
229

Data transfer in relative comparison
(bigger is better)
Message Size (kB)
Ratio (%)
0kB 50kB 150kB 250kB 350kB 450kB
40% 60% 80% 100% 120%
●
●
●
●
Reference: (Exp. V1, V3, V5)
SDN loss on m3.large (2−core, V2 compared with V1)
SDN loss on m3.xlarge (4−core, V4 compared with V3)
SDN loss on m3.2xlarge (8−core, V6 compared with V5)
Figure 5: How different virtual machine types can decrease
SDN impact on transfer rates (Experiments V1 - V6).
tencies or transfer rates. We identified such effects at
1
10
TCP
window
(Ruby, Java) and 3 × TCP
window
(Dart).
There is not the best programming language showing
best results for all message sizes.
The performance impact of containerization is not
severe but sometimes not negligible. Small message
performance may be more vulnerable to performance
impacts than big message performance.
Other than containerization, the impact of SDN can
be severe, especially on small core machine types.
Machine types with more cores decrease the perfor-
mance impact of SDN because CPU contention ef-
fects are reduced. SDN impacts can be decreased
by a virtual 8-core machine type to a level compa-
rable to containerization. Due to attenuation effects
SDN can even show positive effects in case of non-
continuous network behavior. But the reader is ref-
ered to (Kratzke and Quint, 2015b) for these details.
5 RELATED WORK
There exist a several TCP/UDP networking bench-
marks like iperf (Berkley Lab, 2015), uperf (Sun
Microsystems, 2012), netperf (netperf.org, 2012) and
so on. (Velásquez and Gamess, 2009) provide a
much more complete and comparative analysis of
network benchmarking tools. (Kratzke and Quint,
2015a) present a detailled list on cloud computing re-
lated (network) benchmarks. Most of these bench-
marks focus pure TCP/UDP performance (Velásquez
and Gamess, 2009) and rely on one end on a spe-
cific server component used to generate network load.
These benchmarks are valuable to compare principal
network performance of different (cloud) infrastruc-
tures by comparing what maximum network perfor-
mances can be expected for specific (cloud) infras-
tructures. But maximum expectable network perfor-
mances are in most cases not very realistic for REST-
based protocols.
Other HTTP related benchmarks like httperf (HP
Labs, 2008) or ab (Apache Software Foundation,
2015) are obviously much more relevant for REST-
based microservice approaches. These tools can
benchmark arbitrary web applications. But because
the applications under test are not under direct control
of the benchmark, these tools can hardly define pre-
cise loads within a specific frame of interest. There-
fore HTTP related benchmarks are mainly used to
run benchmarks against specific test resources (e.g.
a HTML test page). But this make it hard to identify
trends or non-continuous network behavior.
Ppbench is more a mix of tools like iperf (TCP/UDP
benchmarks) and httperf (HTTP benchmarks) due to
the fact that ppbench provides a benchmark frontend
(which is conceptually similar to httperf or ab) and a
reference implementation under test (ping-pong sys-
tem which is conceptually similar to a iperf server).
Most of the above mentioned benchmarks concentrate
on data measurement and do not provide appropriate
visualizations of collected data. This may hide trends
or even non-continuous network behavior. That is
why ppbench focus data visualization as well.
6 CONCLUSION AND OUTLOOK
We used some high ranked programming languages
like Java (Rank 1) and Ruby (Rank 12) from the TOP
20 and Dart (Rank 28) and Go (Rank 44) from the
TOP 50 of the TIOBE
3
programming index. We cov-
ered container solutions (Docker) and a SDN solu-
tion (Weave) to figure out impact of programming lan-
guages, containerization and SDN. These technolo-
gies are more and more applied for microservice ap-
proaches. The presented tool and technology selec-
tion provides no complete coverage and so we plan to
extend our presented solution ppbench with additional
languages, further HTTP/TCP libraries, container and
SDN
4
solutions to provide microservice architects a
profound benchmarking toolsuite which can be used
in the upfront of a microservice system design. We
evaluated ppbench by comparing different program-
ming languages and identifying the expectable impact
of containers and SDN solutions to the overall perfor-
mance of microservice architectures. This was simply
done to demonstrate how to use ppbench in real world
scenarios. However, some insights might be valuable
for microservice architects to think about.
3
http://www.tiobe.com/index.php/content/paperinfo/tpc
i/index.html, September 2015.
4
Meanwhile Calico SDN solution has been added.
CLOSER 2016 - 6th International Conference on Cloud Computing and Services Science
230

The impact of programming languages on REST-
performance should not be underestimated. Al-
though Go is meant to be a very performant language
for network I/O, ppbench turned out that Go is only
the best choice for messages smaller than half of a
TCP standard receive window. In all other cases we
identified better performances with other languages.
SDN increases flexibility at the cost of decreased per-
formance in microservice architectures. SDN on low
core machine types can even half the performance!
Nevertheless, on high core virtual machine types
SDN impacts can be neglected compared with pro-
gramming language impact.
Three of four analyzed programming languages
showed significant non-continous network behavior
which seem to be aligned to TCP standard receive
window sizes on systems under test. We did not fig-
ured out whether this was on client or server (or both)
sides. However, this insight (subject to ongoing inves-
tigations) could be used to tune some services simply
by changing the TCP window size on the host system.
Finally, our contribution can be used as reference by
other researchers to show how new approaches in mi-
croservice design can improve performance.
ACKNOWLEDGEMENTS
This study was funded by German Federal Ministry of Edu-
cation and Research (03FH021PX4). We thank René Peinl
for his valuable feedback. We used research grants by cour-
tesy of Amazon Web Services. We thank Lübeck University
(ITM) and fat IT solution GmbH for their general support.
REFERENCES
Apache Software Foundation (2015). ab -
Apache HTTP server benchmarking tool.
http://httpd.apache.org/docs/2.2/programs/ab.html.
Berkley Lab (2015). iPerf - The network bandwidth mea-
surement tool. https://iperf.fr.
Bormann, D., Braden, B., Jacobsen, V., and
R.Scheffenegger (2014). RFC 7323,
TCP Extensions for High Performance.
https://tools.ietf.org/html/rfc7323.
CoreOS (2015). Flannel. https://github.com/coreos/flannel.
Docker Inc. (2015). Docker. https://www.docker.com.
Fielding, R. T. (2000). Architectural Styles and the Design
of Network-based Software Architectures. PhD thesis.
Hindman, B., Konwinski, A., Zaharia, M., Ghodsi, A.,
Joseph, A. D., Katz, R. H., Shenker, S., and Stoica, I.
(2011). Mesos: A platform for fine-grained resource
sharing in the data center. In NSDI, volume 11.
HP Labs (2008). httperf - A tool for
measuring web server performance.
http://www.hpl.hp.com/research/linux/httperf/.
Kratzke, N. (2014). Lightweight virtualization cluster -
howto overcome cloud vendor lock-in. Journal of
Computer and Communication (JCC), 2(12).
Kratzke, N. and Quint, P.-C. (2015a). About Automatic
Benchmarking of IaaS Cloud Service Providers for a
World of Container Clusters. Journal of Cloud Com-
puting Research, 1(1):16–34.
Kratzke, N. and Quint, P.-C. (2015b). How to operate con-
tainer clusters more efficiently? International Journal
On Advances in Networks and Services, 8(3&4):203–
214.
netperf.org (2012). The Public Netperf Homepage.
http://www.netperf.org.
Newman, S. (2015). Building Microservices. O’Reilly Me-
dia, Incorporated.
R Core Team (2014). R: A Language and Environment for
Statistical Computing. R Foundation for Statistical
Computing, Vienna, Austria.
Satzger, B., Hummer, W., Inzinger, C., Leitner, P., and
Dustdar, S. (2013). Winds of change: From vendor
lock-in to the meta cloud. IEEE Internet Computing,
17(1):69–73.
Schmid, H. and Huber, A. (2014). Measuring a Small Num-
ber of Samples, and the 3v Fallacy: Shedding Light on
Confidence and Error Intervals. Solid-State Circuits
Magazine, IEEE, 6(2):52–58.
Sun Microsystems (2012). uperf - A network performance
tool. http://www.uperf.org.
Talukder, A., Zimmerman, L., and A, P. (2010). Cloud eco-
nomics: Principles, costs, and benefits. In Antonopou-
los, N. and Gillam, L., editors, Cloud Comput-
ing, Computer Communications and Networks, pages
343–360. Springer London.
Velásquez, K. and Gamess, E. (2009). A Comparative Anal-
ysis of Network Benchmarking Tools. Proceedings
of the World Congress on Engineering and Computer
Science 2009 Vol I.
Verma, A., Pedrosa, L., Korupolu, M. R., Oppenheimer, D.,
Tune, E., and Wilkes, J. (2015). Large-scale cluster
management at Google with Borg. In Proceedings of
the European Conference on Computer Systems (Eu-
roSys), Bordeaux, France.
Weave Works (2015). Weave.
https://github.com/weaveworks/weave.
ppbench - A Visualizing Network Benchmark for Microservices
231
