
Using Differential Evolution to Improve Pheromone-based
Coordination of Swarms of Drones for Collaborative Target
Detection
Mario G. C. A. Cimino, Alessandro Lazzeri and Gigliola Vaglini
Department of Information Engineering, Università di Pisa, Largo Lazzarino 1, Pisa, Italy
Keywords: Differential Evolution, Parametric Adaptation, Collaborative Target Detection, Marker-based Stigmergy,
Swarm Intelligence.
Abstract: In this paper we propose a novel algorithm for adaptive coordination of drones, which performs
collaborative target detection in unstructured environments. Coordination is based on digital pheromones
released by drones when detecting targets, and maintained in a virtual environment. Adaptation is based on
the Differential Evolution (DE) and involves the parametric behaviour of both drones and environment.
More precisely, attractive/repulsive pheromones allow indirect communication between drones in a flock,
concerning the availability/unavailability of recently found targets. The algorithm is effective if structural
parameters are properly tuned. For this purpose DE combines different parametric solutions to increase the
swarm performance. We focus first on the study of the principal parameters of the DE, i.e., the crossover
rate and the differential weight. Then, we compare the performance of our algorithm with three different
strategies on six simulated scenarios. Experimental results show the effectiveness of the approach.
1 INTRODUCTION AND
MOTIVATION
The Differential Evolution algorithm (DE) is a
stochastic population based algorithm, very suited
for numerical and multi-modal optimization
problems. Recently, DE has been applied in many
research and application areas. Compared with other
population-based algorithms, such as genetic
algorithm and particle swarm optimization, DE
exhibits excellent performance both in unimodal,
multimodal, separable, and non-separable problems.
Moreover, it is much simpler to use because it has
only three parameters (Das, 2011): the population N,
the differential weight F, and the crossover rate CR.
When managing the DE algorithm, the main effort is
to properly set the parameters in order to avoid
premature convergence towards a non-optimal
solution. As reported by literature, there is no
dominant setting, and for each problem a proper
study of the behaviour of DE is needed to find the
correct parameterization.
In this paper, we adopt DE algorithm to optimize
the behaviour of a swarm of aerial drones carrying
out collaborative target detection (Cimino, 2015b).
In our approach, stigmergy and flocking are
exploited to enable self-coordination in the
navigation of unstructured environments. Such
environments typically contain a number of
obstacles such as trees and buildings. Targets are
placed according to different patterns. More
specifically, stigmergy implies the use of an
attractive digital pheromone to locally coordinate
drones. When a drone detects a new piece of target,
it releases the attractive pheromone. Other drones in
the neighbourhood can sense and follow the
pheromone gradient to cooperate in detecting the
pattern of targets. With respect to (Cimino, 2015b)
in this study we sensibly improve the performance
of the algorithm, by adopting the parametric DE-
based adaptation, by introducing repulsive
pheromone and scattering mechanisms. Basically,
flocking implies a set of three behavioural rules,
named separate, align, and scatter. It maintains the
drones in groups enhancing the stigmergy when
occurring. In contrast, the repulsive pheromone
helps the drones to avoid multiple exploration of the
same zone. Indeed, the drone releases a repulsive
pheromone whereas it does not sense a target.
Finally, the scattering rule makes a drone to turn
Cimino, M., Lazzeri, A. and Vaglini, G.
Using Differential Evolution to Improve Pheromone-based Coordination of Swarms of Drones for Collaborative Target Detection.
DOI: 10.5220/0005732606050610
In Proceedings of the 5th International Conference on Pattern Recognition Applications and Methods (ICPRAM 2016), pages 605-610
ISBN: 978-989-758-173-1
Copyright
c
2016 by SCITEPRESS – Science and Technology Publications, Lda. All rights reserved
605

by an angle when it tails another drone.
In the literature there are two design methods to
develop collective behaviours in swarm systems:
behaviour-based design and automatic design
(Brambilla, 2013). The former implies the
developers to implement, study, and improve the
behaviour of each single individual until the desired
collective behaviour is achieved. This is the
approach adopted in (Cimino, 2015b). The latter is
usually used to reduce the effort of the developers.
Automatic design methods can be furtherly divided
in two categories: reinforcement learning and
evolutionary robotics (Brambilla, 2013). The first
implies a definition at the individual level of positive
and repulsive reinforce to give reward to the
individual. In general, it is usually hard for the
developer to decompose the collective output of the
swarm in individual rewards. Evolutionary robotics
implies evolutionary techniques inspired by the
Darwinian principle of selection and evolution.
Generally in these methods each swarm consists of
individuals with the same behaviour. A population
of swarms is then computed, where each population
member has a particular behaviour. A simulation is
made for each member and a fitness function is
computed. Then through a mutation and crossover
procedure a new generation is computed. This
process iteratively repeats improving the
performance of the swarm population.
2 RELATED WORK
DE has been used in several domains for
optimization and parameterization tasks (Das, 2011).
As an example, in (Nikolos, 2005) the authors used a
classical DE variant, namely DE/1/rand/bin, to
coordinate multiple drones navigating from a known
initial position to a predetermined target location.
Here, DE is set up with N=50, F=1.05 and CR=0.85.
The algorithm was defined to terminate in 200
generations, but it usually converges in 30 iterations.
Our problem sensibly differs, because the target
position is unknown, and our approach is
independent of the initial position.
In (Chakraborty, 2008) the authors confront DE
and Particle Swarm Optimization (PSO) for co-
operative distributed multi-robot path planning
problem. As for (Nikolos and Brintaki, 2005) initial
position of the robots and final position are known.
Here, both centralized and decentralized
formulations are proposed. In the centralized
approach, DE minimizes the distance for the next
step of each robot. In this case all information of the
position of each robot, the next position, and the
possible collision are provided to DE. In the
decentralized formulation, each robot runs DE for
itself considering the information of neighbour
robots. Authors conclude that the decentralized
approach needs less time in comparison to the
centralized one; moreover the performance is
comparable to PSO. In our approach, we consider to
use DE offline to find a proper and general purpose
parameter tuning for the swarms. Moreover, in our
formulation drones have a limited computing
capability, and then an online execution of DE is not
feasible.
In (Cruz-Alvarez, 2013) DE/1/rand/bin is used
with F=0.7, CR=1.0, N=120 for 250 generations, and
another variant called DE/1/best/bin is used with
F=0.8, CR=1.0, N=150 for 200 generations to tune
the behaviour of a robot in wall-following task. Here
it seems that DE/1/best/bin is able to find a slightly
better solution than DE/1/rand/bin. However,
authors used different parameters settings (F, N and
number of generations) for each variant, thus a
comparative analysis is difficult. In our approach we
focus on DE/1/rand/bin variant and evaluate several
combinations of CR and F.
3 SWARM BEHAVIORAL MODEL
In this section we improve the swarm algorithm of
(Cimino, 2015b). We refer to the time unit as a tick,
i.e., an update cycle of both the environment and the
drones. Each drone is equipped with: (a) wireless
communication device for sending and receiving
information from a ground station; (b) self-location
capability, e.g. based on global position system
(GPS); (c) a sensor to detect a target in proximity of
the drone; (d) processor with limited computing
capability; (e) a sensor to detect obstacles.
The environment and the pheromone dynamics
We consider a predefined area that contains a set
of targets to be identified. The environment is
modelled by a digital grid corresponding to the
physical area. The grid has C
2
cells, each identified
by (x, y) coordinates with x, y ∈ {1,…,C}. The
actual size of the area and the granulation of the grid
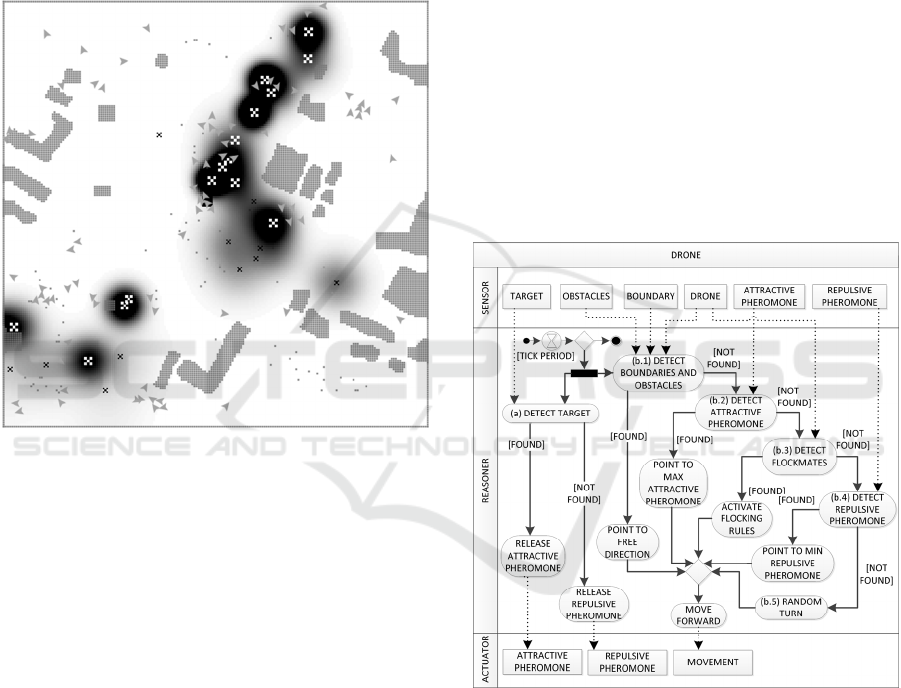
depend on the domain application. Figure 1 shows
Pheromone dynamics in an urban scenario. Here, the
intensity of the pheromone is represented as a dark
colour, and each target is represented by an “X”. A
darker gradation means higher pheromone intensity.
At the beginning, the pheromone is in one cell at its
maximum intensity, and then it diffuses to
ICPRAM 2016 - International Conference on Pattern Recognition Applications and Methods
606
neighbouring cells. After a certain time the
pheromone evaporates, disappearing from the
environment. When a drone detects a piece of the
overall target, a pheromone of intensity I is released
in the cell corresponding to the drone location. Then,
at each tick the pheromone diffuses to the
neighbouring cells according to a diffusion rate
[0,1]
δ
∈
. At the same time the pheromone
evaporates decreasing its intensity, by an
evaporation rate
[0,1]
ε
∈
.
Figure 1: Pheromone dynamics in an urban scenario.
The drone behaviour
The drone behaviour is structured into five-layer
logic, where each layer has an increasing level of
priority. Starting from the lowest: the random fly
behaviour entails the exploration in absence of
stimuli/information; the repulsive pheromone-based
coordination reduces the redundancy of exploration;
the flocking behaviour assembles the flock enabling
local pheromone interactions; the positive
pheromone-based coordination exploits the digital
pheromone and directs the swarm toward potential
new targets; finally the highest priority level, the
objects/boundary avoidance, which prevents the
drone from exiting the area or colliding with
obstacles and other drones.
Fig. 2 shows a UML activity diagram of the
drone behaviour. Here, a rectangular box represents
sensors (left) and actuators (right), a rounded-corner
box represents an activity (a procedure), solid and
dashed arrows represent control and data flows,
respectively.
Every tick period, represented by the hourglass,
the drone performs two parallel processes: (a) the
target detection, which corresponds to the release of
the attractive pheromone on the digital grid or rather
of the repulsive pheromone; (b) the movement
procedure, which starts with the obstacle and
boundary detection. If a close obstacle (i.e., object or
drone) is detected (b.1), the drone points toward a
free direction. If a free direction is found, it moves
forward, otherwise it stays still. If there are no close
objects detected (b.2), the drone tries to sense
positive pheromone in its neighbouring cells and, if
detected, the drone points toward the maximum
intensity of it. Differently, if no pheromone is
detected (b.3), the drone tries to detect surrounding
drones in order to stay with the flock. Then, the
drone checks if a repulsive pheromone is in nearby
cells (b.4). If there is, the drone moves toward the
minimum intensity of it. Finally, if there are no
surrounding drones (b.5), it performs a random turn
and move forward.
Figure 2: Overall representation of the drone behaviour.
At the highest priority (b.1), the drone has to
avoid collision and to exit the search area. For this
purpose the drone is able to detect objects (i.e., other
drones or obstacle) at the object sensing distance (
ο
)
on its trajectory. If a potential collision is detected
the drone chooses the minimum rotation angle to the
left or right to avoid the obstacle. If it finds a free
trajectory it moves forward, if there is no free
direction within 180 degree it stays still one tick.
The boundaries of the area are considered as a
“wall” of obstacles.
Using Differential Evolution to Improve Pheromone-based Coordination of Swarms of Drones for Collaborative Target Detection
607

The second priority is to follow the positive
pheromone gradient (b.2), provided by the ground
station. Given the drone position (i.e., the cell on the
grid), the cell with the maximum intensity of
positive pheromone and the minimum intensity of
the repulsive pheromone (b.4) in its 8 neighbouring
cells is returned to the drone. Then, the drone
follows the maximum pheromone intensity.
The flocking behaviour (b.3) consists in three
rules, represented by Fig.3. A drone considers as
flock mates all drones in a flock visibility radius (
ρ
).
The first rule is the separation: more specifically, if
the drone senses another drone closer than the flock
mobility distance (
μ
), it turns away by a flock
separation angle (
σ
). The second rule is the
alignment: the drone computes the average direction
of its flock mates and it adapts its direction by a
flock alignment angle (
α
). The third rule is the
scatter: the follower drone considers the closer
following drone in front of itself. If the follower is in
the tail sector of the following defined by angle flock
tail angle (
γ
) the follower turns away the following
by a flock scatter angle (τ). These three rules
determine the structure of the swarm, permitting the
drones to navigate in coordinated group, exploring
the environment and, most important, sensing
pheromone released by flock mates.
The fourth priority (b.4) is to move against the
repulsive pheromone gradient. The drone received
the information of the lowest cell from the ground
station (b.2). Finally, if nothing is detected (b.5) then
the drone is in its basic behaviour (random fly). It
randomly turns by an angle smaller than the
maximum rand-fly turn angle (
θ
).
(a) separation
(b) alignment (c) scattering
Figure 3: Flock visibility radius and other parameters in
flocking behaviour.
4 ADAPTATION WITH
DIFFERENTIAL EVOLUTION
The swarm algorithm presented in Section 3
involves a number of structural parameters to be
appropriately set for each given application scenario.
Determining such correct parameters is not a simple
task since different areas have different topology and
different targets distribution. In DE algorithm, a
population member is a real n-dimensional vector,
where n is the number of parameters to tune. DE
starts with a population of N members, injected or
randomly generated. In the literature, the population
size spreads from a minimum of 2n to a maximum
of 40n (Mallipeddi, 2011). A large population
increases the chance of finding an optimal solution
but it is very time consuming. To balance speed and
reliability we use N=20. At each iteration, and for
each population member (target), a mutant vector is
created by mutation of selected members and then a
trial vector is created by crossover of mutant and
target. Finally, the best fitting among trial and target
replaces the target.
In addition to DE, other classes of optimization
methods, such as Particle Swarm Optimization
(PSO) attracted attention in the last decade. The
interested reader is referred to (Cimino, 2015a) for
further details. Several DE strategies have been
designed, by combining different structure and
parameterization of mutation and crossover
operators (Mezura, 2006 and Zaharie, 2007). As
noted by (Das, 2011), practitioners mostly prefer to
use a classical DE variant like DE/1/rand/bin. The
differential weight F ϵ [0,2] mediates the generation
of the mutant vector. F is usually set in [0.4-1), and
a frequently used starting value is 0.8 (Mezura,
2006). There are different crossover methods in DE.
A competitive approach is the binomial crossover
(Zaharie, 2007). With binomial crossover, a
component of a vector is taken with probability CR
from the mutant vector and with probability 1-CR
from the target vector. A good value for CR is
between 0.3 and 0.9, and a frequently used starting
value is 0.7 (Mallipeddi, 2011).
The fitness measure to evaluate the effectiveness
of a solution is the average time (in ticks), over 5
runs, which the swarm of drones take to find 95% of
the targets of the scenario.
5 EXPERIMENTAL RESULTS
We implemented our algorithm using NetLogo, a
leading simulation platform for swarm intelligence
(ccl.northwestern.edu/netlogo), and MATLAB for the
adaptation algorithm (www.mathworks.com). We
evaluated our algorithm by comparing four different
strategies: the adaptive stigmergic and flocking
behaviour (S+F*) presented in Section 3; the
stigmergic and flocking behaviour (S+F) presented
in (Cimino, 2015b); the stigmergic behaviour (S), in
which the pheromone grid maintains only the
ICPRAM 2016 - International Conference on Pattern Recognition Applications and Methods
608
positive pheromone intensity information and the
drones do not perform flocking behaviour; finally,
the random fly behaviour (R), in which drones
randomly explore the area with no pheromone nor
flocking behaviour. We tested the swarm algorithm
on six different scenarios. For each scenario, each of
the three strategies has been specifically optimized
by the adaptation module. To compare the
approaches, 10 trials have been carried out for each
considered approach. We also determined that the
resulting performance indicator samples are well-
modelled by a normal distribution, using a graphical
normality test. Hence, we calculated the 95%
confidence intervals.
The total number of drones is 80; each drone is
represented as a black triangle, arranged in 4 swarms
placed in the corners of the map, except for Illegal
Dumps in which 3 swarms are placed in 3 corners
due to the topology. Characteristics of the topology
of targets and obstacles are summarised in Table 2.
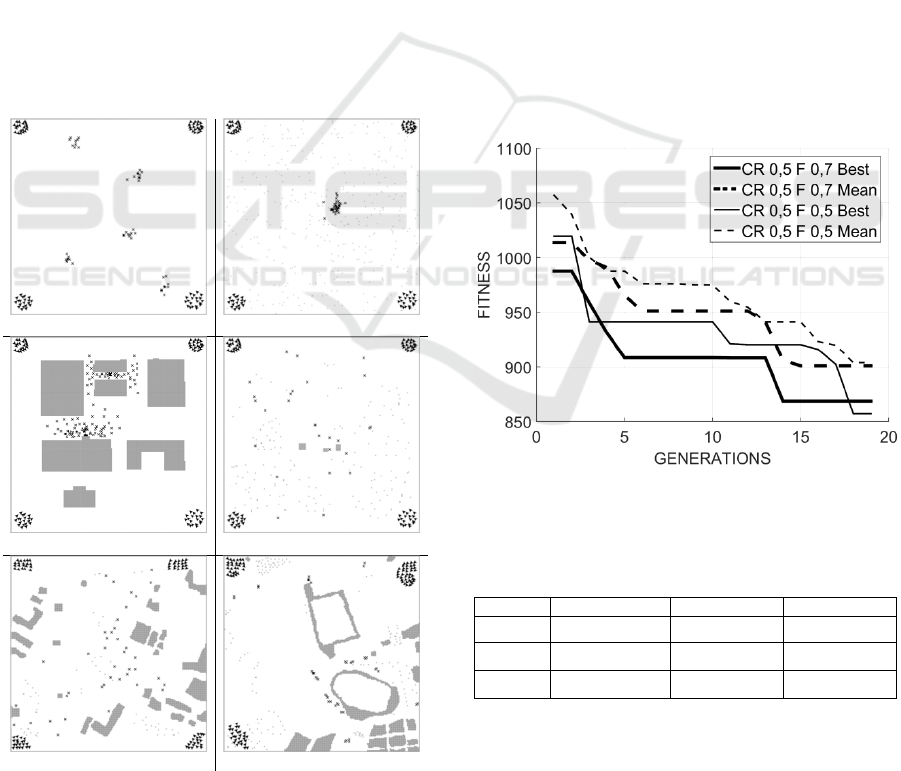
Figure 4 represents the initial configuration for
all scenarios. The three scenarios Field, Forest, and
Urban represent respectively an area of 40,000 m
2
.
(a) Field
(b) Forest
(c) Urban (d) Rural minefield
(e) Urban minefield (f) Illegal dumps
Figure 4: Maps of 3 synthetic and 3 real-world scenarios.
Figure 4 (a) does not contain obstacles at all, but
contains 5 clusters of 10 targets each. Figure 4 (b)
represents a timber with 1 cluster of 20 targets with
tree obstacles. Figure 4 (c) shows an industrial area
with 2 clusters of 55 targets, each representing a
pollutant lost. The two scenarios Rural minefield and
Urban minefield, represented in Figure 4 (d) and
Figure 4 (e), respectively, are two mined areas of
80,000 m
2
derived from real-world maps near
Sarajevo, in Bosnia-Herzegovina (www.see-
demining.org). The last scenario, Illegal Dump, is a
real-world example of illegal dumping taken from an
area of 80,000 m
2
near the town of Paternò, Italy
(www.trashout.me).
Figure 5 shows the evolutions of DE algorithm
against generations, with two different values of CR
and F. Here, the best and the mean solution (solid
and dashed line, respectively) have been calculated
over 5 runs. The optimization is characterized by a
very good improvement of the initial solution and by
a fast convergence: only 20 generations are needed
to reduce the average time by 20%. More precisely,
Table 1 shows that the final best performance is
achieved with CR=0.5 and F=0.7.
Figure 5: Evolution of the DE algorithm against
generations for different DE parameters.
Table 1: Final results of the evolution of Figure 5 in
numerical terms.
F\CR 0.3 0.5 0.7
0.5
933,67±14,16 903,85±29,77 950,80±16,36
0.7
966,60±15,53
900,65±19,06
907,15±12,96
0.9
951,40±15,67 930,60±22,36 933,73±54,14
Table 2 characterizes each scenario with the
results, in the form “mean ± confidence interval”. It
is worth noting that the proposed adaptive algorithm
“S+F*” outperforms the algorithms presented in
(Cimino, 2015b) in all scenarios. More specifically,
Using Differential Evolution to Improve Pheromone-based Coordination of Swarms of Drones for Collaborative Target Detection
609

in Field and Forest scenarios, the two algorithms
“S+F” and “S+F*” are comparable. This is due to
the simple layout of both scenarios, which does not
allow a good exploitation of the “S+F*” features.
Indeed, in the other scenarios, with a more complex
topology, the advantages of the “S+F*” strategy are
substantial.
Table 2: Features and numerical results of each scenario.
Scenario
N° of targets /
clusters
Type / n° of
obstacles
Completion time
(ticks)
Field 50 / 5
Trees: 0
Buildings: 0
R 1664±220
S 656±101
S+F 589±86
S+F*
582±121
Forest 20 / 1
Trees: 400
Buildings: 0
R 1862±356
S 615±67
S+F 602±124
S+F*
593±146
Urban 110 / 2
Trees: 0
Buildings: 7
R 2049±148
S 998±61
S+F 890±93
S+F*
666±100
Rural
Mines
28 / 28
Trees: 281
Buildings: 3
R 1588±216
S 1570±158
S+F
1530±225
S+F* 1123±116
Urban
Mines
40 / 40
Trees: 54
Buildings: 28
R 1844±140
S 1733±169
S+F
1704±225
S+F* 1025±76
Illegal
Dumps
42 / 11
Trees: 140
Buildings:19
R 1548±207
S 971±160
S+F 934±216
S+F*
757±112
6 CONCLUSIONS
In this paper, we have presented an algorithm to
adapt, via the DE algorithm, the coordination of a
swarm of drones performing target detection on the
basis of stigmergy and flocking. We first evaluated
several combinations of the structural parameters of
the DE. Results show that a crossover rate (CR) of
0.5 and a differential weight (F) of 0.7 produce
better solutions. Then, to test the effectiveness and
the reliability of the approach, we compared our
algorithm with three search strategies over real-
world and synthetic scenarios. As a result, our
approach resulted dominant in all scenarios. Future
work will (i) investigate our approach on additional
scenarios, (ii) use other optimization methods for the
adaptation, and (iii) include non-functional
requirements in the algorithm, such as computing
power and endurance of drones.
ACKNOWLEDGEMENTS
This work is partially supported by the Tuscany
Region, Italy, via the SCIADRO research project.
REFERENCES
Brambilla, M. Ferrante, E. Birattari & M. Dorigo, M.,
2013, ‘Swarm robotics: a review from the swarm
engineering perspective,’ Swarm Intelligence, vol. 7,
pp. 1-41.
Chakraborty, J., Konar, A., Chakraborty, U. K. & Jain, L.
C., 2008, ‘Distributed cooperative multi-robot path
planning using differential evolution’, in IEEE
Evolutionary Computation, World Congress on
Computational Intelligence, pp. 718-725.
Cimino, M.G.C.A., Lazzeri, A. & Vaglini, G., 2015a,
‘Improving the analysis of context-aware information
via marker-based stigmergy and differential
evolution’, Proceeding of the international
Conference on Artificial Intelligence and Soft
Computing (ICAISC 2015), in Springer LNAI,
Vol. 9120, Part II, pp. 1-12, 2015.
Cimino, M.G.C.A., Lazzeri, A. & Vaglini, G., 2015b,
‘Combining stigmergic and flocking behaviors to
coordinate swarms of drones performing target
search’, Proceedings of the 6
th
International
Conference on Information, Intelligence, Systems and
Application (IISA 2015), Springer, in press.
Cruz-Álvarez, V. R., Montes-Gonzalez, F., Mezura-
Montes, E. & Santos, J., 2013, ‘Robotic behavior
implementation using two different differential
evolution variants’, in Advances in Artificial
Intelligence, Springer Berlin Heidelberg, pp. 216-226.
Mallipeddi, R., Suganthan, P.N., Pan, Q.K. & Tasgetiren,
M.F., 2011, ‘Differential evolution algorithm with
ensemble of parameters and mutation strategies’, in
Applied Soft Computing, vol. 11, no. 2, pp.1679-1696.
Mezura-Montes, E., Velázquez-Reyes, J. & Coello, C.A.,
2006, ‘A comparative study of differential evolution
variants for global optimization,’ Proceedings of the
8th Annual Conference on Genetic and evolutionary
computation, ACM, pp.485-482.
Nikolos, I. K. & Brintaki, A. N., 2005, ‘Coordinated UAV
path planning using differential evolution’, in
Intelligent Control, in IEEE Proceedings of the 2005
International Symposium on Control and Automation,
pp. 549-556.
Das, S. and Suganthan, P. N., 2011, ‘Differential
evolution: a survey of the state-of-the-art’, in IEEE
Transactions on Evolutionary Computation, Vol. 15.1,
pp. 4-31.
Zaharie, D., 2007, ‘A comparative analysis of crossover
variants in differential evolution’, in Proceedings of
IMCSIT, 2nd International Symposium Advances in
Artificial Intelligence and Applications, pp. 171-181.
ICPRAM 2016 - International Conference on Pattern Recognition Applications and Methods
610
