
An Interbank Market Network Model based on Bank Credit Lending
Preference
Tao Xu, Jianmin He and Shouwei Li
School of Economics & Management, Southeast University, Southeast University Road, Jiangning District, Nanjing, China
Keywords: Complex Network, Interbank Market, Network Structure, Credit Lending Preference.
Abstract: An interbank market network model based on bank credit lending preference is built in this paper to explain
the formation mechanism of interbank market network structure. As well, we analyze the impact of credit
lending risk preference on network topology structure, which includes degree distribution, network
clustering coefficient, average shortest path length and network efficiency. Simulation results demonstrate
that the accumulation degree follows dual power law distribution with credit lending risk preference
parameter value equal or greater than 1, while the accumulation degree follows power law distribution with
credit lending risk preference parameter value smaller than 1. The interbank market network shows small
world topology property. With the increasing of bank credit lending risk preference, the average shortest
path length decreases but network efficiency improves, which enhances the stability of the network.
1 INTRODUCTION
In the banking system, complex network
relationships are formed through interbank lending,
payment and settlement, discount and guarantee.
The interbank market allows liquidity exchanges
among financial institutions through facilitating the
allocation of the liquidity surplus to illiquid banks,
but also provide channel for risk contagion, which
might trigger a domino effect. The subprime crisis
broke out in the US financial market in August
2007, which quickly evolved into global financial
crisis, resulting in a large number of bank failures
and great damaged to the stability of the financial
system.
Complex network theory is an important tool for
complex systems modelling, and has been applied to
statistical physics, life sciences, social sciences and
many other fields. Random network (Burda et al.,
2004), small-world networks (Watts and Strogatz,
1998; Newman and Watts, 1999) and scale-free
networks (Barabási and Albert, 1999) are common
complex network topologies. In the economic
system, the complex network theory has been used
for modelling in the fields of e-commerce (Reichardt
and Bornholdt, 2005), network transactions
(Garlaschelli and Loffredo, 2004), the stock market
(Boginski et al., 2005; Bonanno et al., 2004; Huang
et al., 2009) and other areas of modelling. The
interbank market exhibits high degree of complexity,
with different network structures, such as money
centre structure (Freixas et al.
, 2000), complete
market and incomplete market (Allen and Gale,
2000), etc.
There have been lager number of empirical
research literature on interbank market network
structure topology, such as degree distribution,
average path length of the network, clustering
coefficient, etc. Souma et al. (2003) modelled
Japanese business network and found scale-free
property through empirical results. Boss et al. (2004)
analyzed Austrian interbank market and found that
the degree distributions followed power law
distribution, interbank liability network showed a
community structure, a low clustering coefficient
and a short average path length. Iori et al. (2008)
found the structure of Italian interbank market was
fairly random and changed with time. Iori et al.
(2007) showed that the Italian interbank consists of
two communities, one mainly composed by large
and foreign banks, the other composed by small
banks. Cajueiro and Tabak (2008) found that the
Brazilian interbank network structure had a weak
community structure and high heterogeneity. Tabak
et al. (2009) built Brazilian interbank market with
minimum spanning tree method and showed that the
private and foreign banks tended to form clusters
within the network and that banks with different
Xu, T., He, J. and Li, S.
An Interbank Market Network Model based on Bank Credit Lending Preference.
DOI: 10.5220/0005734201570162
In Proceedings of 5th the International Conference on Operations Research and Enterprise Systems (ICORES 2016), pages 157-162
ISBN: 978-989-758-171-7
Copyright
c
2016 by SCITEPRESS – Science and Technology Publications, Lda. All rights reserved
157

sizes were also strongly connected and tended to
form clusters.
In recent years, researchers began to explore the
interbank market network structure formation
mechanism. Inaoka et al. (2004) presented a
procedure to extract a network structure described
by a power-law degree distribution from a set of
records of transactions. Li et al. (2010) introduced a
network model of an interbank market based on
interbank credit lending relationships and found
some typical structural features such as a low
clustering coefficient and a relatively short average
path length, community structures, and a two-power-
law distribution of out-degree and in-degree.
In summary, the present simulation methods for
constructing an interbank market can be divided into
the following categories: (1) Establishing an
interbank market network by setting a fixed link
probability; (2) By setting a linking threshold, credit
links are created if the given threshold is exceeded;
(3) By assuming that the interbank network of a
particular network architecture (such as scale-free
networks, dual power rate networks, small-world
networks, etc.). From the above analysis, we can see
that the current model construction methods have
not taken bank behaviours such as assets and
liabilities into consideration. But empirical results
demonstrate that the formation of credit lending
links between banks is related to the banks
behaviours. Banks with different credit lending
scales are strongly connected and tend to form
clusters (Tabak et al., 2009). In this paper, an
interbank credit lending network model is
constructed through designing a probability
associated with bank lending scale and risk
preference. Then, we analyze the topology property
of network and the influence of risk preference on
network structure.
The remainder of this paper is organized as
followed. The model is presented in part 2,
simulation analysis is shown in part 3, and finally
conclusions are conducted in part 4.
2 THE MODEL
In this paper, a directed graph ),( EVG is used to
denote interbank market network, where the vertex
set
V represents the set of all banks and the set
E
is
a collection of edges which represent the interbank
credit lending relationships. A directed edge
ji
e
,
exists between nodes Vji , , if and only if
bank
i is the creditor bank of bank j . Assuming
that the total bank number
NV || , and
i
N denotes
the set composed by neighbours of bank
i . l
represents the total interbank lending scales, and
i
l
is the lending scale of bank
i , satisfying
i
ll
.
Based on the empirical results (Boss et al.,
2004), it is assumed that bank credit lending scale
follows power-law distribution:
llP ~)(
, where
is power law parameters. So, the interbank market
network we build is composed by a large number of
small banks and a few large banks. The specific
process to construct the interbank market network is
listed as follows:
1) Initialization: Generating the total number of
N banks and lending scales followed by
power-law distribution.
2) The construction process of interbank credit
lending relationships: The connection
probability
ij
p of bank i )1( Ni
and bank j
),1( ijNj
depends on their lending
scales:
))2//(exp(1
ijjiij
llllp
,
where
denotes bank credit lending risk
preference coefficient, where
),0[
.
The interbank relationship connection probability
]1,0())2//(exp(1
ijjiij
llllp
, as the
inequality
2//2//
ijjiijji
llllllll
and
0
. The probability gets the minimum when
ji
ll
and gets the maximum when
ji
ll or
ji
ll
. Obviously, the connection probability
ij
p
increases monotonically with parameter
.
3 SIMULATION RESULTS
In this paper, the parameters are initialized as
follows: The total bank number
200N , the
power-law parameter
87.1
(Boss et al., 2004),
and the bank credit risk preference coefficient
01.0
, 1.0
, 1
, 10
and
100
,
respectively.
The interbank market structure calculated by the
model with
01.0
is given in Figure 1, in which
nodes denote banks and edges represents credit
lending links between banks. It can be found from
figure 1 that the banks which have large credit
lending scales get bigger degree than those with
small ones. This is because the number of banks
with large credit lending scales is much smaller than
those with small ones and the credit lending scales
ICORES 2016 - 5th International Conference on Operations Research and Enterprise Systems
158
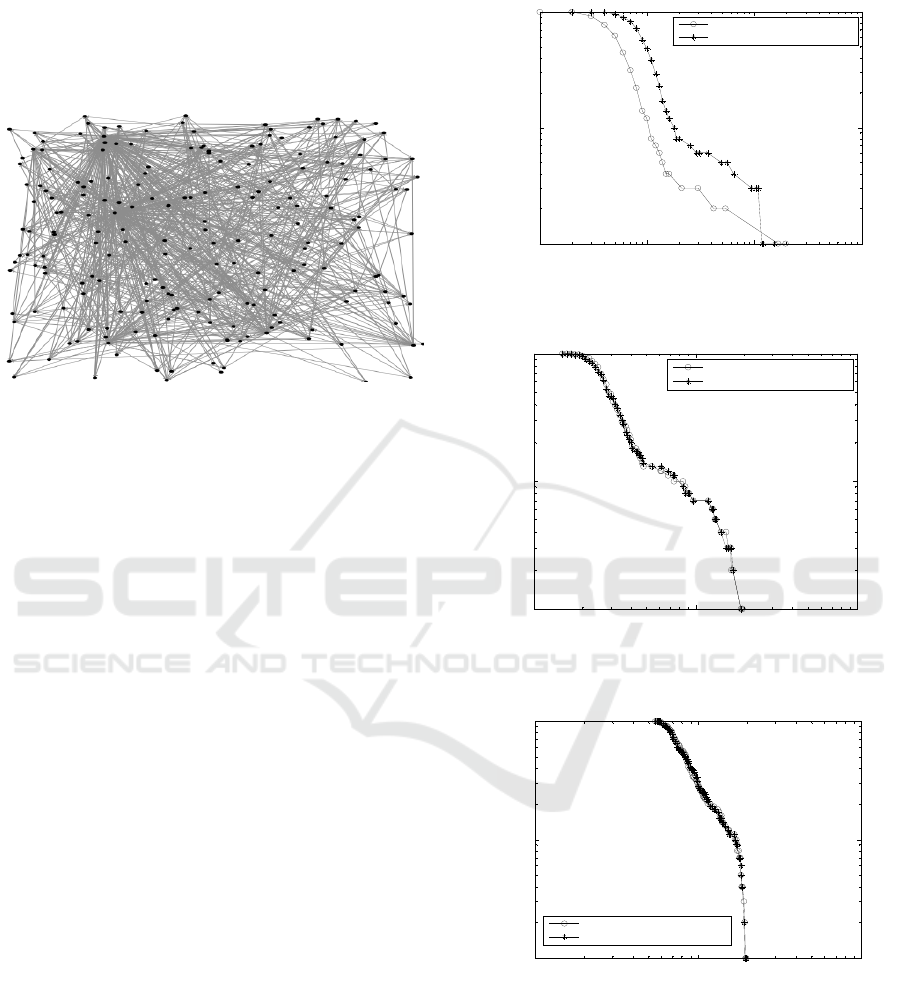
of banks are generated by power-law distribution.
From the model, it can be known that banks with
different credit lending scales establish connections
more easily than those with the similar ones. So big
banks show large degree and small banks get small
degree.
Figure 1: An interbank market network structure.
3.1 Degree Distribution
In this paper, we let
i
d ,
in
i
d
,
out
i
d
denote the degree,
in-degree and out-degree of bank
i respectively,
out
i
in
ii
ddd
. The degree distribution
)(kp
is
defined as the proportion of the nodes with degree
equals
k in the network. Cumulative distribution
kk
cum
kpkP
'
)()(
'
, represents he proportion of the
nodes with degree no less than
k in the network.
Figure 2-1 to figure 2-5 is the simulation results of
cumulative distribution with bank credit lending
parameter
01.0
, 0.1, 1, 10, 100, respectively.
It can been found from figure 2-1 to figure 2-5
that the cumulative distribution of the constructed
interbank network follows power-law distribution
with
1
, but the cumulative distribution obeys to
dual power-law distribution with
1
, which
demonstrate that few number big banks which have
large credit lending scales own the majority
interbank credit lending business while the large
number small banks with small credit lending scales
have the minority interbank credit lending business.
With the increment of credit lending risk preference,
the maximum of in-degree and out-degree improves
simultaneously. The dual power-law distribution
obeyed by cumulative distribution through
simulation experiments are consistent with the
empirical findings in Austria and Japanese interbank
(Boss et al., 2004; Souma et al., 2003) when
1
.
As well, with
1
, the power-law distribution of
cumulative distribution is in accordance with
Inaoka’s empirical results (Inaoka et al., 2004).
10
0
10
1
10
2
10
3
10
-2
10
-1
10
0
Degree
Cumulative probability
In-degree cumulative probability
Out-degree cumulative probability
Figure 2-1: Cumulative distribution with
01.0
.
10
1
10
2
10
3
10
-2
10
-1
10
0
Degree
Cumulative probability
In-degree cumulative probability
Out-degree cumulative probability
Figure 2-2: Cumulative distribution with 1.0
.
10
1
10
2
10
3
10
-2
10
-1
10
0
Degree
Cumulative probability
In-degree cumulative probability
Out-degree cumulative probability
Figure 2-3: Cumulative distribution with
1
.
3.2 Network Clustering Coefficient
The clustering coefficient of a node is used to
measure the connected probability of two
neighbours of the node in an undirected graph. The
network clustering coefficient is the average of the
clustering coefficient of all nodes in the network.
An Interbank Market Network Model based on Bank Credit Lending Preference
159
10
2.11
10
2.15
10
2.19
10
2.23
10
2.27
10
-2
10
-1
10
0
Degree
Cumulative probability
In-degree cumulative probability
Out-degree cumulative probability
Figure 2-4: Cumulative distribution with 10
.
10
2.19
10
2.21
10
2.23
10
2.25
10
2.27
10
2.29
10
-2
10
-1
10
0
Degree
Cumulative probability
In-degree cumulative probability
Out-degree cumulative probability
Figure 2-5: Cumulative distribution with 100
.
We let
C denote network clustering coefficient, and
i
c represent the clustering coefficient of node i ,
thus
N
i
i
c
N
C
1
1
. From the definition of node
clustering coefficient, we can get
)1(
2
ii
i
i
dd
E
c
,
where
i
E represents the number of connected edges
between neighbours of node
i . The directed graph
should be transformed to be an undirected one
before computing network clustering coefficient,
since the clustering coefficient is defined in an
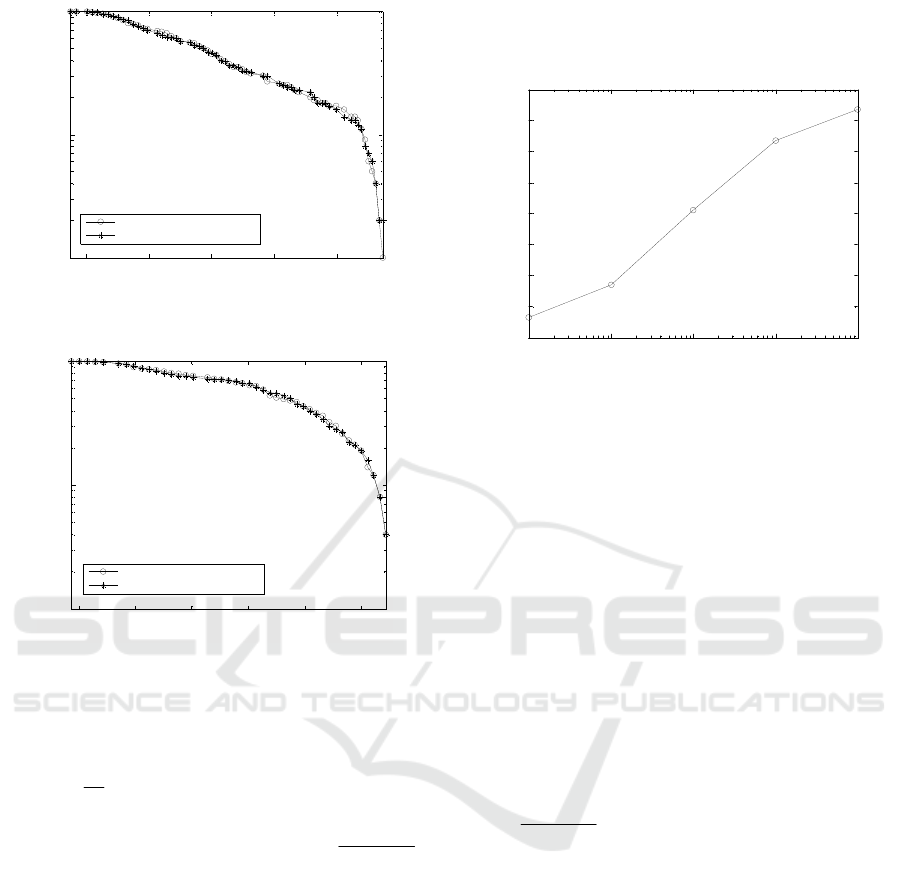
undirected graph. Figure 3 shows logarithmic plot of
network clustering coefficient relationship and bank
credit lending risk preference.
It can be known from figure 3 that the clustering
coefficient of interbank credit lending market
network monotonically increases with bank credit
lending risk preference. The explanation for this is
that the probability to build credit lending
relationships improves with the increment of bank
credit lending risk preference. From the definition of
network clustering coefficient , it is easy to
understand that network clustering coefficient
increases monotonously with the connection
probability.
10
-2
10
-1
10
0
10
1
10
2
0.2
0.3
0.4
0.5
0.6
0.7
0.8
0.9
1
C
Figure 3: Relation between network clustering coefficient
and
.
3.3 Average Shortest Path Length
The shortest path length between two nodes is used
to measure the distance of the two nodes. The
shortest path
ij
d
from node i to node j is defined
as a simple path starting from node
i , and sinking in
node
j , which has the shortest nodes number. The
shortest path length
ij
d
from node
i to node
j
is
the edge number of the shortest path. Obviously, in
an undirected graph, the shortest path length
ij
d
from node
i to node j equals he shortest path
length
ji
d
from node j to node i . The average
path length of the network can be calculated as
ji
ijG
d
NN
L
)1(
1
. To simplify the calculation
of the average shortest path length of the network,
the interbank market network is transformed into an
undirected graph. The relationships between the
average path length of the interbank market network
and bank credit lending preference is shown in
figure 4.
From figure 4, it can be found that the
constructed interbank market network is a small
world network with average path length less than 2.
The average path length decreases monotonously
with bank credit lending preference coefficient,
since the potential paths between any two nodes
increase with the growth of credit links number in
the network. The results of interbank markets
network structure in Mexico, USA and the Great
Britain (Martínez-Jaramillo et al., 2010; Soramäki et
al., 2007; Becher et al., 2008) also shows small
ICORES 2016 - 5th International Conference on Operations Research and Enterprise Systems
160

world property, which are the same as the finding of
this paper.
10
-2
10
-1
10
0
10
1
10
2
1
1.1
1.2
1.3
1.4
1.5
1.6
1.7
1.8
1.9
2
Average shortest path length
Figure 4: Relations between average path length and
.
3.4 Network Efficiency
Network efficiency is another approach to measure
the capacity of a network, and can be computed by
ji
ij
G
dNN
E
1
)1(
1
, where
ij
d is the shortest path
length from node
i to node j . From the definition
of network efficiency, we can conclude that network
efficiency can apply not only to describe a
connected graph but also represent a non-connected
graph connections. Similarly as calculating the
average shortest path length, the interbank market
network should also be transformed into an
undirected graph when computing network
efficiency. Simulation results are shown in figure 5.
It can be seen from figure 5 that network
efficiency increase monotonously from 0.55 to 0.97
with the increment of bank credit lending preference
and network efficiency approaching to 1 when
1
. The reason for this is that the connection
probability increases with the improvement of bank
credit lending preference, which results in more
interbank linkages in the interbank network. Then,
there will be more potential paths between any two
nodes as the addition of network edges and the
shortest path length of them may be shorter in the
meanwhile.
4 CONCLUSIONS
In this paper, an interbank market network is
constructed based on bank lending credit scales
followed by power-law distribution. Simulation
10
-2
10
-1
10
0
10
1
10
2
0.5
0.55
0.6
0.65
0.7
0.75
0.8
0.85
0.9
0.95
1
Network efficiency
Figure 5: Relations between network efficiency and
.
experiments demonstrates that interbank credit
lending market network has small world property
and follows power-law distribution with bank credit
lending risk preference parameter value smaller than
1, while follows dual power-law distribution with
the same parameter equal or greater than 1. With the
increment of bank credit lending preference, the
average shortest path length decreases and network
efficiency increases, which improves the capacity
and stability of the network.
The results of this paper have some policy
guidance. On one hand, when liquidity shortage
occurred in the interbank market, bank regulars can
adopt positive policies to guide banks to increase
credit lending risk preference for prospering
interbank market. On the other hand, when interbank
market exhibits excessive prosperity, bank
regulators should strengthen the interbank market
supervision, and guide banks to reduce risk
preferences in order to prevent potential systemic
risks.
ACKNOWLEDGEMENTS
This work is supported by the National Natural
Science Foundation of China (No. 71371051 and
71201023) and College Postgraduates Research
Innovation Program of Jiangsu Province
(KYZZ15_0067).
REFERENCES
Allen, F., & Gale, D., 2000. Financial contagion. Journal
of political economy, 108(1), 1-33.
Barabási, A. L., & Albert, R., 1999. Emergence of scaling
in random networks. Science, 286(5439), 509-512.
An Interbank Market Network Model based on Bank Credit Lending Preference
161

Becher, C., Millard, S., & Soramaki, K., 2008. The
network topology of CHAPS Sterling.
Boginski, V., Butenko, S., & Pardalos, P. M., 2005.
Statistical analysis of financial
networks. Computational statistics & data
analysis, 48(2), 431-443.
Bonanno, G., Caldarelli, G., Lillo, F., Miccichè, S.,
Vandewalle, N., & Mantegna, R. N., 2004. Networks
of equities in financial markets. The European
Physical Journal B-Condensed Matter and Complex
Systems, 38(2), 363-371.
Boss, M., Elsinger, H., Summer, M., & Thurner 4, S.,
2004. Network topology of the interbank
market. Quantitative Finance, 4(6), 677-684.
Burda, Z., Jurkiewicz, J., & Krzywicki, A., 2004.
Statistical mechanics of random graphs. Physica A:
Statistical Mechanics and its Applications, 344(1), 56-
61.
Cajueiro, D. O., & Tabak, B. M., 2008. The role of banks
in the Brazilian Interbank Market: Does bank type
matter?. Physica A: Statistical Mechanics and its
Applications, 387(27), 6825-6836.
Freixas, X., Parigi, B. M., & Rochet, J. C., 2000. Systemic
risk, interbank relations, and liquidity provision by the
central bank. Journal of money, credit and banking,
611-638.
Garlaschelli, D., & Loffredo, M. I., 2004. Fitness-
dependent topological properties of the world trade
web. Physical review letters, 93(18), 188701.
Huang, W. Q., Zhuang, X. T., & Yao, S., 2009. A network
analysis of the Chinese stock market. Physica A:
Statistical Mechanics and its Applications, 388(14),
2956-2964.
Inaoka, H., Takayasu, H., Shimizu, T., Ninomiya, T., &
Taniguchi, K., 2004. Self-similarity of banking
network. Physica A: Statistical Mechanics and its
Applications, 339(3), 621-634.
Iori, G., De Masi, G., Precup, O. V., Gabbi, G., &
Caldarelli, G., 2008. A network analysis of the Italian
overnight money market. Journal of Economic
Dynamics and Control, 32(1), 259-278.
Iori, G., Reno, R., De Masi, G., & Caldarelli, G., 2007.
Trading strategies in the Italian interbank
market. Physica A: Statistical Mechanics and its
Applications, 376, 467-479.
Li, S., He, J., & Zhuang, Y., 2010. A network model of the
interbank market.Physica A: Statistical Mechanics and
its Applications, 389(24), 5587-5593.
Martínez-Jaramillo, S., Pérez, O. P., Embriz, F. A., & Dey,
F. L. G., 2010. Systemic risk, financial contagion and
financial fragility. Journal of Economic Dynamics and
Control
, 34(11), 2358-2374.
Reichardt, J., & Bornholdt, S., 2005. Economic networks
and social communities in online-auction sites (No.
physics/0503138).
Soramäki, K., Bech, M. L., Arnold, J., Glass, R. J., &
Beyeler, W. E., 2007. The topology of interbank
payment flows. Physica A: Statistical Mechanics and
its Applications, 379(1), 317-333.
Souma, W., Fujiwara, Y., & Aoyama, H., 2003. Complex
networks and economics. Physica A: Statistical
Mechanics and its Applications, 324(1), 396-401.
Tabak, B. M., Cajueiro, D. O., & Serra, T. R., 2009.
Topological properties of bank networks: the case of
Brazil. International Journal of Modern Physics
C,20(08), 1121-1143.
Watts, D. J., & Strogatz, S. H., 1998. Collective dynamics
of ‘small-world’networks. Nature, 393(6684), 440-
442.
ICORES 2016 - 5th International Conference on Operations Research and Enterprise Systems
162
