
Tolerance to in-Band Crosstalk of Virtual Carrier-assisted Direct
Detection Multi-Band OFDM Systems
Bruno R. Pinheiro
1
, Jo
˜
ao L. Rebola
1,2
and Adolfo V. T. Cartaxo
1,3
1
Optical Communications and Photonics, Instituto de Telecomunicac¸
˜
oes, Lisboa, Portugal
2
Instituto Universit
´
ario de Lisboa (ISCTE-IUL), Lisboa, Portugal
3
Instituto Superior Tecnico, Universidade de Lisboa, Lisboa, Portugal
Keywords:
Direct Detection, in-Band Crosstalk, Monte-Carlo Simulation, Multi-Band Orthogonal Frequency Division
Multiplexing.
Abstract:
The tolerance to in-band crosstalk of virtual carrier (VC)-assisted direct detection (DD) multi-band orthogonal
frequency division multiplexing (MB-OFDM) system is assessed numerically through Monte-Carlo simulation
and considering a single interferer. The influence of the virtual carrier-to-band power ratio (VBPR) and the
virtual carrier-to-band gap (VBG) of the interferer on the in-band tolerance is also studied. We show that,
for interferers with the same VBG as the selected signal, the increase of the VBPR of the interferer leads to
lower optical signal-to-noise ratio (OSNR) penalties. The increase of the VBG of the interferer with central
frequency different from the selected signal also leads to lower OSNR penalties. When the central frequencies
of the interferer and selected bands are the same, the variation VBG of the interferer can lead to 11 dB less
tolerance to in-band crosstalk of the VC-assisted DD OFDM system.
1 INTRODUCTION
Metropolitan networks are responsible for the ag-
gregation of different types of traffic and to pro-
vide a link between access and back-bone networks.
Hence, these networks must present high flexibility,
enabling scalability, dynamic reconfigurability and
transparency (Alves, 2015). The virtual carrier (VC)-
assisted direct detection (DD) multi-band orthogonal
frequency-division multiplexing (MB-OFDM) net-
work, proposed in (Alves, 2014), has been appointed
as an efficient approach to provide such requirements
to metro networks (Alves, 2015). This approach is
called MORFEUS (Alves, 2014). The use of a VC
close to each OFDM band enhances the spectral effi-
ciency (SE) and allows the reduction of the required
receiver bandwidth (Peng, 2009).
An important limitation of DD OFDM systems is
the signal-to-signal beat interference (SSBI) caused
by photodetection. In this work, the SSBI mitiga-
tion technique presented in (Nezamalhosseini, 2013)
is implemented, in order to eliminate the SSBI at the
received OFDM signal. The use of the SSBI mitiga-
tion technique allows to reduce the band gap between
the VC and the OFDM band, and consequently, the
system SE is improved (Alves, 2014).
The metro networks performance can be impaired
by in-band crosstalk. The in-band crosstalk is the in-
terference between signals with same nominal wave-
length, and it is originated from the imperfect isola-
tion of the switching devices inside the optical nodes.
This imperfect isolation induces power leakage from
demultiplexed signals on the desired optical signal,
known as crosstalk signals (Winzer, 2011). In-band
crosstalk has been studied in the context of the con-
ventional DD OFDM systems (Rebola, 2014), where
the band gap between the VC and the OFDM band is
equal to the OFDM signal. However, the performance
of a VC-assisted DD OFDM system impaired by in-
band crosstalk is still to be assessed.
In this work, the tolerance to in-band crosstalk of
the VC-assisted DD MB-OFDM system is estimated
through Monte-Carlo (MC) simulation and using the
direct error counting (DEC) as bit error rate (BER) es-
timation method. The error vector magnitude (EVM)
is also used as performance estimation method. We
also evaluate the influence of the main parameters
of the interferer on the DD OFDM system perfor-
mance, such as the virtual carrier-to-band power ratio
(VBPR) and virtual carrier-to-band gap (VBG) using
the EVM and DEC methods, and the estimates are
compared.
Pinheiro, B., Rebola, J. and Cartaxo, A.
Tolerance to in-Band Crosstalk of Virtual Carrier-assisted Direct Detection Multi-Band OFDM Systems.
DOI: 10.5220/0005743300310037
In Proceedings of the 4th International Conference on Photonics, Optics and Laser Technology (PHOTOPTICS 2016), pages 33-39
ISBN: 978-989-758-174-8
Copyright
c
2016 by SCITEPRESS – Science and Technology Publications, Lda. All rights reserved
33
DEMUX
MUX
MIB
OFDM Tx EOC BS
MEB
PIN
SEB
OFDM Rx
+
-
λ
1
λ
n
ROADM of node n
from node n − 1
to node n+1
Node n
MIB MEB
Node 1
MIB MEB
Node 2
MIB MEB
Fiber
Fiber
Fiber
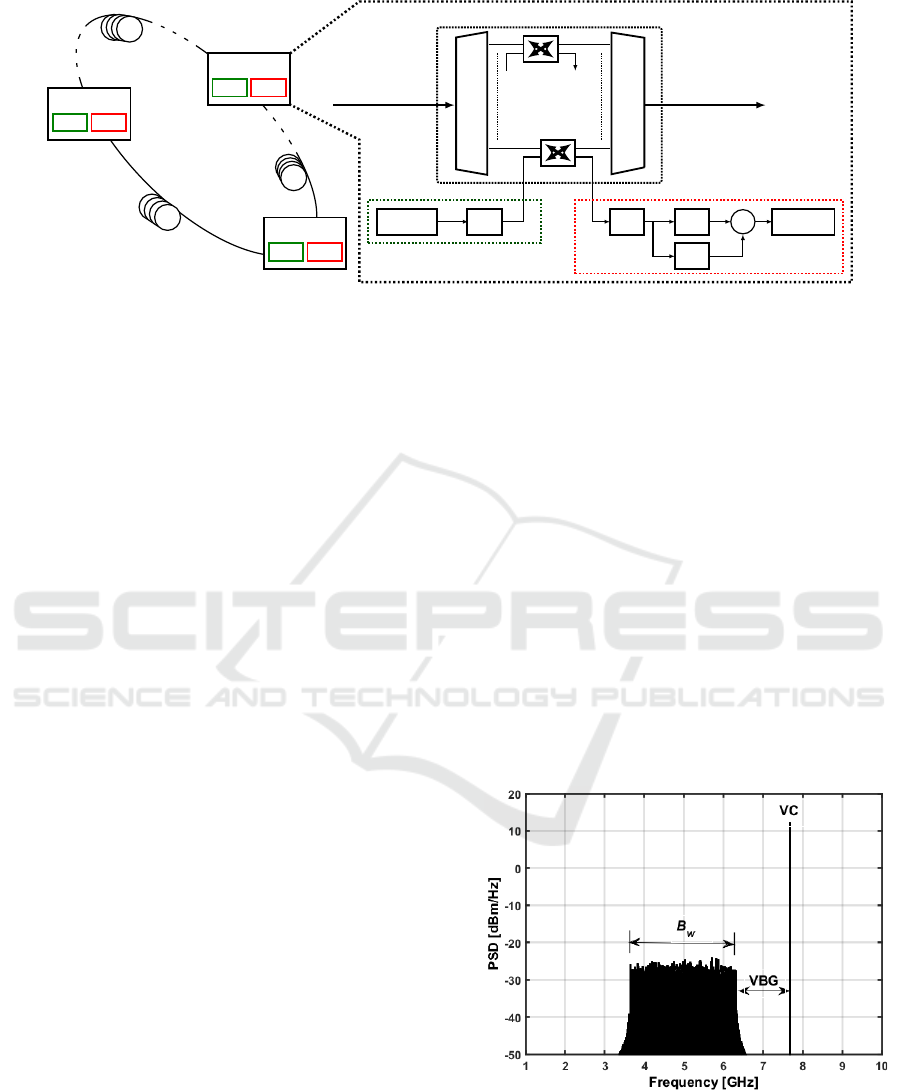
Figure 1: Block diagram of the MORFEUS metro network and respective nodes, comprising reconfigurable optical add-and-
drop multiplexer (ROADM), MORFEUS insertion block (MIB) and MORFEUS extraction block (MEB). EOC, BS and SEB
stand for electrical-optical converter, band selector and SSBI estimation block, respectively.
This paper is organized as follows. Section 2 de-
scribes the MORFEUS network and its simulation
model. The MORFEUS network is presented in sub-
section 2.1 and, in subsection 2.2, the MC simulation
is described. Numerical results are presented and dis-
cussed in Section 3. Conclusions are outlined in Sec-
tion 4.
2 NETWORK MODEL
In this section, the MORFEUS network and its model
are presented. Then, the main parameters of MB-
OFDM signal are detailed. The MC simulation is also
presented.
2.1 MORFEUS Network
Figure 1 depicts the block diagram of the MOR-
FEUS metro network (Alves, 2015). The MORFEUS
network consists of a ring topology. Each network
node comprises a reconfigurable optical add-and-drop
multiplexer (ROADM), a MORFEUS insertion block
(MIB) and a MORFEUS extraction block (MEB). The
MIB is responsible for the generation of the electri-
cal OFDM bands and VCs at the OFDM transmitter
(Tx). Then, the electrical OFDM signal is converted
to the optical domain using an Electrical-to-Optical
Converter (EOC), and inserted in the optical network
(Alves, 2015). In the MEB, the band extraction is per-
formed by a tunable optical filter (BS), which selects
the desired OFDM signal. Then, the selected OFDM
signal is sent to the SSBI estimation block (SEB) and
also to the PIN photodiode in order to be photode-
tected. Then, the estimated SSBI obtained from the
SEB, is removed from the photodetected OFDM sig-
nal, and after, the signal demodulation is performed at
the OFDM Rx.
The impact of in-band crosstalk on the DD OFDM
receiver performance can be assess considering a sin-
gle OFDM band. Therefore, we assume that the
OFDM signal has only one pair OFDM band-VC,
whose spectrum is depicted in Figure 2.
Figure 2 depicts the OFDM signal at the output
of the transmitter with an average power of 11 mW.
The OFDM band has a bandwidth, B
w
, of 2.675 GHz
and a central frequency of 5 GHz. The bandwidth B
w
is defined as N
sc
/T
s
, where N
sc
is the number of the
subcarriers and T
s
is OFDM symbol duration without
guard time. The frequency gap between the OFDM
band and the VC is the VBG, which in Figure 2 is
0.5B
w
. In this work, in order to maximize the system
SE, the VBG is set to 20.9 MHz. The ratio between
the average power of the VC and the power of the cor-
responding OFDM band is the VBPR.
Figure 2: PSD of the electrical MB-OFDM signal at the
OFDM Tx output, with an average power of 11 mW, con-
sidering one pair band-VC.
PHOTOPTICS 2016 - 4th International Conference on Photonics, Optics and Laser Technology
34

s
r
(t )
OFDM Tx
with VC
generation
CW Laser
CW Laser DP-MZM
HT
+ +
Crosstalk
ASE noise
BS
OFDM Rx
BER estimation
SEB
+
-
Figure 3: System model of the VC-assisted DD OFDM system. DP-MZM, HT and CW stand for dual parallel Mach-Zehnder
modulator, Hilbert transform and continuous wave, respectively.
2.2 Monte Carlo Simulation
In this subsection, the MC simulation and the meth-
ods to assess the BER are described.
Figure 3 depicts the simulation model of the
MORFEUS network considered to assess the toler-
ance of its performance to in-band crosstalk. It con-
sists of an OFDM transmitter (Tx) with VC genera-
tion, a dual parallel Mach-Zehnder modulator (DP-
MZM), a tunable band selector (BS), an ideal pho-
todetector, a SEB and an OFDM receiver. The BER is
estimated at the output of the OFDM receiver. Ampli-
fied spontaneous emission (ASE) noise and in-band
crosstalk are added to the OFDM signal at the optical
receiver input, before the BS.
The MC simulation starts with the generation of
the electrical OFDM signal, comprising the OFDM
band with a VC, and then, the electrical-optical con-
version is performed by the DP-MZM. The DP-MZM
generates a single-side band OFDM optical signal by
applying the electrical OFDM signal and its Hilbert
transform (HT) in the two arms of the modulator. In
this work, the HT of the OFDM signal is considered
ideal. The modulation index of the DP-MZM is set to
the optimized value of 5% (Alves, 2015). Then, by as-
suming a back-to-back configuration, ASE noise and
in-band crosstalk sample functions are added to the
optical OFDM signal.
The model of the SEB is depicted in Figure 4, and
it is based on the SSBI mitigation technique presented
in (Nezamalhosseini, 2013). The SEB is composed of
two branches. At the lower branch, the VC of the se-
lected OFDM signal is selected using an ideal optical
filter, named virtual carrier selector (VCS), and then,
the VC is removed from the OFDM signal in the up-
VCS
+
-
Figure 4: Model of the SEB. VCS stands for VC selector.
per branch. Afterwards, the SSBI is estimated after
the photodetection of the OFDM signal without the
VC. To conclude the SSBI mitigation algorithm, the
SSBI is removed from the photodetected OFDM sig-
nal before arriving the OFDM receiver, as shown in
Figure 3. In this work, we assume that both branches
of the SEB are synchronized.
At the BS input, the OFDM signal, s
r
(t), impaired
by the interferer and ASE noise can be written as
s
r
(t) = s
0
(t) +
N
x
∑
i=1
s
x,i
(t −τ
i
)e
jφ
i
+ N
0
(t) (1)
where s
0
(t) is the selected OFDM signal, s
x,i
(t) is the
i-th interfering signal of N
x
interferers and N
0
(t) is the
complex envelope of the ASE noise. We assume that,
the ASE noise follows a zero mean Gaussian distri-
bution with variance of N
0
B
sim
, where N
0
is the ASE
noise power spectrum density and B
sim
is the band-
width used in the MC simulation. τ
i
and φ
i
are, re-
spectively, the time delay and the phase difference be-
tween the selected and the i-th interfering signals. τ
i
is modeled as a uniformly distributed random variable
between zero and T
s
, and φ
i
has a uniform distribu-
tion within the interval [0, 2π] (Winzer, 2011). The
relation between the average powers of the i-th inter-
ferer and the selected OFDM signal is defined as the
crosstalk level (Winzer, 2011). In each iteration of the
MC simulation, a sample function of ASE noise and
of in-band crosstalk are generated and added to the
optical OFDM signal.
When estimating the EVM, the MC simulation
stops after 75 iterations (Alves, 2010), and then, the
root mean square (rms) of the EVM of each OFDM
subcarrier is evaluated using (Alves, 2010)
EV M
rms
[k] =
v
u
u
t
∑
N
s
n=1
|s
n
r
[k] −s
n
t
[k]|
2
∑
N
s
n=1
|s
n
t
[k]|
2
k ∈ {1, 2,..., N
sc
}
(2)
where s
n
r
[k] and s
n
t
[k] are, respectively, the received
and the transmitted symbol at the k -th subcarrier of
each n-th OFDM symbol of the total number of gen-
erated OFDM symbols, N
s
. Then, the BER of each
subcarrier, BER[k] is computed from (Shafik, 2006)
Tolerance to in-Band Crosstalk of Virtual Carrier-assisted Direct Detection Multi-Band OFDM Systems
35

aa
BER[k] = 4
(1 −1/
√
M)
log
2
(M)
Q
s
3
(M −1) ·EV M
rms
[k]
2
!
(3)
and the overall BER of the OFDM signal is given by
BER =
1
N
sc
N
sc
∑
k=1
BER[k] (4)
Remark that Equation 3 assumes a Gaussian distribu-
tion for the distortion each subcarrier (Alves, 2010).
The BER is estimated from DEC after a total of
5000 counted errors, N
e
, is reached in the OFDM re-
ceived signal, and is obtained using N
e
/(N
s
N
it
N
sc
N
b
),
where N
it
is the number of iterations of the MC simu-
lation and N
b
is the number of bits per symbol in each
OFDM subcarrier (Alves, 2010).
3 RESULTS AND DISCUSSION
In this section, the tolerance to in-band crosstalk of
the VC-assisted DD MB-OFDM communication sys-
tem is assessed numerically. The tolerated crosstalk
level, X
c,max
, is defined as the crosstalk level that
leads to a 1 dB optical signal-to-noise ratio (OSNR)
penalty. The OSNR penalty is defined as the dif-
ference in dB between the OSNR in presence of
crosstalk and the OSNR without crosstalk that lead
to a BER of 10
−3
(Winzer, 2011).
Table 1 presents the parameters used in MC sim-
ulation, in order to assess the tolerance to in-band
crosstalk of the VC-assisted DD OFDM system. The
VBPR, the −3 dB bandwidth of the BS, which in this
work is a 2
nd
-order Super-Gaussian, and the modu-
lation index are obtained from the optimization per-
formed in (Alves, 2015). The parameters of the se-
lected OFDM signal are kept the same throughout
this work. The parameters of the interferer are equal
Table 1: Simulation parameters of the VC-assisted DD
OFDM system.
Bit rate per band [Gbps] 10.7
Number of subcarriers (N
sc
) 128
Bandwidth [GHz] 2.675
OFDM symbol duration [ns] 47.85
Central frequency [GHz] 5
VBPR [dB] 6
VBG [MHz] 20.9
-3 dB bandwidth of BS [GHz] 3.6
modulation index 5%
OSNR @BER=10
−3
[dB] 15.3
modulation format 16-QAM
Crosstalk level [dB]
-35 -34 -33 -32 -31 -30 -29 -28 -27 -26 -25 -24 -23 -22
OSNR penalty [dB]
0
0.5
1
1.5
2
2.5
3
VBPR=0 dB
VBPR=2 dB
VBPR=4 dB
VBPR=6 dB
VBPR=8 dB
VBPR=10 dB
VBPR=12 dB
Figure 5: OSNR penalty as a function of the crosstalk level
obtained from the EVM method, for interfering signals with
different VBPRs.
to the ones of the selected OFDM signal, except for
the VBPR and VBG. The OSNR for a BER of 10
−3
without crosstalk is obtained using the EVM, and is
in agreement with the OSNR obtained using DEC.
In subsection 3.1, the VBPR of the interferer is
changed and its influence on the VC-assisted DD
OFDM system performance is assessed. In subsec-
tion 3.2, the impact of the VBG of the interferer on the
in-band crosstalk tolerance is evaluated considering
two distinct scenarios: in scenario (a), the frequen-
cies of the selected signal and interferer VCs are the
same, and in scenario (b) the central frequencies of
the OFDM band of the selected signal and interferers
are equal.
3.1 Influence of the VBPR on the
in-Band Tolerance
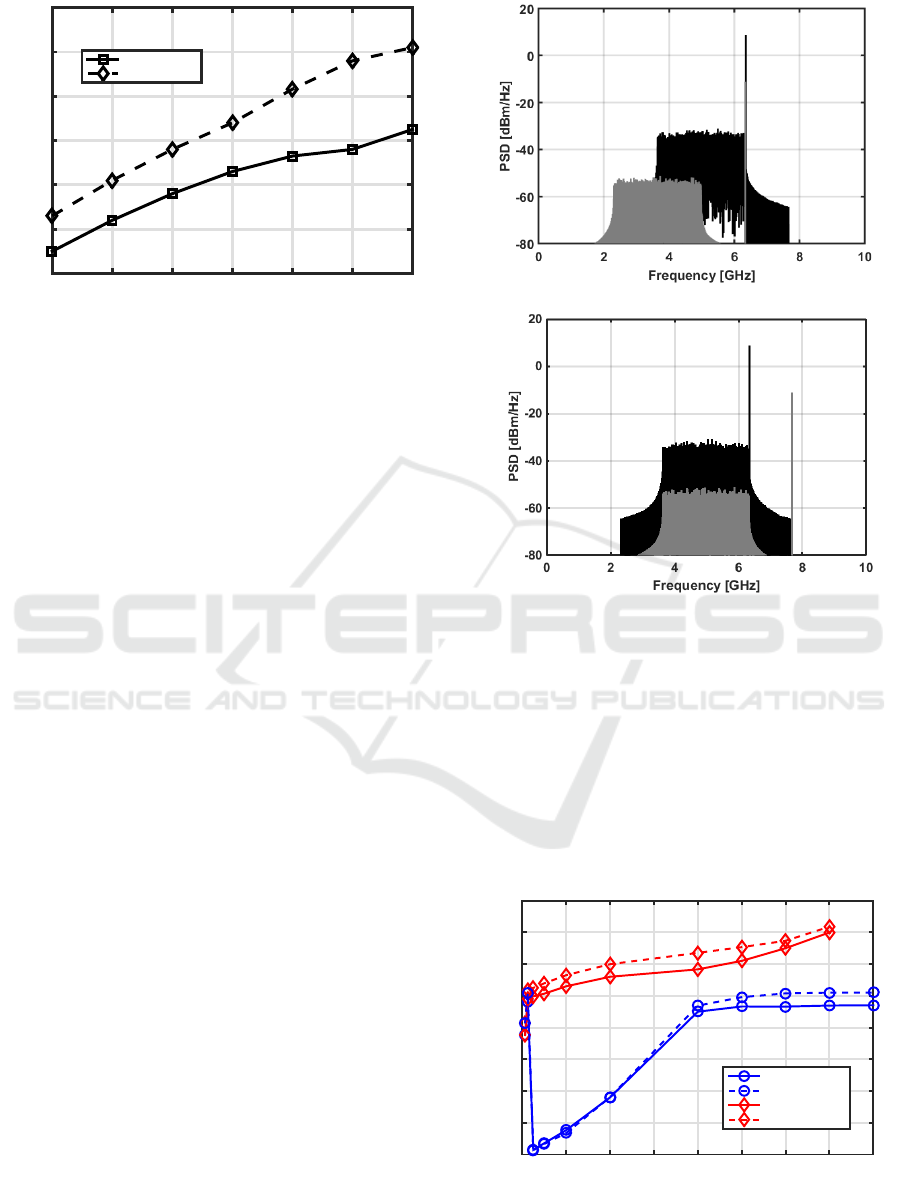
Figure 5 depicts the OSNR penalty as a function of
the crosstalk level due to a single interferer having
different VBPRs than the selected OFDM signal, ob-
tained using the EVM method. Figure 5 shows that
higher VBPRs of the interferer lead to lower OSNR
penalties. In Figure 6, the tolerated crosstalk level,
obtained from Figure 5, is depicted as a function of
the VBPR with a solid line. Figure 6 shows also the
tolerated crosstalk level as a function of the VBPR,
estimated using DEC, with a dashed line. A differ-
ence of about 2.8 dB between the tolerated crosstalk
level for VBPR of 0 dB and 12 dB is observed,
and the receiver performance degradation enhances
with the increase of the VBPR of the interferer. In
this case, the interfering band overlaps the selected
OFDM band in the frequency domain, and therefore,
the increase of the VBPR of the interferer reduces the
power of its OFDM band, hence, leading to less inter-
ference.
The tolerated crosstalk levels obtained using the
PHOTOPTICS 2016 - 4th International Conference on Photonics, Optics and Laser Technology
36
VBPR [dB]
0 2 4 6 8 10 12
X
c,max
[dB]
-29
-28
-27
-26
-25
-24
-23
EVM estimation
DEC estimation
Figure 6: Tolerated crosstalk level as a function of the
VBPR of the interferer, considering DEC (dashed lines) and
EVM (solid lines) estimations.
DEC method are 0.8 to 1.8 dB higher than the ones
obtained using EVM method, and the difference is
higher with the increase of the VBPR of the interferer.
As an example, for a VBPR of 6 dB, the EVM esti-
mates a tolerated crosstalk level of −26.7 dB, while,
the DEC predicts a tolerated crosstalk of −25.6 dB.
Considering these discrepancies between both meth-
ods, we conclude that the EVM is inaccurate on the
tolerated crosstalk level estimation, when the selected
and interferer OFDM signal have the same VBG but
different VBPRs. The in-band crosstalk sample func-
tions are not modelled by a Gaussian distribution,
thus, the BER obtained from Equation 3 can lead to
poor BER accuracy (Alves, 2010).
3.2 Influence of the VBG on the
in-Band Tolerance
In this subsection, the impact of the VBG of the in-
terferer on the VC-assisted DD OFDM system per-
formance is assessed, considering two different sce-
narios. In scenario (a), the frequency of the VC of
the interfering OFDM signal is the same as the VC of
the selected signal, and the variation of the VBG of
the interferer leads to a frequency deviation between
the central frequencies of the selected and interferer
OFDM bands, as it can be seen in Figure 7(a). In Fig-
ure 7(a), the spectrum of the selected OFDM signal
is depicted in black and the interfering OFDM sig-
nal spectrum is shown in gray. The interferer has a
crosstalk level of −20 dB and a VBG of 1.34 GHz.
Figure 7(b) exemplifies the scenario (b), in which, the
central frequencies of the interfering and the selected
OFDM bands are the same, and the variation of the
VBG of the interferer leads to a frequency difference
between the VC frequencies of the selected and inter-
ferer signals. In Figure 7(b), the VBG of the interferer
(a)
(b)
Figure 7: PSDs of the selected OFDM signal (black) and
interferer signal (gray) with a crosstalk level of −20 dB and
a VBG=B
w
/2 considering (a) same VCs frequencies and (b)
equal OFDM bands central frequencies.
is also 1.34 GHz.
Figure 8 depicts the tolerated crosstalk level as a
function of the VBG of the interferer, for both sim-
ulation scenarios. Focusing on scenario (a), Figure 8
shows that the tolerance to in-band crosstalk increases
with the VBG of the interferer. The crosstalk level
VBG [GHz]
0,02 0.33 0.67 1 1.34 1.62 2 2.34 2.68
X
c,max
[dB]
-38
-35
-32
-29
-26
-23
-20
-17
-14
Scenario (b) EVM
Scenario (b) DEC
Scenario (a) EVM
Scenario (a) DEC
Figure 8: Tolerated crosstalk level as a function of the VBG
considering the DEC (dashed lines) and EVM (solid lines)
estimations.
Tolerance to in-Band Crosstalk of Virtual Carrier-assisted Direct Detection Multi-Band OFDM Systems
37
with a VBG of 2.34 GHz is about 9 dB higher than the
one obtained with a VBG of 20.9 MHz. As already
said, this scenario leads to the misalignment between
the central frequencies of the interferer and selected
bands, thereby, as the VBG increases, less subcarriers
of the selected band are affected by in-band crosstalk,
and consequently, the robustness of the DD OFDM
system to in-band crosstalk is enhanced. For a VBG
of 2.68 GHz, the interferer OFDM band is totally mis-
aligned from the selected signal OFDM band, which
means, that the OFDM subcarriers of the selected sig-
nal are not affected by in-band crosstalk, leading to a
null OSNR penalty. Hence, we can conclude that, in
scenario (a), the DD OFDM receiver is completely
tolerant to interfering OFDM signals with VBG equal
or wider than the selected OFDM signal bandwidth.
Figure 8 shows that the EVM estimations for
the tolerated crosstalk level are in disagreement with
the DEC estimations, since a difference below 2 dB
between both estimations is observed. Once again,
this disagreement between the two methods is at-
tributed to the non-Gaussian distribution of the in-
band crosstalk sample functions.
Regarding scenario (b), Figure 8 shows that in-
terfering signals with a VBG between 83.6 MHz and
0.67 GHz exhibit a significant reduction on the toler-
ated crosstalk level, in comparison with smaller VBG.
For a VBG of 83.6 MHz, the tolerated crosstalk level
is about 11 dB lower than the one obtained for a VBG
of 20.9 MHz.
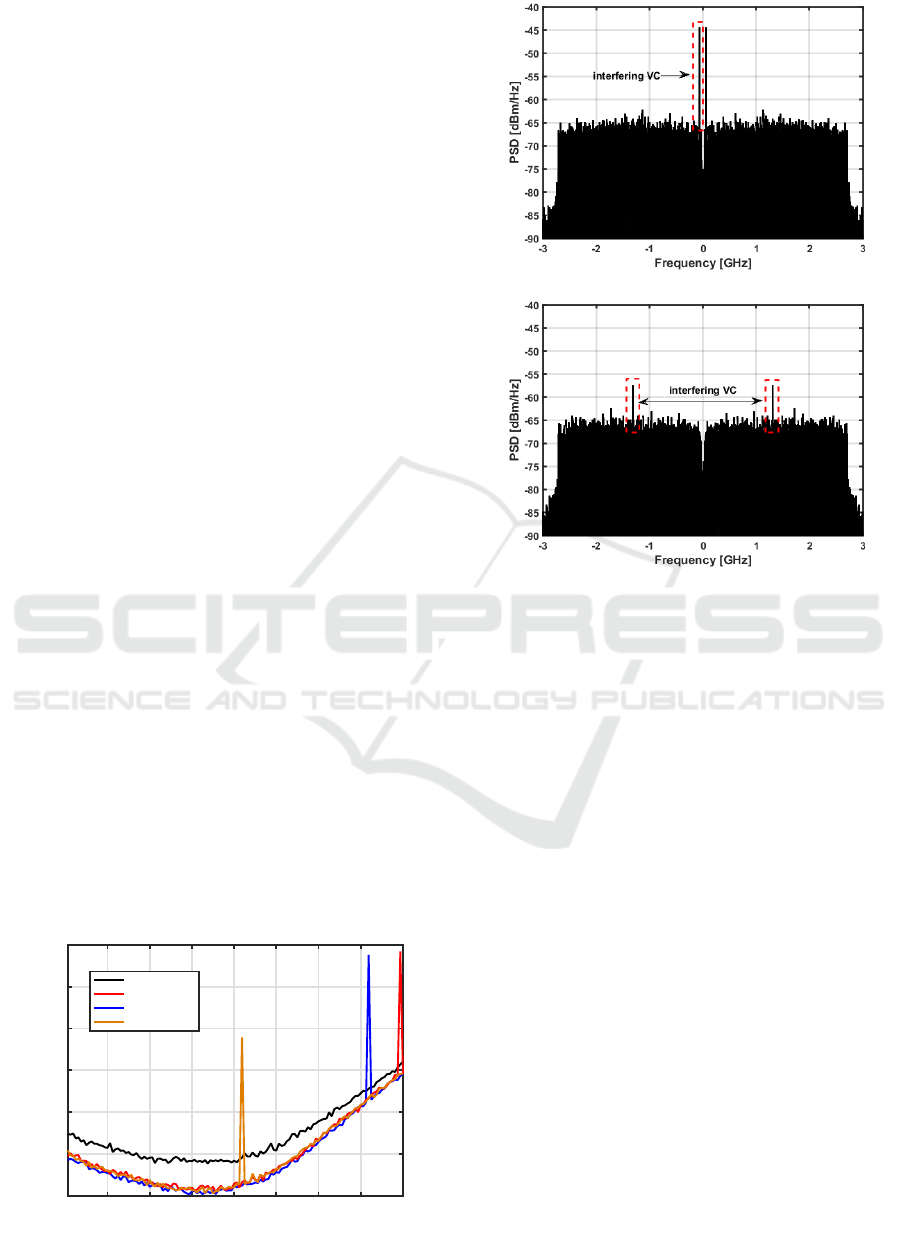
In order to investigate this behavior, the BER es-
timated using the EVM as a function of the subcar-
rier index is depicted in Figure 9. In Figure 9, the
crosstalk level is set to −26 dB, in order to enable
a performance comparison with different VBGs of
the interferer. From Figure 9, it is clear that for a
VBG of 83.6 MHz, the subcarrier 128 is the sub-
carrier with the worst performance due to the pres-
ence of the detected VC interferer. The increase of
Subcarrier index
1 16 32 48 64 80 96 112 128
log
10
(BER)
-3.5
-3
-2.5
-2
-1.5
-1
-0.5
VBG=20.9 MHz
VBG=83.6 MHz
VBG=0.34 GHz
VBG=1.34 GHz
Figure 9: BER as a function of the subcarrier index.
(a)
(b)
Figure 10: PSDs of the photodetected signal for a crosstalk
level of −20 dB and (a) VBG of 83.6 MHz and (b) VBG of
1.34 GHz on the interfering OFDM signal.
the VBG of the interferer changes the subcarrier with
worst performance and the BER per subcarrier is re-
duced, hence, decreasing the overall BER. It was ver-
ified that this effect is due to the BS filtering. As the
VBG increases, the frequency of the interferer VC be-
comes closer to the cut-off region of the BS, hence,
the power of the VC is attenuated, and after photode-
tection, the performance of the subcarrier that suffers
the VC interference is improved. For interferers with
a VBG of 2.68 GHz, the frequency of interferer VC is
outside the BS passband, leading to a fully suppres-
sion of the interfering VC. This can be inferred from
the comparison of the OFDM signal spectrums at the
photodetector output depicted in Figure 10.
Figure 10(a) shows the photodetection of the se-
lected band in presence of an interfering band having
a VBG of 83.6 MHz, while, in Figure 10(b), the VBG
of the interferer band is 1.34 GHz. By comparing both
figures, it is clear that the increase of the VBG leads
to a frequency shift of the detected interferer VC and
to an attenuation of its power.
Comparing the tolerated crosstalk levels estimated
from both methods, in scenario (b), Figure 8 shows
that, for interferers with VBGs between 83.6 MHz
and 0.67 GHz, the tolerated crosstalk level estima-
PHOTOPTICS 2016 - 4th International Conference on Photonics, Optics and Laser Technology
38

tions obtained from EVM and DEC are in agree-
ment. For the remaining VBGs, in which higher tol-
erated crosstalk levels are estimated, a maximum dif-
ference of 1.2 dB between both estimations is noticed.
Hence, we can conclude that the increase of the toler-
ated crosstalk level leads to discrepancies between the
EVM and the DEC estimations, as the BER estimated
from EVM, using Equation 3, looses accuracy.
4 CONCLUSIONS
In this work, the tolerance to in-band crosstalk of
the VC-assisted DD MB-OFDM system has been as-
sessed numerically. The influence of the VBPR and
VBG of the interferer on the in-band crosstalk toler-
ance has been analyzed.
Our results show that the impact of in-band
crosstalk on the DD OFDM system performance di-
minishes with the increase of the VBPR of the inter-
ferer. The increase of the power of the interferer VC
leads to a power reduction of the interferer OFDM
band, hence, causing less interference on the selected
signal.
The influence of the VBG of the interfering sig-
nal on the in-band tolerance has been evaluated con-
sidering two different scenarios. In scenario (a), the
frequency of the VCs of the selected signal and inter-
ferer are equal. In this case, the tolerance to in-band
crosstalk reduces with the amount of superposition of
interferer and selected OFDM bands. Larger VBG
leads to a reduction of the number of subcarriers that
are affected by crosstalk and the system performance
improves. When the VBG is equal to the OFDM sig-
nal bandwidth, the in-band crosstalk has no influence
on the DD OFDM receiver performance degradation.
In scenario (b), the central frequencies of the se-
lected signal and interferer bands are equal. In this
case, the tolerance to in-band crosstalk is severely di-
minished for a VBG of 83.6 MHz, leading to a tol-
erated crosstalk level that is about 11 dB lower that
the ones obtained for very narrow VBGs. This effect
is due to the detection of the interferer VC on the se-
lected signal and leads to a strong performance degra-
dation. As the VBG of the interferer becomes larger,
the BS filtering reduces the power of the VC of the
interferer and the performance of the DD OFDM re-
ceiver is improved.
The comparison between the numerical results ob-
tained from the DEC and EVM methods shows that,
for higher crosstalk levels, a maximum difference of
2 dB between both methods estimations has been no-
ticed. When the tolerated crosstalk level is lower
than −30 dB, the EVM and the DEC estimations are
in agreement. Hence, we can conclude that higher
crosstalk levels lead to an inaccurate BER estima-
tions.
ACKNOWLEDGEMENTS
This work was supported by Fundac¸
˜
ao para a Ci
ˆ
encia
e Tecnologia (FCT) from Portugal through Project
MORFEUS-PTDC/EEITEL/2573/2012. The project
UID/EEA/50008/2013 is also acknowledged.
REFERENCES
Alves, T., Alberto, A., and Cartaxo, A. (2014). Direct-
Detection Multi-Band OFDM Metro Networks Em-
ploying Virtual Carriers and Low Receiver Band-
width. Opt. Fiber Commun. Conf.
Alves, T. and Cartaxo, A. (2015). High Granularity Multi-
band OFDM Virtual Carrier-assisted Direct-Detection
Metro Networks. 33(1):42–54, paper Tu3G.5.
Alves, T. and Cartaxo, A. (2010). Analysis of Methods of
Performance Evaluation of Direct-Detection OFDM
Communication Systems. Fiber and Integrated Op-
tics, 29(3):170 – 186.
Nezamalhosseini, S., Chen, L., Zhuge, Q., Malekiha, M.,
Marvasti, F., and Plant, D. (2013). Theoretical and Ex-
perimental Investigation of Direct Detection Optical
OFDM Transmission using Beat Interference Cancel-
lation Receiver. Opt. Express, 21(13):15237–15246.
Peng, W., Zhang, B., Feng, K., Wu, X., Willner, A., and Chi,
S. (2009). Spectrally Efficient Direct-Detected OFDM
Transmission Incorporating a Tunable Frequency Gap
and an Iterative Detection Techniques. J. Light. Tech-
nol., 27(24):5723–5735.
Rebola, J. and Cartaxo, A. (2014). Impact of In-Band
Crosstalk Due to Mixed Modulation Formats with
Multiple Line Rates on Direct-Detection OFDM Opti-
cal Networks Performance. In Int. Conf. Transparent
Opt. Networks, pages 14–17.
Shafik, R., Rahman, S., and Islam, R. (2006). On the Ex-
tended Relationships Among EVM, BER and SNR as
Performance Metrics. In International Conference on
Electrical and Computer Engineering (ICECE), pages
408–411.
Winzer, P., Gnauck, A., Konczykowska, A., Jorge, F., and
Dupuy, J. (2011). Penalties from In-Band Crosstalk
for Advanced Optical Modulation Formats. In Euro-
pean Conference and Exhibition on Optical Commu-
nication (ECOC), paper Tu.5.B.7.
Tolerance to in-Band Crosstalk of Virtual Carrier-assisted Direct Detection Multi-Band OFDM Systems
39
