
Classification of Mild Cognitive Impairment Subtypes using
Neuropsychological Data
Upul Senanayake
1
, Arcot Sowmya
1
, Laughlin Dawes
2
, Nicole A. Kochan
3
, Wei Wen
3
and Perminder Sachdev
3
1
School of Computer Science and Engineering, UNSW, Sydney, Australia
2
Prince of Wales Hospital, Randwick, Sydney, Australia
3
Centre for Healthy Brain Ageing, UNSW, Sydney, Australia
Keywords:
Alzheimer’s Disease, Mild Cognitive Impairment, Machine Learning, Neuropsychological Features.
Abstract:
While the research on Alzheimer’s disease (AD) is progressing, timely intervention before an individual be-
comes demented is often emphasized. Mild Cognitive Impairment (MCI), which is thought of as a prodromal
syndrome to AD, may be useful in this context as potential interventions can be applied to individuals at in-
creased risk of developing dementia. The current study attempts to address this problem using a selection
of machine learning algorithms to discriminate between cognitively normal individuals and MCI individuals
among a cohort of community dwelling individuals aged 70-90 years based on neuropsychological test perfor-
mance. The overall best algorithm in our experiments was AdaBoost with decision trees while random forests
was consistently stable. Ten-fold cross validation was used with ten repetitions to reduce variability and assess
generalizing capabilities of the trained models. The results presented are consistently of the same calibre or
better than the limited number of similar studies reported in the literature.
1 INTRODUCTION
Decline in cognitive functions including memory,
processing speed and executive processes has been
associated with aging for sometime (Hedden and
Gabrieli, 2004). It is understood that every human
will go through this process, but some will go through
it faster and for some, this process starts earlier (Chua
et al., 2009; Cui et al., 2012a; Gauthier et al., 2006).
Differentiating between cognitive decline due to a
pathological process from normal aging is an ongoing
research challenge. One of the best studied diseases
in this context is Alzheimer’s disease (AD), which is a
neurodegenerative disease that can cause progressive
cognitive impairment with devastating effects for the
patients and their families. Although a cure for AD
has not been found yet, it is often stressed that early
identification of individuals at risk of AD can be in-
strumental in treatment and management.
Mild Cognitive Impairment (MCI) is considered
a prodromal stage to dementia and may reflect the
early clinical symptoms of a neurodegenerative dis-
ease such as AD (Ch
´
etelat et al., 2005; Cui et al.,
2012b; Haller et al., 2013; Petersen et al., 2009).
Patients with MCI have a higher probability of pro-
gressing to certain types of dementia, the most com-
mon being AD. Epidemiological studies suggest that
the progression rate from MCI to dementia is around
10-12% annually (Mitchell and Shiri-Feshki, 2009).
Therefore, accurate and early diagnosis of MCI is of-
ten stressed, as those patients can be closely moni-
tored for progression to AD. While there are accepted
consensus diagnostic criteria for MCI (Winblad et al.,
2004; Albert et al., 2011), how each of these crite-
ria is operationalized is less clear, resulting in differ-
ing rates of MCI across studies and regions (Kochan
et al., 2010). In turn, this makes it difficult to predict
progression to AD as well. Researchers usually focus
on three distinct yet related problems in this area: (i)
differentiating between cognitively normal (CN) and
MCI individuals, (ii) predicting conversion from MCI
to AD and (iii) predicting the time to conversion from
MCI to AD (Lemos et al., 2012). We focus on the first
problem in this paper.
There is also an interest in identifying subtypes
of MCI, because each subtype is related to specific
types of dementia and differential rates of conversion
to dementia. Therefore, we also focus on MCI sub-
620
Senanayake, U., Sowmya, A., Dawes, L., Kochan, N., Wen, W. and Sachdev, P.
Classification of Mild Cognitive Impairment Subtypes using Neuropsychological Data.
DOI: 10.5220/0005747806200629
In Proceedings of the 5th International Conference on Pattern Recognition Applications and Methods (ICPRAM 2016), pages 620-629
ISBN: 978-989-758-173-1
Copyright
c
2016 by SCITEPRESS – Science and Technology Publications, Lda. All rights reserved

Table 1: The subtypes of MCI.
Amnestic subtype of
MCI (aMCI)
Non-amnestic subtype
of MCI (naMCI)
Single domain aMCI
(sd-aMCI)
Single domain naMCI
(sd-naMCI)
Multi domain aMCI
(md-aMCI)
Multi domain naMCI
(md-naMCI)
type classification.
There are two major subtypes of MCI; amnestic
subtype of MCI and non-amnestic subtype of MCI.
Amnestic subtype of MCI (aMCI) refers to impair-
ment in memory, while non-amnestic subtype of MCI
(naMCI) refers to non-memory impairments affecting
executive functions, attention, visuospatial ability or
language. These two subtypes are further divided de-
pending on the number of domains impaired. Thus,
we end up with four subtypes of MCI as seen in Ta-
ble 1 (Winblad et al., 2004; Albert et al., 2011): Re-
cent studies point out that md-aMCI has the highest
probability of progress to AD and to dementia (Gan-
guli et al., 2011). Previous work in this area has fo-
cused on studying different modalities of Magnetic
Resonance (MR) images in order to differentiate be-
tween different subtypes of MCI (Alexander et al.,
2007; Ch
´
etelat et al., 2005; Chua et al., 2008; Chua
et al., 2009; Haller et al., 2013; Hinrichs et al., 2011;
Reddy et al., 2013; Raamana et al., 2014; Repper-
mund et al., 2014; Sachdev et al., 2013b; Sachdev
et al., 2013a; Thillainadesan et al., 2012). While
several studies have shown that MR images, espe-
cially diffusion tensor imaging, can accurately por-
tray micro-structural changes indicating neurodegen-
erative disease, the performance of the models could
be improved. We focus on the neuropsychological
test scores first and plan to integrate image based fea-
tures at a later stage. In this study, we present the
first in-depth assessment of neuropsychological mea-
sures (NM) in differentiating between MCI with its
subtypes and CN individuals. A degree of circularity
appears to be involved when using neuropsycholog-
ical measures which we elaborate in the discussion
section.
The remainder of this paper is organized as fol-
lows. The materials and datasets used are described
in section 2. We then introduce the methods, pivoting
on the core machine learning concepts used. The re-
sults of our study are in section 3 and we conclude this
study in the final section with a discussion on results
and indicating future directions of research.
Table 2: Demographic characteristics of the participants at
baseline.
Sample size: 837 Baseline (wave 1)
Age (years) 78.57 ± 4.51 (70.29-
90.67)
Sex (male/female) 43.07% / 56.92%
Education (years) 12.00 ± 3.65
MMSE (Mini-Mental
State Exam)
28.77 ± 1.26
CDR (Clinical Dementia
Rating)
0.066 ± 0.169
2 MATERIALS AND METHODS
2.1 Participants
The dataset we use was drawn from the Sydney Mem-
ory and Aging Study (MAS) that comprised 1037
community-dwelling, non-demented individuals re-
cruited randomly through electoral rolls from two
electorates of East Sydney, Australia (Sachdev et al.,
2010). These individuals were aged 70-90 years
old at the baseline. Each participant was adminis-
tered a comprehensive neuropsychological test bat-
tery, and 52% underwent an MRI scan. Individu-
als were excluded if they had a Mini-Mental State
Examination (MMSE) score < 24 (adjusted for age,
years of education and non-English-speaking back-
ground), a diagnosis of dementia, mental retardation,
psychotic disorder (including schizophrenia and bipo-
lar disorder), multiple sclerosis, motor neuron dis-
ease and progressive malignancy or inadequate En-
glish to complete assessments. Three repetitive waves
after the baseline assessment have been carried out
to date at a frequency of 2 years. Details of the
sampling methodology have been published previ-
ously (Sachdev et al., 2010). This study was approved
by the Human Research Ethics Committees of the
University of New South Wales and the South East-
ern Sydney and Illawarra Area Health Service, and
all participants gave written informed consent. The
demographics of the participants at baseline are given
in Table 2. Only non-demented individuals from En-
glish speaking backgrounds with complete neuropsy-
chological measures available were selected for the
study.
2.2 Cognitive Assessments
A selection of available clinical and neuropsychologi-
cal data was used by an algorithm to diagnose MCI in
accordance with international criteria (Winblad et al.,
Classification of Mild Cognitive Impairment Subtypes using Neuropsychological Data
621

2004; Sachdev et al., 2010): (i) complaint of de-
cline in memory and/or other cognitive functions by
the participant or knowledgeable informant; (ii) pre-
served instrumental activities of daily living (Bayer
ADL Scale (Hindmarch et al., 1998) score < 3.0); (iii)
objectively assessed cognitive impairment (any neu-
ropsychological test score ≥ 1.5 standard deviations
(SDs) below published norms), (iv) not demented.
Individuals are considered cognitively normal (CN)
when performance on all measures were above the
7th percentile (≥ 1.5 SD) compared to published nor-
mative data, adjusted for age and education where
possible. Over and above this procedure, at each
wave, cases were brought to a panel of old age psy-
chiatrists, neuropsychiatrists and neuropsychologists
when there were unusual clinical features or an in-
dication that an individual may have dementia. Con-
sensus diagnosis of MCI, dementia or cognitively nor-
mal was made using all available data including clini-
cal history, neuropsychological performance and MRI
scans where available. Detailed methodology can be
found (Sachdev et al., 2010).
The neuropsychological tests administered at
baseline have been previously described (Sachdev
et al., 2010). Thirteen measures from 11 standard-
ised psychometric tests were administered by trained
research psychologists measuring premorbid IQ, at-
tention/information processing speed, motor speed,
memory, language, visuo-spatial and executive abil-
ities. We examine the raw versions of these scores
rather than the age, sex and education adjusted scores,
as this preprocessing step can result in improper
model selection and overoptimistic results (Lemm
et al., 2011).
The tests were administered over the next three
waves at follow up intervals of two years each. When
the expert panel were consulted, they examined all
available data before coming up with a diagnosis, in-
cluding the neuropsychological measures as well as
MRI scans where available.
2.3 Classification using
Neuropsychological Test Scores
We used the neuropsychological test scores described
in the subsection 2.2 to train models that differentiate
between classes. The consensus diagnosis is treated
as a sample label. The algorithms used are all su-
pervised learning algorithms as we have labeled data.
We trained supervised binary classifiers using differ-
ent algorithms. These experiments were performed
using four different algorithms, which are described
next. We then elaborate on the experimental setup
used and the subclasses for classification.
2.3.1 Support Vector Machine
Support vector machines (SVM) can be considered as
a more recent algorithm compared to the history of
other learning algorithms (Cortes and Vapnik, 1995).
SVM is a margin based technique, where the margin
on either side of a hyperplane that separates two data
classes is maximized. This creates the largest possi-
ble distance between the separating hyperplane and
the instances on either side of it have been proven
to reduce an upper bound on the expected general-
ization error. A better description of SVMs can be
found (Maglogiannis, 2007; Crisci et al., 2012; Kot-
siantis, 2007). A grid search with cross validation was
used to find the optimum parameters for the SVM.
2.3.2 Random Forest
This method is based on decision trees which is one
of the oldest techniques used for classification and
has evolved much in the last two decades. A good
overview can be found (Murthy, 1998). Decision trees
can be considered as trees that classify instances by
sorting based on feature values (Maglogiannis, 2007).
Each node in a decision tree represents a feature of an
instance to be classified and each branch represents
a value that the node can take. The classification of
instances starts from the root node and instances are
sorted based on their feature values.
A random forest (RF) is a collection of decision
trees (Liaw and Wiener, 2002). Classification for a
new instance is obtained by majority vote over the
classifications provided by individual trees included
in the forest. A random bootstrap sample of data is
used to train a tree which adds an additional layer
of randomness to bagging (Liaw and Wiener, 2002).
Conventional decision trees use the best split among
all variables to decide how each node is split. How-
ever, best split among a subset of all variables is cho-
sen in random forest. Although this may appear coun-
terintuitive, it has been pointed that random forests
perform comparably or better than a majority of clas-
sifiers such as discriminant analysis, SVM and neural
networks, and are also inherently robust against over-
fitting.
2.3.3 AdaBoost
AdaBoost (AB) is a variant of boosting (Freund and
Schapire, 1999). The roots of boosting go back as far
as the theoretical framework of PAC (Probably Ap-
proximately Correct) learning. It builds on the con-
cept that a ‘weak’ learning algorithm that performs
slightly better than chance (random guessing) can be
boosted into a strong learning algorithm. AdaBoost is
ICPRAM 2016 - International Conference on Pattern Recognition Applications and Methods
622

a variant of boosting that addresses the potential dif-
ficulties faced by other boosting algorithms and has
become a standard in recent times.
The AdaBoost algorithm description is avail-
able (Freund and Schapire, 1999). We use decision
trees as the base algorithm for AdaBoost.
2.3.4 Ensemble Methods
The underlying concept of ensemble methods (ES) is
similar to boosting. A set of weak learners that per-
forms slightly better than chance can be integrated to
train a strong classifier. While many other methods of
integration exist, we focus on weighted averaging and
voting . The usual variants are bagging and boost-
ing when the algorithm only uses one type of base
learner. The ensemble method we use is trained with
multiple types of base learners and is integrated using
voting. Multiple versions of base learners are trained
with varying parameters and the best classifiers are
determined. While some classifiers can be consid-
ered as the best reported, others yield mediocre per-
formance. Therefore, instead of combining the good
and bad models together, a forward stepwise selec-
tion is used to select the subset of models that when
averaged together yields excellent performance.
We use five types of base learners: SVM, k-
nearest neighbour, decision trees, REPTree and ran-
dom forest. A detailed description of the underly-
ing ensemble selection method can be found (Caruana
et al., 2004). It should be noted that random forest is
also type of an ensemble method, however, we refer
to the procedure described above as ensemble method
for the rest of this paper.
2.3.5 Experimental Setup
We use Weka experimenter (v3.7) to carry out the ex-
periments (Hall et al., 2009). All experiments uti-
lize ten-fold cross validation with ten repetitions to
eliminate bias and improve the reliability of the re-
sults. The different class labels used are tabulated in
Table 3. While the first column resembles conven-
tional machine learning experiments, the second col-
umn specifies the use of one class as positive and ev-
erything else as negative instances. For example, in
aMCI against CN, the positive class is aMCI while
CN is the negative class. Individuals with naMCI
are not used to train this classifier. In contrast, aMCI
against everything else uses aMCI as the positive class
and everything else as the negative class which in-
cludes naMCI as well. While this increases class
imbalance, we believe the increased number of neg-
ative instances together with the careful selection of
algorithms, leads to performance improvement as ev-
idenced by the results.
Table 3: The different classes used for experimentation.
One vs One One vs All
MCI — CN aMCI — everything else
aMCI — CN naMCI — everything else
naMCI — CN sd-naMCI — everything else
aMCI — naMCI md-naMCI — everything
else
sd-aMCI — md-
aMCI
sd-aMCI — everything else
sd-naMCI —
md-naMCI
md-aMCI — everything else
We also carry out feature subset selection in order
to reduce the feature space and improve the perfor-
mance. We experiment with three types of feature
subset selection methods including similarity based
feature selection, information gain based feature se-
lection, wrapper based feature selection, and present
our observations.
As earlier described, the dataset was acquired in
four individual waves and we treat them as four sep-
arate datasets. We execute the denoted experiments
over the four waves separately and present the results.
In fact, this constitutes one of the largest datasets re-
ported in the literature as our sample from the first
wave has 837 patients altogether, of which 505 are CN
individuals and 332 are MCI individuals. Although
the numbers decrease as the waves progress, the vary-
ing levels of progression warrants consideration of the
four waves as four different and distinct datasets and
demonstrates the validity of our results. We used 35
features to train the classifiers for the first wave while
29, 28 and 28 features were used to train classifiers
for the second, third and fourth waves respectively.
3 RESULTS
The results of the experiments are presented in two
main subsections. The first subsection discusses the
results obtained from training binary classifiers of one
vs one classes, while the second subsection discusses
the results obtained from training binary classifiers of
one vs all classes.
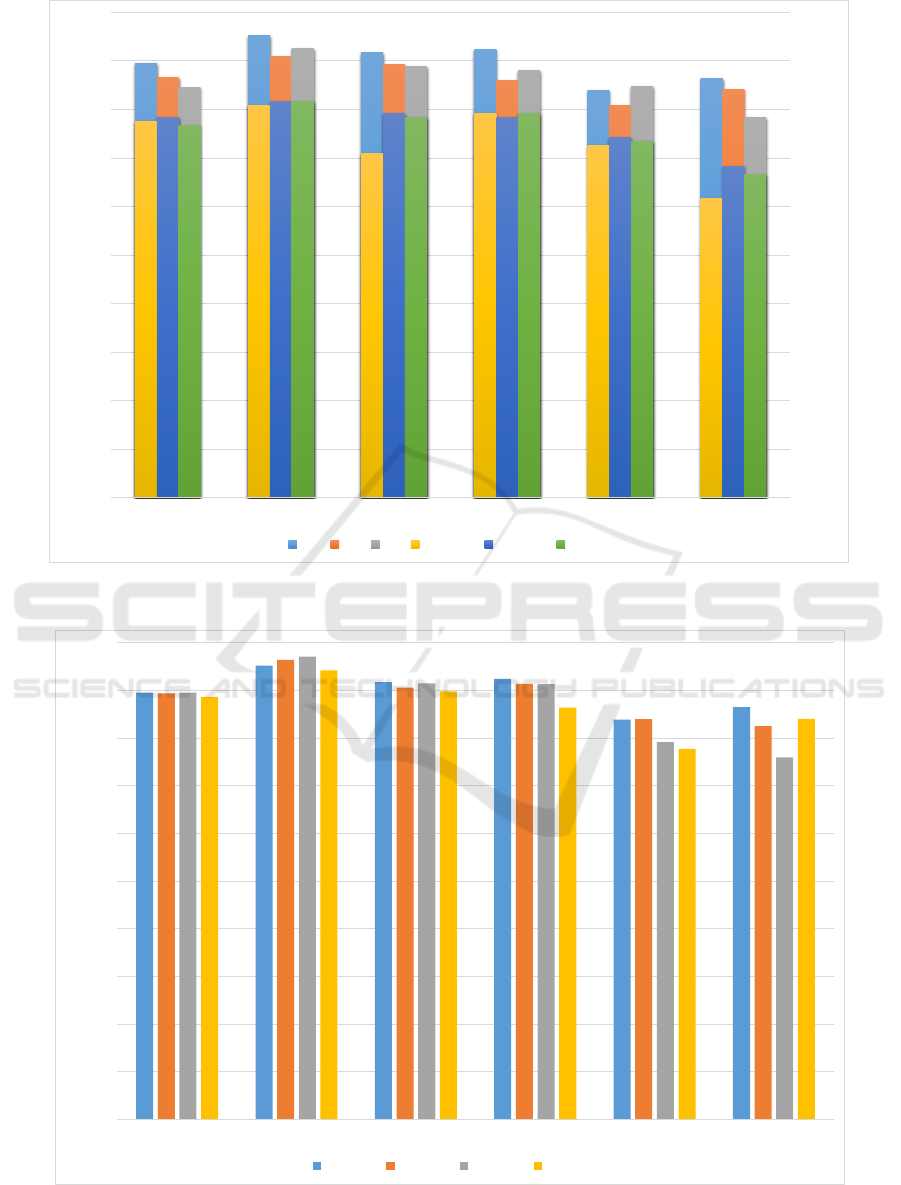
3.1 One vs One Classes
We present the performance of models trained over
the first wave in Figure 1. While four algorithms
were used for comparison, we only present the re-
sults of the best three algorithms for clarity. As can
Classification of Mild Cognitive Impairment Subtypes using Neuropsychological Data
623

be seen, AdaBoost and Ensemble Selection have per-
formed very well on this dataset and random forest
follows closely. We are unable to draw a direct com-
parison, as we could not find studies that used the
same neuropsychological tests as ours. We report on
the closest studies we can find (Lemos et al., 2012;
Cui et al., 2012a). Lemos et al. report the classifica-
tion results on differentiating MCI from AD, whereas
Cui et al. report the classification results of predicting
progression to MCI from CN. The best performance
reported by the first work is an accuracy of 82% with
a sensitivity of 76% and specificity of 83% while the
second work noted that their best performance is an
accuracy of 78.51% with an AUC of 0.841. Although
the results we report do not constitute a direct com-
parison, they are consistently of the same calibre or
better than those reported by these studies. In addi-
tion, we also compare our results to the best results
reported by Reddy et al. who used the same dataset
as ours. Their study used a derived set of features
from the MRI based features, in order to differentiate
between subtypes of aMCI. While they report an ac-
curacy of 0.58 with an AUC of 0.67 in classifying sd-
aMCI and md-aMCI, our model exhibits an accuracy
of 0.847 with an AUC of 0.88 which is a significant
improvement over the reported results.
We then proceed to add further validation to the
performance of the trained models by repeating the
same experiments over the next three waves as well.
In the interests of clarity, we only include the best
performing classifier for each classification experi-
ment for each wave, which are plotted in Figure 2.
It should be noted that, while in some cases, the best
performing algorithm is unanimous, other cases ex-
hibit differences in performance metrics. For exam-
ple, in naMCI subtype classification of the second
wave, while AdaBoost outperforms random forest in
accuracy (85.14% to 82.47%), random forest signifi-
cantly outperforms AdaBoost in AUC measure (0.68
to 0.86). In such cases, we consider random forest as
the better performer.
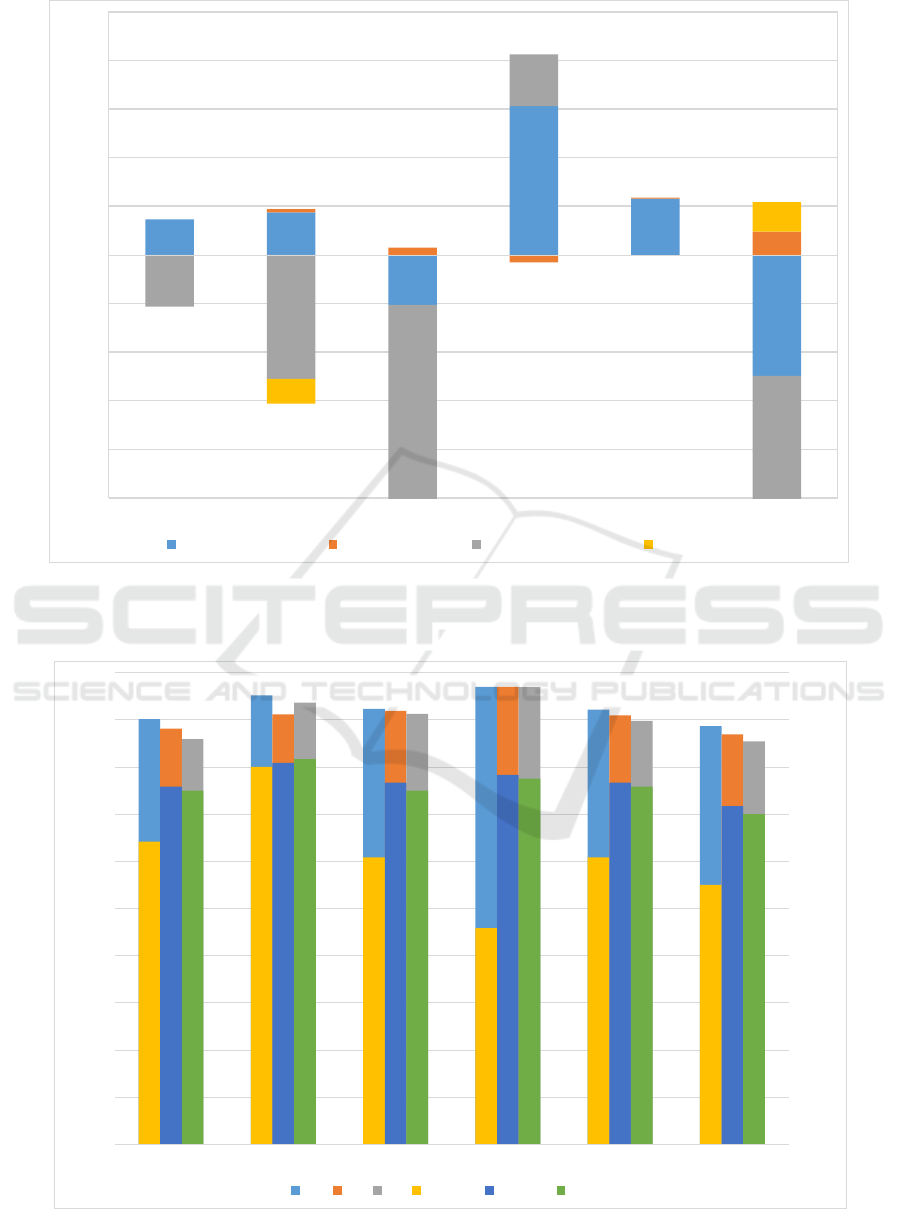
We tried a range of feature selection algorithms in
order to assess the effect on final classification per-
formance of the models. We chose a relatively stable
algorithm, namely random forest, to assess the impact
of feature selection. Three major categories of feature
selection algorithms were used: correlation based fea-
ture selection, information gain based feature selec-
tion and wrapper based feature selection. Specific al-
gorithms used are (i) Correlation based subset evalu-
ation (ii) Pearson correlation based (iii) Cross valida-
tion based (iv) Gain ratio based (v) Information gain
based (vi) SVM wrapper based (vii) Random forest
wrapper based and (viii) RELIEFF. More about these
algorithms can be found (Hall et al., 2009). Only one
model was significantly improved by feature subset
selection, namely the classification of MCI subtypes
where the accuracy was improved to 91.27% from
86.01%. In presenting the results of feature selec-
tion, we opted not to include any method that does not
improve the accuracy of at least three classifiers out
of the six being tested. Only two methods remained
and the difference in accuracy and AUC of these two
methods are shown in Figure 3.
As can be interpreted from the results, feature sub-
set selection did not improve the performance of the
classifiers significantly and therefore, we refrained
from further use of feature selection in this work.
3.2 One vs All Classes
The performance of the models trained on one vs all
classes of the first wave is shown in Figure 4. Clearly
the accuracy of the trained models has improved sig-
nificantly in most cases. However, the AUC has typ-
ically decreased compared to the one vs one class
scenario. This phenomenon can be explained when
sample size is taken into consideration. For exam-
ple, considering naMCI vs everything else, it can be
seen that the ratio of positive to negative class is 1:4.6
which helps to improve the accuracy. The same rea-
son causes the decrease in AUC, as specificity is in-
creased and sensitivity is decreased.
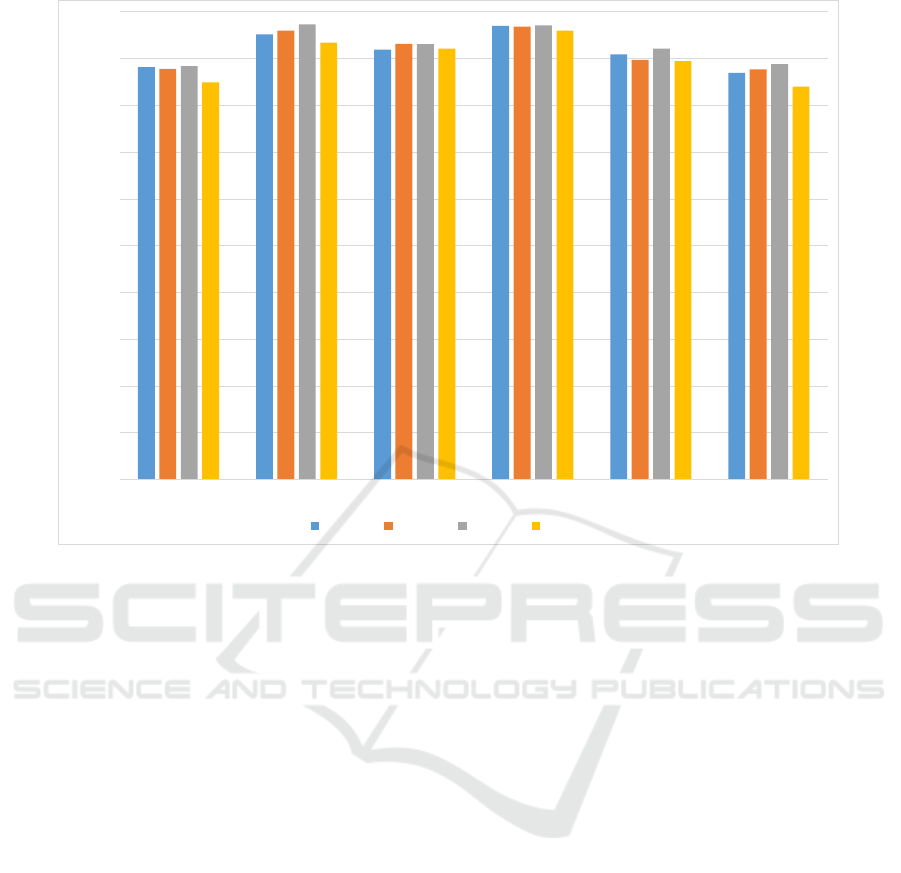
For the sake of clarity, the results of the next three
waves are represented in a plot where we only con-
sider the best classifier, as shown in Figure 5. In se-
lecting the best classifier, we thresholded the mini-
mum AUC to 0.85 and ordered the results using accu-
racy. While AdaBoost still scores highest in accuracy
in most cases, random forest turns out to be a better
one vs all classifier in terms of AUC.
The intention behind developing one vs all clas-
sifiers is to come up with a multi-class classifier that
can be used to classify a general population into CN,
MCI and its subtypes where applicable. Our study is
the first time that such an attempt has been made.
4 DISCUSSION
This study was devised to investigate the diagnostic
value of neuropsychological features alone in differ-
entiating MCI and its subtypes. We trained multiple
classifiers including MCI versus CN, and differentiat-
ing between subtypes of aMCI and naMCI. This level
of detail is warranted as it has been shown that differ-
ent types/subtypes of MCI can progress into different
types of dementia at varying rates. The models we
ICPRAM 2016 - International Conference on Pattern Recognition Applications and Methods
624
89.49
95.14
91.71
92.35
83.82
86.44
86.46
90.94
89.26
86.01
80.83
84.02
84.51
92.48
88.76
88.07
84.7
78.32
0.93
0.97
0.85
0.95
0.87
0.74
0.94
0.98
0.95
0.94
0.89
0.82
0.92
0.98
0.94
0.95
0.88
0.8
0
0.2
0.4
0.6
0.8
1
1.2
0
10
20
30
40
50
60
70
80
90
100
CN vs MCI CN vs aMCI CN vs naMCI MCI subtypes aMCI subtypes naMCI subtypes
Area under ROC
Percentage Accuracy
AB RF ES AB-AUC RF-AUC ES-AUC
Figure 1: Best accuracies and AUC for each model grouped together for each one vs one class.
0
10
20
30
40
50
60
70
80
90
100
CN vs MCI CN vs aMCI CN vs naMCI MCI Subtypes aMCI Subtypes naMCI Subtypes
Percentage Accuracy
Wave 1 Wave 2 Wave 3 Wave 4
Figure 2: Best accuracies for each wave grouped together for each one vs one class. The lowest AUC is 0.77 while the mean
AUC is around 0.86.
Classification of Mild Cognitive Impairment Subtypes using Neuropsychological Data
625
-10
-8
-6
-4
-2
0
2
4
6
8
10
CN vs MCI CN vs aMCI CN vs naMCI MCI subtypes aMCI subtypes naMCI subtypes
Relative Percentage Difference
Wrapper Based (RF) RELIEF Algorithm Wrapper Based - AUC RELIEF - AUC
Figure 3: The percentage differences after feature selection for models trained using random forest. The minimum value of
the plot is cut-off at -10 for clarity although two data points lie outside the range. Both data points correspond to AUC values
of wrapper based feature selection; -18.94% for CN vs naMCI and -39% for naMCI subtypes.
90.12
95.17
92.31
96.99
92.15
88.65
88.14
91.15
91.88
96.96
90.91
86.91
85.86
93.65
91.24
96.9
89.76
85.42
0.77
0.96
0.73
0.55
0.73
0.66
0.91
0.97
0.92
0.94
0.92
0.86
0.9
0.98
0.9
0.93
0.91
0.84
0
0.2
0.4
0.6
0.8
1
1.2
0
10
20
30
40
50
60
70
80
90
100
naMCI aMCI md-aMCI md-naMCI sd-aMCI sd-naMCI
Area under ROC
Percentage Accuracy
AB RF ES AB-AUC RF-AUC ES-AUC
Figure 4: Best accuracies and AUC for each model grouped together for each one vs all class.
ICPRAM 2016 - International Conference on Pattern Recognition Applications and Methods
626
0
10
20
30
40
50
60
70
80
90
100
naMCI aMCI md-aMCI md-naMCI sd-aMCI sd-naMCI
Percentage Accuracy
Wave 1 Wave 2 Wave 3 Wave 4
Figure 5: Best accuracies for each wave grouped together for each one vs all class. The lowest AUC is 0.85 while the mean
AUC is around 0.92.
have trained using neuropsychological measures have
excellent classification performance with a high level
of accuracy without compromising the generalizing
capabilities of the model, as seen from the high val-
ues of AUC.
Many published studies concentrate on differenti-
ating between MCI and its subtypes (Raamana et al.,
2014; Haller et al., 2013). However, only one of
them used purely neuropsychological measures to
train their models (albeit for a related but different
classification). Most studies use image based features
such as morphological MR images or diffusion ten-
sor images. The study that used neuropsychological
measures trained their classifier to differentiate be-
tween MCI and AD rather than CN/MCI and its sub-
types (Lemos et al., 2012). For this reason, we cannot
draw a direct comparison from the available literature.
However, we have presented comparisons with two of
the closest studies that we could find that used neu-
ropsychological features. In addition, we also draw
a comparison to a similar classification task that used
the same dataset. Clearly our results are of the same
calibre or often times better than the aforementioned
studies. Perhaps what validates our results the most
is that we are using one of the largest datasets re-
ported in the literature, which improves the general-
ization capabilities of our trained models. The sample
size coupled with repeated cross validation ensures
minimization of overfitting as well. In addition, the
best performing classifiers in the experiment were ob-
tained using AdaBoost, Ensemble Selection and ran-
dom forest, which are inherently robust against over-
fitting. As our experimental setup is optimized to
avoid overfitting as much as possible while improv-
ing the accuracy by fine-tuning the parameters, we
believe our results demonstrate superior performance.
It should be noted that there is a degree of circu-
larity in using neuropsychological measures to differ-
entiate between MCI subtypes as the same neuropsy-
chological measures were used to come up with labels
for each sample. However, the labeling process can be
considered as a weak classifier in itself as it tends to
follow a set of rules much like a rule based classifier
that was manually designed. However, when the ex-
perts disagree with the labels assigned by the rules,
the case labels are changed actively. Therefore, the
labeling process may be considered as a basic set of
rules with a dynamic set of exceptions as labeling pro-
gresses. We believe this unique labeling process par-
tially explains the reason for boosting and ensemble
methods to have performed better in the experiments
as boosting/ensemble methods can be used to improve
Classification of Mild Cognitive Impairment Subtypes using Neuropsychological Data
627

the performance of a weak learner and expand its cov-
erage by including more features. We also believe this
opens up a direction for future work as NM and MRI
based features can be considered as two independent
datasets which leads to the paradigm of multi-view
learning. We intend to explore this in the future.
Although the results of feature subset selection
are not entirely successful, it may still prove useful.
For large datasets, the best improvement in perfor-
mance is demonstrated with random forest wrapper
based feature selection. Performance is worse for CN
vs naMCI and naMCI subtypes. The reason can be
explained when we look at the sample sizes. In the
naMCI subtype classifier, there are 122 instances for
md-naMCI and 26 instances for sd-naMCI. With a
wrapper based feature selection method, the training
set becomes even smaller, which explains the relative
decrease in AUC of around 40% from 0.82 to 0.5.
It is interesting to observe that, while most related
literature report good performance with SVM, it was
one of the worst performing classifiers in our exper-
iments. Although it has been considered as the de-
fault classifier in recent times, our experiments sug-
gest otherwise for the selected domain and problem.
It is worthwhile to understand the structure of the
dataset we are dealing with before choosing a classi-
fier and we believe the nature of the data we are deal-
ing with explains why tree structures perform better
than other methods.
In future, we intend to utilize neuropsychologi-
cal measures to predict progression from CN to MCI
as well as MCI to AD. This may prove invaluable
in identifying individuals at risk of MCI and AD so
that they can be closely monitored and treated better.
We also intend to combine neuropsychological mea-
sures with image based features derived from modal-
ities such as morphological MRI and diffusion ten-
sor images, in an attempt to improve the reported per-
formance in literature. We believe the key to perfor-
mance enhancement lies in understanding the struc-
ture of the dataset and designing customized classi-
fiers best fitted for the dataset in question.
In conclusion, we strongly believe that it is a
worthwhile effort to automate diagnosis of MCI and
its subtypes. Generally MCI is diagnosed in the older
population, and for a considerable number of patients,
MRI scans may be contraindicated because they have
pacemakers or other implants, have muscular-skeletal
issues or are claustrophobic. Furthermore there is the
high cost of MRI scans. Reliable diagnosis of MCI
using neuropsychological measures would therefore
have considerable advantage. To that extent, we be-
lieve the models we have trained and validated can be
a great starting point.
REFERENCES
Albert, M. S., DeKosky, S. T., Dickson, D., Dubois, B.,
Feldman, H. H., Fox, N. C., Gamst, A., Holtz-
man, D. M., Jagust, W. J., Petersen, R. C., Sny-
der, P. J., Carrillo, M. C., Thies, B., and Phelps,
C. H. (2011). The diagnosis of mild cognitive im-
pairment due to Alzheimers disease: Recommenda-
tions from the National Institute on Aging-Alzheimers
Association workgroups on diagnostic guidelines for
Alzheimer’s disease. Alzheimer’s & Dementia: The
Journal of the Alzheimer’s Association, 7(3):270–279.
Alexander, A. L., Lee, J. E., Lazar, M., and Field, A. S.
(2007). Diffusion tensor imaging of the brain. Neu-
rotherapeutics, 4(3):316–329. 17599699[pmid].
Caruana, R., Niculescu-Mizil, A., Crew, G., and Ksikes, A.
(2004). Ensemble selection from libraries of models.
In Proceedings of the Twenty-first International Con-
ference on Machine Learning, ICML ’04, pages 18–,
New York, NY, USA. ACM.
Ch
´
etelat, G., Landeau, B., Eustache, F., M
´
ezenge, F., Vi-
ader, F., de la Sayette, V., Desgranges, B., and Baron,
J.-C. (2005). Using voxel-based morphometry to map
the structural changes associated with rapid conver-
sion in MCI: a longitudinal MRI study. NeuroImage,
27(4):934–46.
Chua, T. C., Wen, W., Chen, X., Kochan, N., Slavin, M. J.,
Trollor, J. N., Brodaty, H., and Sachdev, P. S. (2009).
Diffusion tensor imaging of the posterior cingulate
is a useful biomarker of mild cognitive impairment.
The American journal of geriatric psychiatry : offi-
cial journal of the American Association for Geriatric
Psychiatry, 17(July):602–613.
Chua, T. C., Wen, W., Slavin, M. J., and Sachdev, P. S.
(2008). Diffusion tensor imaging in mild cognitive
impairment and Alzheimer s disease : a review. Cur-
rent Opinions in Neurology.
Cortes, C. and Vapnik, V. (1995). Support-vector networks.
Mach. Learn., 20(3):273–297.
Crisci, C., Ghattas, B., and Perera, G. (2012). A review
of supervised machine learning algorithms and their
applications to ecological data. Ecological Modelling,
240:113 – 122.
Cui, Y., Sachdev, P. S., Lipnicki, D. M., Jin, J. S., Luo,
S., Zhu, W., Kochan, N. a., Reppermund, S., Liu,
T., Trollor, J. N., Brodaty, H., and Wen, W. (2012a).
Predicting the development of mild cognitive impair-
ment: A new use of pattern recognition. NeuroImage,
60(2):894–901.
Cui, Y., Wen, W., Lipnicki, D. M., Beg, M. F., Jin, J. S.,
Luo, S., Zhu, W., Kochan, N. a., Reppermund, S.,
Zhuang, L., Raamana, R., Liu, T., Trollor, J. N., Wang,
L., Brodaty, H., and Sachdev, P. S. (2012b). Auto-
mated detection of amnestic mild cognitive impair-
ment in community-dwelling elderly adults: A com-
bined spatial atrophy and white matter alteration ap-
proach. NeuroImage, 59(2):1209–1217.
Freund, Y. and Schapire, R. E. (1999). A short introduction
to boosting.
Ganguli, M., Snitz, B. E., Saxton, J. A., Chang, C.-C. H.,
Lee, C.-W., Bilt, J. V., Hughes, T. F., Loewenstein,
ICPRAM 2016 - International Conference on Pattern Recognition Applications and Methods
628

D. A., Unverzagt, F. W., and Petersen, R. C. (2011).
Outcomes of mild cognitive impairment depend on
definition: a population study. Archives of neurology,
68(6):761–767.
Gauthier, S., Reisberg, B., Zaudig, M., Petersen, R. C.,
Ritchie, K., Broich, K., Belleville, S., Brodaty, H.,
Bennett, D., Chertkow, H., Cummings, J. L., de Leon,
M., Feldman, H., Ganguli, M., Hampel, H., Schel-
tens, P., Tierney, M. C., Whitehouse, P., and Winblad,
B. (2006). Mild cognitive impairment. The Lancet,
367(9518):1262 – 1270.
Hall, M., Frank, E., Holmes, G., Pfahringer, B., Reutemann,
P., and Witten, I. H. (2009). The weka data min-
ing software: An update. SIGKDD Explor. Newsl.,
11(1):10–18.
Haller, S., Missonnier, P., Herrmann, F. R., Rodriguez, C.,
Deiber, M.-P., Nguyen, D., Gold, G., Lovblad, K.-O.,
and Giannakopoulos, P. (2013). Individual classifica-
tion of mild cognitive impairment subtypes by support
vector machine analysis of white matter DTI. AJNR.
American journal of neuroradiology, 34(2):283–91.
Hedden, T. and Gabrieli, J. D. E. (2004). Insights into the
ageing mind: a view from cognitive neuroscience. Nat
Rev Neurosci, 5(2):87–96.
Hindmarch, I., Lehfeld, H., de Jongh, P., and Erzigkeit, H.
(1998). The bayer activities of daily living scale (b-
adl). Dementia and Geriatric Cognitive Disorders,
9(suppl 2)(Suppl. 2):20–26.
Hinrichs, C., Singh, V., Xu, G., and Johnson, S. C. (2011).
Predictive markers for AD in a multi-modality frame-
work: An analysis of MCI progression in the ADNI
population. NeuroImage, 55(2):574–589.
Kochan, N. A., Slavin, M. J., Brodaty, H., Crawford, J. D.,
Trollor, J. N., Draper, B., and Sachdev, P. S. (2010).
Effect of Different Impairment Criteria on Prevalence
of “Objective” Mild Cognitive Im-
pairment in a Community Sample. The American
Journal of Geriatric Psychiatry, 18(8):711–722.
Kotsiantis, S. B. (2007). Supervised machine learning:
A review of classification techniques. informatica
31:249268.
Lemm, S., Blankertz, B., Dickhaus, T., and Muller, K.-R.
(2011). Introduction to machine learning for brain
imaging. NeuroImage, 56(2):387 – 399.
Lemos, L., Silva, D., Guerreiro, M., Santana, I., de Men-
dona, A., Toms, P., and Madeira, S. C. (2012). Dis-
criminating alzheimers disease from mild cognitive
impairment using neuropsychological data. KDD
2012.
Liaw, A. and Wiener, M. (2002). Classification and Regres-
sion by randomForest. R News, 2(3):18–22.
Maglogiannis, I. (2007). Emerging Artificial Intelligence
Applications in Computer Engineering: Real World
AI Systems with Applications in EHealth, HCI, Infor-
mation Retrieval and Pervasive Technologies. Fron-
tiers in artificial intelligence and applications. IOS
Press.
Mitchell, A. J. and Shiri-Feshki, M. (2009). Rate of pro-
gression of mild cognitive impairment to dementia
meta-analysis of 41 robust inception cohort studies.
Acta Psychiatrica Scandinavica, 119(4):252–265.
Murthy, S. (1998). Automatic construction of decision trees
from data: A multi-disciplinary survey. Data Mining
and Knowledge Discovery, 2(4):345–389.
Petersen, R. C., Knopman, D. S., Boeve, B. F., Geda, Y. E.,
Ivnik, R. J., Smith, G. E., Roberts, R. O., and Jack,
C. R. (2009). Mild Cognitive Impairment: Ten Years
Later. Archives of neurology, 66(12):1447–1455.
Raamana, P. R., Wen, W., Kochan, N. a., Brodaty, H.,
Sachdev, P. S., Wang, L., and Beg, M. F. (2014). The
sub-classification of amnestic mild cognitive impair-
ment using MRI-based cortical thickness measures.
Frontiers in Neurology, pages 1–10.
Reddy, P., Kochan, N., Brodaty, H., Sachdev, P., Wang, L.,
Beg, M. F., and Wen, W. (2013). Novel ThickNet fea-
tures for the discrimination of amnestic MCI subtypes.
NeuroImage Clinical, 6:284–295.
Reppermund, S., Zhuang, L., Wen, W., Slavin, M. J.,
Trollor, J. N., Brodaty, H., and Sachdev, P. S.
(2014). White matter integrity and late-life depression
in community-dwelling individuals: diffusion tensor
imaging study using tract-based spatial statistics. The
British Journal of Psychiatry, 205:315–320.
Sachdev, P. S., Brodaty, H., Reppermund, S., Kochan,
N. A., Trollor, J. N., Draper, B., Slavin, M. J., Craw-
ford, J., Kang, K., Broe, G. A., Mather, K. A., and
Lux, O. (2010). The sydney memory and ageing study
(mas): methodology and baseline medical and neu-
ropsychiatric characteristics of an elderly epidemio-
logical non-demented cohort of australians aged 7090
years. International Psychogeriatrics, 22:1248–1264.
Sachdev, P. S., Lipnicki, D. M., Crawford, J., Reppermund,
S., Kochan, N. a., Trollor, J. N., Wen, W., Draper,
B., Slavin, M. J., Kang, K., Lux, O., Mather, K. a.,
Brodaty, H., and Team, A. S. (2013a). Factors Pre-
dicting Reversion from Mild Cognitive Impairment to
Normal Cognitive Functioning: A Population-Based
Study. PLoS ONE, 8(3):1–10.
Sachdev, P. S., Zhuang, L., Braidy, N., and Wen, W.
(2013b). Is Alzheimer’s a disease of the white mat-
ter? Curr Opin Psychiatry, 26(3):244–251.
Thillainadesan, S., Wen, W., Zhuang, L., Crawford, J.,
Kochan, N., Reppermund, S., Slavin, M., Trollor, J.,
Brodaty, H., and Sachdev, P. (2012). Changes in
mild cognitive impairment and its subtypes as seen on
diffusion tensor imaging. International Psychogeri-
atrics, 24:1483–1493.
Winblad, B., Palmer, K., Kivipelto, M., Jelic, V.,
Fratiglioni, L., Wahlund, L.-O., Nordberg, A., Bck-
man, L., Albert, M., Almkvist, O., Arai, H., Basun,
H., Blennow, K., De Leon, M., DeCarli, C., Erkin-
juntti, T., Giacobini, E., Graff, C., Hardy, J., Jack, C.,
Jorm, A., Ritchie, K., Van Duijn, C., Visser, P., and
Petersen, R. (2004). Mild cognitive impairment be-
yond controversies, towards a consensus: report of the
international working group on mild cognitive impair-
ment. Journal of Internal Medicine, 256(3):240–246.
Classification of Mild Cognitive Impairment Subtypes using Neuropsychological Data
629
