
OvERVIeW: Ownership Visualization Word Cloud
Ilenia Fronza and Stefano Trebeschi
Free University of Bozen-Bolzano, Piazza Domenicani, 3, 39100, Bolzano, Italy
Keywords:
OvERVIeW, Word Cloud, Visualization, Code Ownership, SVN.
Abstract:
In many situations, awareness about code ownership is important; for example, this awareness might allow
to contact the responsible person(s) of a piece of code to get clarifications. Source versioning systems can
provide information about code ownership. However, the considerable amount of data collected might prolong
the time to retrieve the information needed. OvERVIeW addresses this issue: it collects data from a versioning
system and visualizes developers’ effort using a well-known and intuitive visualization, the word cloud. We
applied pre-attentive processing principles in the designing phase, which use graphical properties (e.g., form
and color) that are processed pre-attentively, i.e., they are understood faster. In our visualization, each word
represents a class; the number of lines added and removed (during a given time period) is used as size metric,
and the color represents the developer(s) working on the code. We show how OvERVIeW can be used to
visualize three different cases of code ownership: collective, weak, and strong. We report a sample application
of OvERVIeW in the context of a multi-developer OSS project.
1 INTRODUCTION
The work of many developers is required to create al-
most any non-trivial piece of code. Large teams face
communication and coordination issues, and split-
ting software development across a distributed team
make it even harder to achieve an integrated prod-
uct (Herbsleb and Grinter, 1999). Open Source
(OSS) projects represent the typical situation where
coordination problems arise, since developers con-
tribute from around the world, meet face-to-face in-
frequently, and need to coordinate virtually (Crow-
ston et al., 2005). For example, the entry barrier is
a problem that has been acknowledged by OSS devel-
opers (Cubranic and Booth, 1999): a newcomer needs
to understand the existing code and read the available
documentation. Usually, this is a very time consum-
ing and tedious task. In this case, information about
code ownership would allow contacting directly the
responsible person(s) of a piece of code in order to get
explanations. To this end, source versioning systems
can provide information about code ownership. How-
ever, the considerable amount of data collected might
prolong the time to retrieve the information needed.
The key to solve these issues, and to promote co-
ordination in general, is increasing the level of aware-
ness; in particular, information of who is changing
what in the system (i.e., code ownership) has been
proposed as a means to increase awareness in the team
(Lanza et al., 2010). To this end, a large number of vi-
sualizations has been proposed in Software Engineer-
ing, mostly to show the evolution of software systems
(Caudwell, 2010; Pinzger et al., 2005; Voinea et al.,
2005; Wettel et al., 2011; Ciani et al., 2015), or de-
velopment effort and authors (D’Ambros et al., 2005;
Lanza et al., 2010; Ogawa and Ma, 2008; Vervloesem,
2010). Visualizations are often taken without any ad-
justments from other disciplines, for which they were
specifically designed, and they do not convey infor-
mation quickly and effectively. The problem is rele-
vant as, if properly designed, visualizations can help
people getting information effectively (Few, 2012;
Fronza, 2013). On the contrary, bad-designed ones
can be confusing.
In this paper, we propose a tool, OvERVIeW, that
provides to the developer an overall understanding of
code ownership in a project. OvERVIeW uses a well-
known and intuitive visualization, the word cloud
(Feinberg, 2010), where: a) each word represents a
class; b) the number of lines added and removed (dur-
ing a given time frame) is used as size metric; and
c) the color represents the developer(s) working on
the code. We used pre-attentive processing principles
(Ware, 2012), so that the observer can get quickly the
information needed. We propose three different code
ownership cases (Fowler, 2006): a) collective, when
each class has been developed by many developers;
Fronza, I. and Trebeschi, S.
OvERVIeW: Ownership Visualization Word Cloud.
In Proceedings of the 18th International Conference on Enterprise Information Systems (ICEIS 2016) - Volume 1, pages 405-412
ISBN: 978-989-758-187-8
Copyright
c
2016 by SCITEPRESS – Science and Technology Publications, Lda. All rights reserved
405
b) weak, when some parts of the system are devel-
oped only by one developer; and c) strong, when each
developer is responsible of a part of the system. A
sample application of OvERVIeW, in the context of
a OSS multi-developer project, shows concretely its
potentials.
The paper is organised as follows: Section 2 dis-
cusses existing works in this area; Section 3 details
the design rationale; Section 4 shows the usage of
OvERVIeW in the context of a multi-developer OSS
project; Section 5 draws conclusions and future work.
2 RELATED WORK
In this Section we provide an overview of the existing
visualizations of development effort; then, we intro-
duce the main principles of data visualization, word
clouds, and their existing applications.
2.1 Visualizing Development Effort
Several visualizations have been proposed to show de-
velopment effort. An overview is provided in (Torn-
hill, 2015), where effort visualizations are proposed
in order to evaluate knowledge drain in a codebase, or
to learn social pitfalls of team work. A spider chart is
used in (Diehl, 2007) to show various software met-
rics, including effort. RUP hump charts are used in
(Heijstek and Chaudron, 2008) to depict effort dis-
tribution through the development process. Fractal
figures are used in (D’Ambros et al., 2005) to show
whether many people contributed to the development
of a class and the intensity of each contribution.
Many tools have been proposed to support the ex-
ploration of code structure, change histories, and so-
cial relationships, as well as to animate a projects his-
tory, such as:
• ProjectWatcher mines changes to the source code
and provides a graph where the color of packages
and classes indicates who edited the class most
recently (Schneider et al., 2004);
• CVSscan shows, at the source code level, how
code changes during the development process
(Voinea et al., 2005);
• StatSVN uses SVN repositories to generate statis-
tics regarding the development process, both for
the overall project and for individual authors (Ja-
son and Gunter, 2006);
• StarGate groups developers in clusters corre-
sponding to the areas of the file repository they
work on the most (Ogawa and Ma, 2008);
• Code Swarm shows the history of commits in a
OSS project as a video (Ogawa and Ma, 2009);
• Gource displays the logs from a version control
system as an animated tree (Caudwell, 2010);
• UrbanIt provides a visualization of software
repositories together with evolutionary analyses
(Ciani et al., 2015).
Still, many of the available visualizations are tech-
nical and some time is needed to understand them cor-
rectly, especially by non-experts in information visu-
alization.
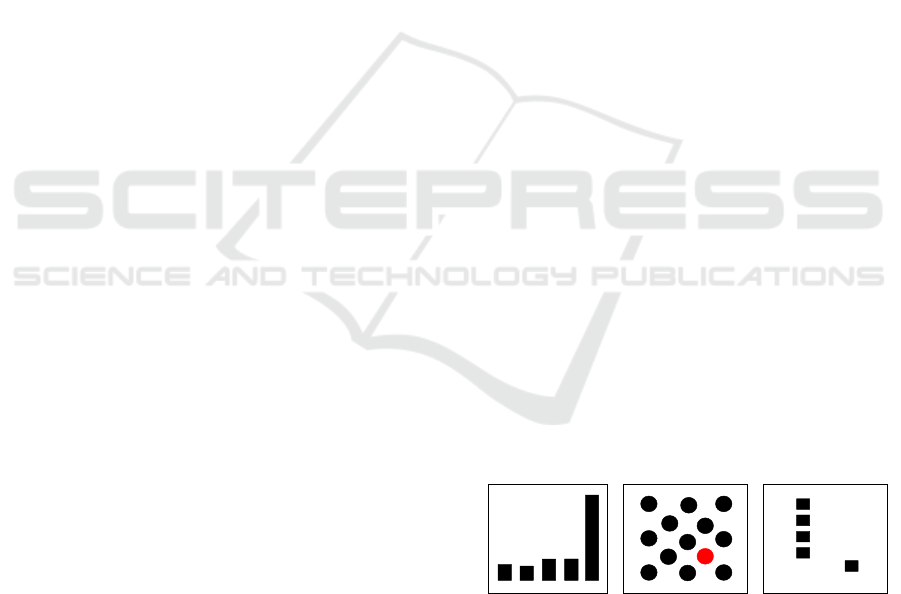
2.2 Principles of Data Visualization
Several studies have demonstrated the importance of
pre-attentive processing, which is the unconscious ac-
cumulation of information from the environment. In
other words, the brain can process the available infor-
mation and filter the relevant message (Few, 2012).
A visualization is well-designed when it is able to in-
duce the viewer’s brain to memorize only the infor-
mation that should be communicated. According to
(Ware, 2012) and (Few, 2013), information visualiza-
tion should consider the following pre-attentive prop-
erties to maximize the understanding of the informa-
tion, to guide attention, and to enhance learning:
• form (i.e., length, width, orientation, shape, size
and enclosure), which is widely applied in data
visualization. The bar chart, for example, pre-
attentively shows data using the length;
• color (and intensity), which is applied to satura-
tion and lightness;
• spatial position, which is the perception of the di-
mensional space, in terms of differences in verti-
cal and in horizontal positions of elements.
Figure 1 shows some examples of these principles.
(a) Form (b) Color (c) Position
Figure 1: Examples of pre-attentive processing principles.
2.3 Word Clouds
Word clouds are graphical representations of word
frequency that present a picture of the most com-
mon words used, with those used more often dis-
played larger. Words are placed in the playing field
(i.e., the space that can be filled by words) which is
ICEIS 2016 - 18th International Conference on Enterprise Information Systems
406
often a cloud, although plenty of shapes are avail-
able. Word clouds are usually colorful, but colors are
meaningless. The key point of this visualization is
its understandability even by non-experts (Feinberg,
2010). For this reason, word clouds have been ap-
plied in a range of fields to provide a quick summary
of texts pulled from, for example, websites and blogs
for different purposes, including sentiment analysis
and market research.
In Software Engineering, word clouds have been
used, for example, for requirements engineering. In
fact, since word clouds are understandable both by
experts and non-experts, they are thought to be an ex-
cellent communication means between customers and
developers. For example, (Delft et al., 2010) shows
an application of word clouds that is built over an au-
tomatic analysis of spreadsheets and text documents.
The user can split and organize concepts, which are
represented by words, in entities. The resulting visu-
alization is a set of word clouds which are graphically
and semantically interconnected. Word clouds have
been also applied to improve the development pro-
cess; Lanza et al. (2010) propose the usage of word
clouds to inform the developer if somebody else has
recently changed one of the classes she/he is currently
working on. The general purpose of this application
of word clouds is to promote the coordination of de-
velopers working on the same piece of code. To the
best of our knowledge, the usage of word clouds to
visualize code ownership is novel in the field.
Despite their wide usage in many disciplines, the
following aspects of word clouds are considered con-
troversial: 1) colors are meaningless, 2) the context is
lost, and 3) random orientation of words makes diffi-
cult to read the graph (Feinberg, 2010; Harris, 2010;
Cui et al., 2010).
3 Designing OvERVIeW
This Section introduces a usage scenario and de-
scribes the design rationale.
3.1 Scenario
Sepp is a programmer and S is a OSS project that he
has just joined. To start his activities, Sepp has been
asked to fix some bugs in S. Now, suppose (not an off
chance) S to be almost undocumented, unstructured,
and poorly written. Sepp starts running the program,
examining the source code, and reading any available
documentation. Then, Sepp uses some tools, such as
source code browsers and static analysers. Sepp is
downhearted, and he decides to ask the developers for
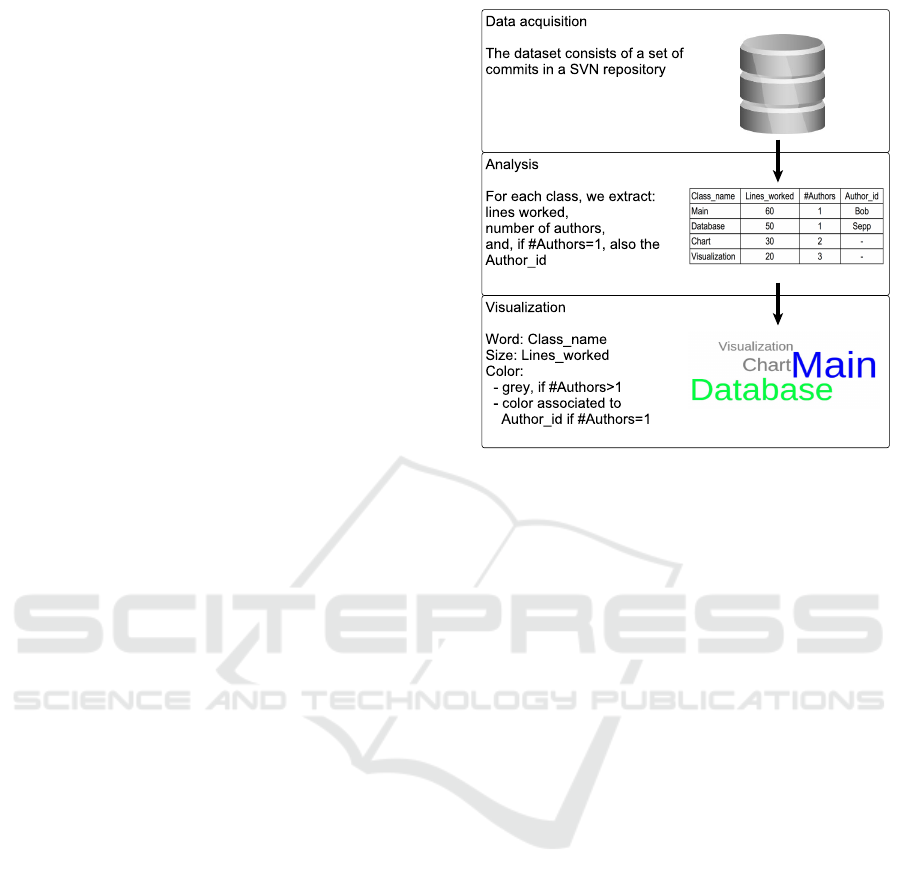
Figure 2: Schema of the proposed approach.
some explanations. To this end, he needs to know
who is responsible of what. Sepp needs to get this
information as quickly as possible, otherwise he will
probably give up and leave the project.
3.2 Design Rationale
To overcome this or similar scenarios, we created
OvERVIeW by addressing the three main steps of
the visualization pipeline reported in (Diehl, 2007):
data acquisition, analysis, and visualization. Figure 2
shows a schematic view of the proposed approach.
3.2.1 Data Acquisition
OvERVIeW extracts a set of commits from a SVN
repository and, from each commit, one or more
unique atomic changes. A change is composed of the
fully qualified name of the class, authors of the com-
mit, the number of lines added, the number of lines
removed, and the timestamp of the commit.
3.2.2 Analysis
The set of changes is restricted to a particular time
frame (e.g., one month) and grouped by class name.
Afterwards, OvERVIeW extracts, for each class:
• Class Name, as the name of the class without its
path;
• Lines Worked (L), as the sum of lines added
and lines removed from the class in each change
(Moser et al., 2008): L =
∑
L
add
+
∑
L
del
;
OvERVIeW: Ownership Visualization Word Cloud
407

• Number of Authors (n
auth
), as the number of dis-
tinct authors that have worked on the class;
• Author IDs, as the ID(s) of the author(s).
3.2.3 Visualization
OvERVIeW generates a word cloud, where each word
is a class name and carries the properties of size and
color. Size is defined as size = f (L), where L are the
lines worked, and f is a positive, discrete, monoton-
ically increasing function. We tested for linear, loga-
rithmic, exponential and square root functions (Fein-
berg, 2010). The latter provided the most appreciable
results. Color is mapped to a categorical colormap
T for a single-developer code, and to grey (i.e., (0.5,
0.5, 0.5) in RGB) otherwise. When a class is asso-
ciated with multiple authors (i.e., it is represented by
a grey color), OvERVIeW stores the list of authors.
To visualize the names of the developers, the user can
click on the class and a message box is superimposed
(Figure 3). To be considered as an author of a class, a
developer must satisfy a minimum threshold in terms
of lines of code developed; this threshold depends on
the type of project, the team and other environmental
factors.
Analyzer
Authors:
dev1, dev2, dev3,
dev5
Figure 3: Message box showing the developers of a class.
The layout of a visualization influences its percep-
tion (Few, 2012; Lohmann et al., 2009). To obtain an
effective design, we addressed the controversial as-
pects of word clouds (Section 2.3) as follows.
Context. Word clouds have been originally cre-
ated for text analysis. Word size represents the fre-
quency of words occurrences. This way, concepts
and themes are completely lost (Harris, 2010; Cui
et al., 2010). Moreover, stop words
1
are simply re-
moved from the visualization, and the meaning of the
text can be modified by this removal. In OvERVIeW,
this problem is solved a priori, since there are no stop
words to be removed, and no themes or context proper
of a natural language.
Shape. In word clouds, words are placed in the
playing field through a randomised greedy algorithm.
Once the word is placed, its position does not change
1
Stop words are words that appear frequently in a nat-
ural language (e.g., “it”, “do”, “not”). They do not have a
meaning themselves, but they assume a meaning when as-
sociated to another word.
and the algorithm checks if that word overlaps an-
other word or crosses the boundaries of the playing
field. If the playing field is too small, most of the
words will fall outside the field. If, on the contrary,
the playing field is too large, the shape will be an in-
coherent blob, as every non-intersecting position will
be acceptable. As a general rule, the playing field
must be large enough to contain at least the largest
word (Feinberg, 2010). In OvERVIeW, the size of
the playing field is fixed. The vector of words sizes
is scaled by a factor α to fit the largest word in the
field. Thus, the proportion among sizes is maintained
and the playing field is fitted. Words in the middle
of the playing field attract more user attention than
those near the borders (Lohmann et al., 2009; Bate-
man et al., 2008). In our case, the observer should
focus on bigger words, as they might represent core
classes. Therefore, OvERVIeW places bigger words
in the center of the playing field.
Orientation. We choose for all the words an hori-
zontal placement, which is the best choice in terms of
readability (Few, 2012).
Colors. Usually, in word clouds colors are mean-
ingless and are used for “aesthetic appeal” (Feinberg,
2010). In OvERVIeW, colors depend on the author(s)
of the class in the given time frame.
To guide the design of OvERVIeW, we used
graphical properties that are processed pre-attentively,
meaning that they are understood faster (Ware, 2012).
Pre-attentive elements have been grouped into: form,
color, motion, spatial position. We decided to use the
following properties in OvERVIeW:
• Form: classes that required more effort (i.e., hav-
ing higher L) are bigger, as the observer should
notice first the parts of the project absorbing
most of the effort, and larger words have been
shown to attract more attention than smaller ones
(Lohmann et al., 2009);
• Spatial Position: larger words are in the center
(Lohmann et al., 2009), as the observer needs to
focus on the parts of the project absorbing most of
the effort;
• Color: different types of code ownership can eas-
ily be recognized using the colors in the word
cloud (Section 3.3).
The following Section explains how OvERVIeW can
be used to show different types of code ownership.
3.3 OvERVIeW in Action
OvERVIeW allows to reason about code ownership in
a software project. Figure 4 shows an example. The
number of lines added and removed (during the given
ICEIS 2016 - 18th International Conference on Enterprise Information Systems
408
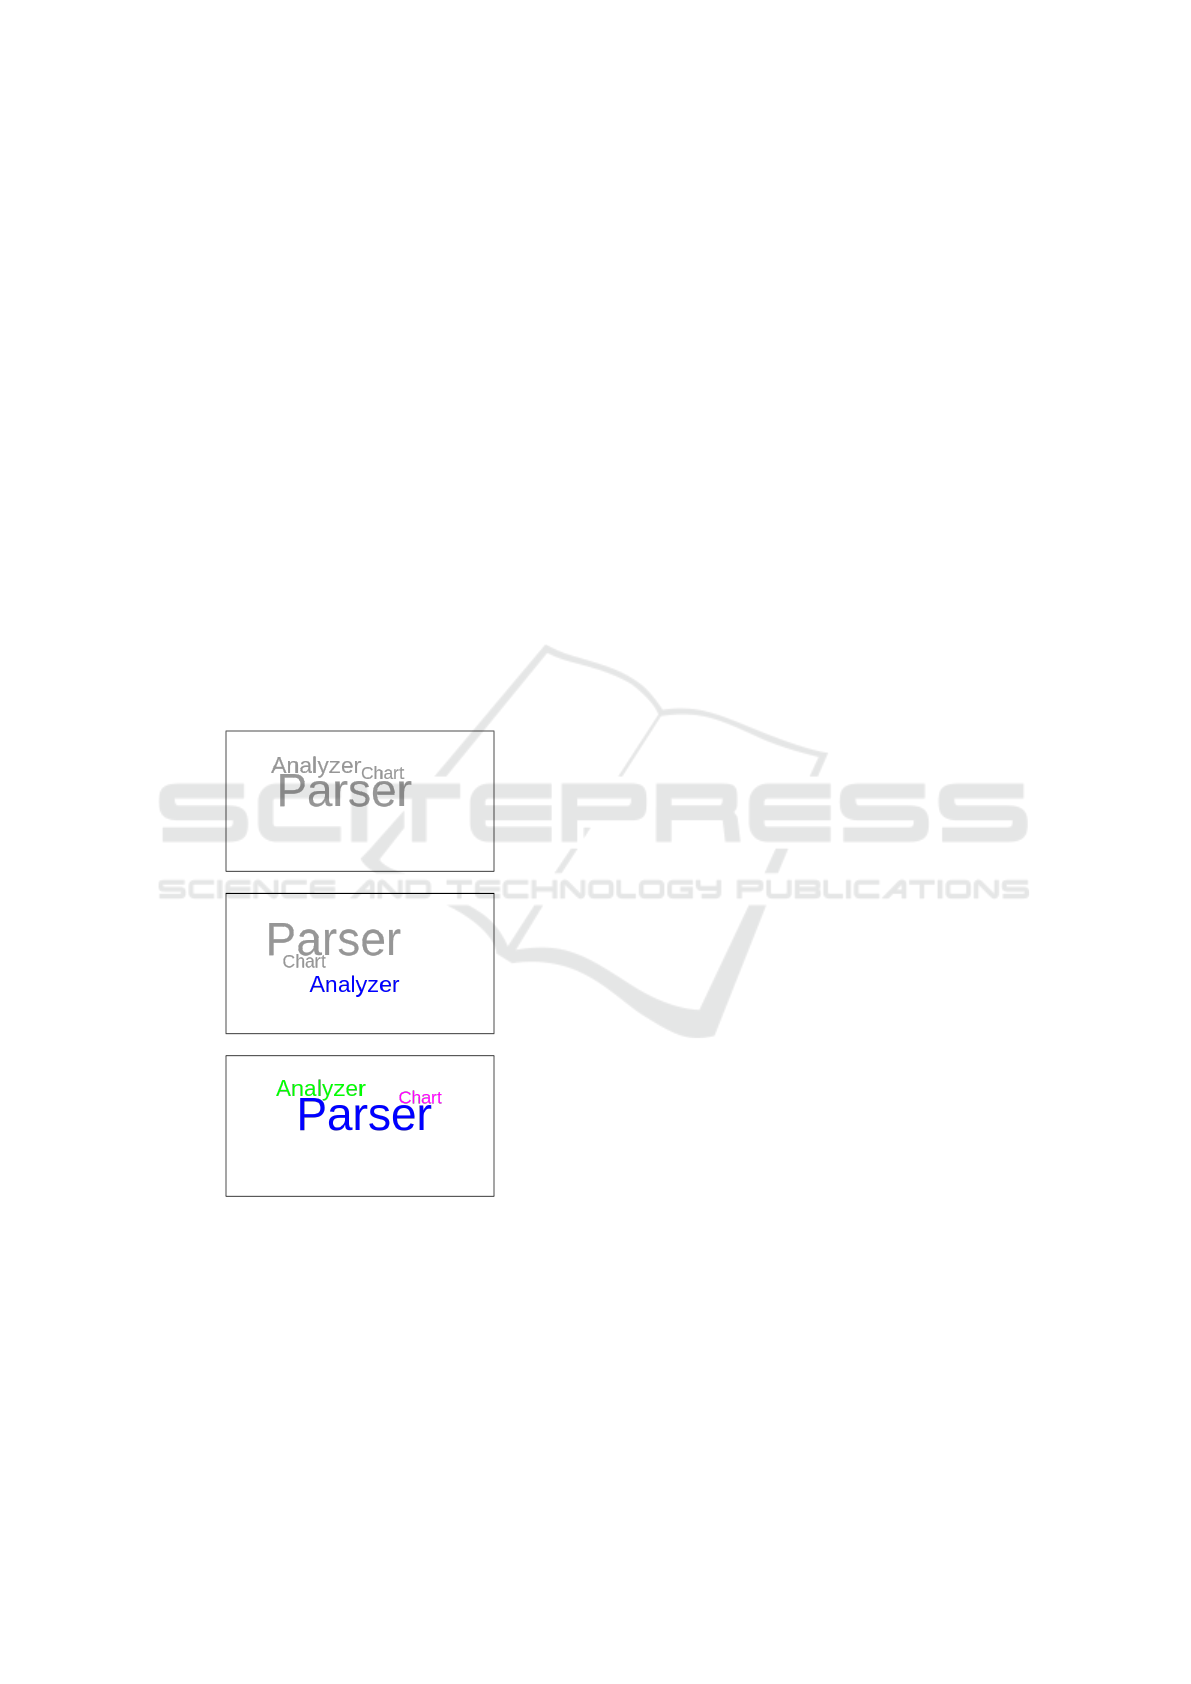
time frame) is used as size metric; each color corre-
sponds to a developer, and a word (i.e., a class) is grey
when more than one developer has worked on it dur-
ing the given time frame. Thus, Figure 4 shows that
the distribution of effort among the classes does not
change in the three cases, as the dimension of words
does not change. The change of colors in the three
cases, instead, allows to recognize the following three
cases of code ownership:
1. Collective. Figure 4(a) is completely grey, mean-
ing that each class has been developed by many
developers.
2. Weak. Figure 4(b) is mostly grey. Most of the
system has been developed by multiple develop-
ers, but part of the code (i.e., “Analyzer”) is owned
only by developer 1, because it is blue;
3. Strong. In Figure 4(c) each developer is respon-
sible of a part of the system: developer 1 works
only on “Parser”, developer 2 works only on “An-
alyzer”, and developer 3 works only on “Chart”.
The three types of code ownership are depicted in Fig-
ure 4.
(a) Collective
(b) Weak
(c) Strong
Figure 4: Sample application of OvERVIeW to show the
three cases of code ownership. The distribution of effort
among the classes does not change in the three cases. The
change of colors allows to recognize three cases of code
ownership.
4 CASE STUDY
In order to show concretely the potentials of
OvERVIeW, we applied it to a OSS project, Epsilon
(http://www.eclipse.org/epsilon/), a framework of the
Eclipse project, which aims at providing consistent
and interoperable languages for MDE tasks. We re-
trieved data from the SVN repository of the Epsilon
project from December 2011 to December 2012. In
December 2011 the project had 2340629 lines of
code; in December 2012 it reached 2385455 lines of
code. Therefore, 44826 lines were added in one year
of activity. In the same period, 3 developers commit-
ted at least once.
We applied OvERVIeW with time frames of 15
days. Figure 5 shows the OvERVIeW word clouds
of different time periods during the analysed year.
In particular, Figure 5(a) shows that only green-
developer and pink-developer were working on the
project during the first two weeks of December 2011.
The names of the classes they are working on sug-
gest their responsibilities. Words like “parser”, “to-
ken”, “lexer”, and “generation” are green; therefore,
we can suppose the green-developer to be responsible
for compilation aspects. This seems to be confirmed
in Figure 5(d) where “AbstractParser” is also green.
Debug analysis and development seem to be done
mostly by the blue-developer, as all the classes related
to these activities are blue in Figure 5(c). Moreover, in
all the word clouds, there are just a few grey classes,
meaning that developers tend not to work on the same
parts of code.
Overall, each developer in Epsilon seems to have
a specific responsibility with respect to a subsystem.
Therefore, this project seems to have a strong code
ownership, in particular if we consider that the four
word clouds have been selected from a time frame of
one year. This excludes the possibility of finding the
developers devoted to one particular task, thus work-
ing on a specific part of the code in that period.
4.1 Qualitative Evaluation
In order to be “useful”, a visualization should con-
vey information in an understandable, effective, easy-
to-remember way. Evaluation is needed to assess the
usefulness of a visualization. Two main types of eval-
uation exist (Diehl, 2007):
• quantitative methods measure properties of the vi-
sualization, of the algorithm, or of the human ob-
server interacting with the visualization. Quanti-
tative evaluation requires a statistical analysis of
the results of a controlled experiment;
• qualitative methods gather data about the individ-
ual experience of human observers with the visu-
alization. When it comes to the human perception
of and interaction with a visualization, qualitative
OvERVIeW: Ownership Visualization Word Cloud
409
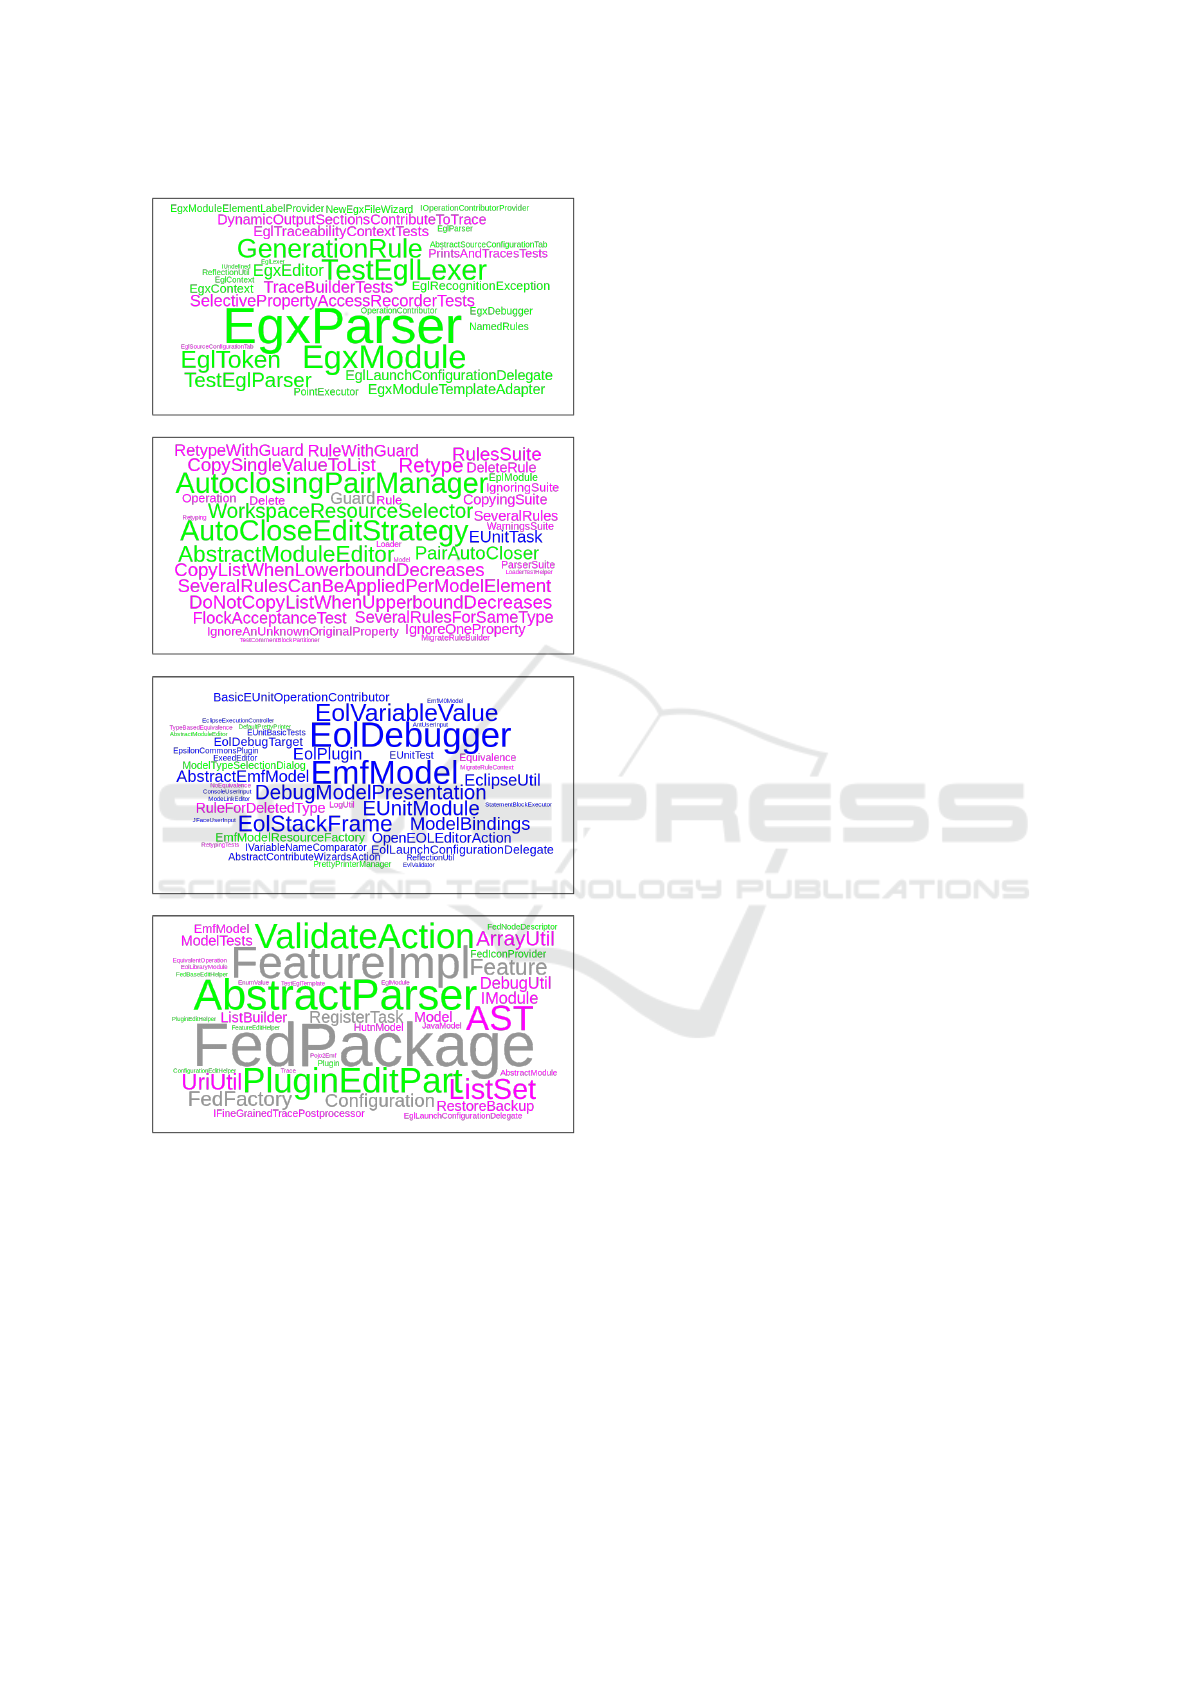
(a) 1-15 December 2011
(b) 5-20 April 2012
(c) 14-28 June 2012
(d) 6-20 September 2012
Figure 5: Example using Epsilon.
evaluation methods are of the outmost importance
for various reasons, including the fact that they
cover more aspects of the visualization. In partic-
ular, “task-oriented” analysis is very popular, be-
cause it provides an answer to a key question from
a user’s point of view: “Does the system solve the
user’s problem?”
In this work we apply qualitative, task-oriented
evaluation to answer the following question from a
user’s point of view: “Does OvERVIeW show effec-
tively the information about code ownership?”. To
this end, we contacted the community of Epsilon to
have a confirmation (or negation) of the information
that we got by looking at the output of OvERVIeW;
this means that we simulated to be a user in front
of the word cloud generated by OvERVIeW. All the
developers confirmed that each of them tends to fo-
cus on certain parts of the code, due to research in-
terests at the time; anyway, they pretty much share
some knowledge of the code. In particular, the green-
developer is the founder of the project; he has written
most of the code, and he has done improvements to
ease the grammar building, and the other two mem-
bers of the community have contributed to it in the
past. The green-developer and the blue-developer did
the first iteration of the debugging facilities; the lat-
ter has added some functionality, such as inspecting
variables and doing step-by-step execution.
5 CONCLUSIONS AND FUTURE
WORK
This paper describes OvERVIeW, a tool to collect
data from a versioning system and to visualize code
ownership using a well-known and intuitive visualiza-
tion, the word cloud. We explained how OvERVIeW
can be used to visualize three different cases of code
ownership: 1) collective, 2) weak, and 3) strong. We
described a sample application of OvERVIeW in the
context of a multi-developer OSS project.
Altogether, we think that OvERVIeW is valu-
able and worth further investigation. Therefore, as
future work we plan to improve the capabilities of
OvERVIeW. For example, in this work the “owner”
of a class is the developer who has been the only one
working on it in the selected time frame. Our defini-
tion of “ownership” should be improved to consider
possible collaborations and pair programming activ-
ities, which are suggested during knowledge trans-
fer to improve productivity and quality (Fronza and
Succi, 2009; Fronza et al., 2011b; di Bella et al.,
2012). Moreover, we will deal with the scalability
of our approach. To this end, we plan to improve
OvERVIeW as follows:
• OvERVIeW should be able to deal with long and
mostly meaningless class names, sometimes oc-
curring in projects. Indeed, the current solution,
which ignores the path name for class names,
might not handle overloaded class names. More-
over, longer names might also receive more user
attention than shorter ones with a similar size met-
ric, because they occupy more space.
ICEIS 2016 - 18th International Conference on Enterprise Information Systems
410

• In the case study shown in this paper, only a lim-
ited number of developers is participating to the
project. Visualizing data of projects with large
teams might result in too colorful graphs. We plan
to consider bigger communities and to be able to
focus on sub-communities in our visualization.
• The trade-offs between stability and visual clutter
should be investigated more formally. In order to
improve the readability of the word clouds, in the
case study of this paper a short period (i.e., two
weeks) was selected, as the team presented a high
level of activity. OvERVIeW should be able to
deal with high levels of activity of the teams.
The word cloud is generated at one point in time.
This steady approach can be expanded by including
time information. Time information can be repre-
sented, for example, by the time elapsed since the
last commit, or the time during which a developer
did not commit at all, or the time in which a code
is handled only by a developer. This would require
a multivariate facet approach, in which it is not suffi-
cient to use a simple transfer function to map only in-
tensity information. The combination of the resulting
tool with a prediction algorithm (Abrahamsson et al.,
2011; Fronza et al., 2011a) would enable to visualize,
e.g., the evolution of effort distribution in the project.
Furthermore, interactive techniques for flexible
word cloud navigation and manipulation should be
considered. For example, the technique used in (Liu
et al., 2014) supports multifaceted viewing of word
clouds .
In this work we applied qualitative, task-oriented
evaluation to understand if OvERVIeW shows infor-
mation effectively and we received positive feedback;
still, evaluation needs to be extended. In particu-
lar, we need to assess if the output of OvERVIeW
is understandable and easy-to-remember. To this
end, we plan to perform an experiment to eval-
uate OvERVIeW by asking developers to perform
some tasks using different visualizations (including
OvERVIeW) and to provide their feedback about
OvERVIeW. Finally, we plan to perform case stud-
ies using more OSS projects. In this context, it would
be useful to collect feedback from users that are living
a scenario such as the one described in Section 3.1.
REFERENCES
Abrahamsson, P., Fronza, I., Moser, R., Vlasenko, J., and
Pedrycz, W. (2011). Predicting development effort
from user stories. In Empirical Software Engineering
and Measurement (ESEM), 2011 International Sym-
posium on, pages 400–403.
Bateman, S., Gutwin, C., and Nacenta, M. (2008). Seeing
things in the clouds: the effect of visual features on
tag cloud selections. In Proceedings of the nineteenth
ACM conference on Hypertext and hypermedia, HT
’08, pages 193–202, New York, NY, USA. ACM.
Caudwell, A. H. (2010). Gource: visualizing software
version control history. In Proceedings of the ACM
international conference companion on Object ori-
ented programming systems languages and applica-
tions companion.
Ciani, A., Minelli, R., Mocci, A., and Lanza, M. (2015).
Urbanit: Visualizing repositories everywhere. In
Software Maintenance and Evolution (ICSME), 2015
IEEE International Conference on, pages 324–326.
Crowston, K., Wei, K., Li, Q., Eseryel, U. Y., and Howi-
son, J. (2005). Coordination of free/libre open source
software development. In In Proceedings of the In-
ternational Conference on Information Systems (ICIS
2005), Las Vegas, pages 181–193.
Cubranic, D. and Booth, K. S. (1999). Coordinating open-
source software development. In Proceedings of the
8th Workshop on Enabling Technologies on Infras-
tructure for Collaborative Enterprises, WETICE ’99,
pages 61–68, Washington, DC, USA. IEEE Computer
Society.
Cui, W., Wu, Y., Liu, S., Wei, F., Zhou, M., and Qu, H.
(2010). Context-preserving, dynamic word cloud vi-
sualization. Computer Graphics and Applications,
IEEE, 30(6):42 –53.
D’Ambros, M., Lanza, M., and Gall, H. (2005). Fractal
figures: Visualizing development effort for CVS enti-
ties. In Proc. Int’l Workshop on Visualizing Software
for Understanding (Vissoft), pages 46–51. IEEE Com-
puter Society Press.
Delft, F., Delft, M., and van Deursen Delft, A. (2010). Im-
proving the requirements process by visualizing end-
user documents as tag clouds. In Proc. of Flexitools
2010.
di Bella, E., Fronza, I., Phaphoom, N., Sillitti, A.,
Succi, G., and Vlasenko, J. (2012). Pair program-
ming and software defects - a large, industrial case
study. IEEE Transactions on Software Engineering,
99(PrePrints):1.
Diehl, S. (2007). Software Visualization: Visualizing
the Structure, Behaviour, and Evolution of Software.
Springer-Verlag New York, Inc., Secaucus, NJ, USA.
Feinberg, J. (2010). Wordle. In Steele, J. and Iliinsky,
N., editors, Beautiful Visualization: Looking at Data
through the Eyes of Experts, chapter 3. O’Reilly Me-
dia.
Few, S. (2012). Show me the numbers : designing tables
and graphs to enlighten. Analytics Press.
Few, S. (2013). Information Dashboard Design: Displaying
data for at-a-glance monitoring. Analytics Press.
Fowler, M. (2006). Code owner-
ship. Retrieved Feb. 10, 2016, from
http://martinfowler.com/bliki/CodeOwnership.html.
Fronza, I. (2013). Opening statement. Cutter IT Journal,
26(1):3–5.
OvERVIeW: Ownership Visualization Word Cloud
411

Fronza, I., Sillitti, A., Succi, G., and Vlasenko, J. (2011a).
Failure prediction based on log files using the cox pro-
portional hazard model. In SEKE, pages 456–461.
Knowledge Systems Institute Graduate School.
Fronza, I., Sillitti, A., Succi, G., and Vlasenko, J. (2011b).
Understanding how novices are integrated in a team
analysing their tool usage. In Proceedings of the
2011 International Conference on Software and Sys-
tems Process, ICSSP ’11, pages 204–207, New York,
NY, USA. ACM.
Fronza, I. and Succi, G. (2009). Modeling spontaneous
pair programming when new developers join a team.
In Abrahamsson, P., Marchesi, M., and Maurer,
F., editors, Proceedings of XP2009, Pula, Sardinia,
Italy, May 25-29, 2009., volume 31 of Lecture Notes
in Business Information Processing, pages 242–244.
Springer.
Harris, J. (2010). Word clouds considered harm-
ful. Nieman Journalism Lab. Retrieved Feb. 10,
2016, from http://www.niemanlab.org/2011/10/word-
clouds-considered-harmful/.
Heijstek, W. and Chaudron, M. (2008). Evaluating rup soft-
ware development processes through visualization of
effort distribution. In Software Engineering and Ad-
vanced Applications, 2008. SEAA ’08. 34th Euromicro
Conference, pages 266 –273.
Herbsleb, J. D. and Grinter, R. E. (1999). Splitting the or-
ganization and integrating the code: Conway’s law re-
visited. In Proceedings of the 21st international con-
ference on Software engineering, ICSE ’99, pages 85–
95, New York, NY, USA. ACM.
Jason, K. and Gunter, M. (2006). Statsvn: Statistics for
svn repositories based on the open source project
statcvs. in CSI5140, Winter 2006, Available from:
http://www.statsvn.org/.
Lanza, M., Hattori, L., and Guzzi, A. (2010). Supporting
collaboration awareness with real-time visualization
of development activity. In In Proceedings of CSMR
2010 (14th IEEE European Conference on Software
Maintenance and Reengineering. IEEE CS Press.
Liu, X., Shen, H.-W., and Hu, Y. (2014). Supporting mul-
tifaceted viewing of word clouds with focus+context
display. Information Visualization.
Lohmann, S., Ziegler, J., and Tetzlaff, L. (2009). Com-
parison of tag cloud layouts: Task-related perfor-
mance and visual exploration. In Proceedings of the
12th IFIP TC 13 International Conference on Human-
Computer Interaction: Part I, INTERACT ’09, pages
392–404, Berlin, Heidelberg. Springer-Verlag.
Moser, R., Pedrycz, W., and Succi, G. (2008). A compar-
ative analysis of the efficiency of change metrics and
static code attributes for defect prediction. In Proceed-
ings of the 30th international conference on Software
engineering, ICSE ’08, pages 181–190, New York,
NY, USA. ACM.
Ogawa, M. and Ma, K.-L. (2008). Stargate: A unified, inter-
active visualization of software projects. In Visualiza-
tion Symposium, 2008. PacificVIS ’08. IEEE Pacific,
pages 191 –198.
Ogawa, M. and Ma, K.-L. (2009). code swarm: A de-
sign study in organic software visualization. IEEE
Transactions on Visualization and Computer Graph-
ics, 15(6):1097–1104.
Pinzger, M., Gall, H., Fischer, M., and Lanza, M. (2005).
Visualizing multiple evolution metrics. In Proceed-
ings of the 2005 ACM symposium on Software visu-
alization, SoftVis ’05, pages 67–75, New York, NY,
USA. ACM.
Schneider, K. A., Gutwin, C., Penner, R., and Paquette, D.
(2004). Mining a software developers local interaction
history. In In Proceedings of the International Work-
shop on Mining Software Repositories, pages 106–
110.
Tornhill, A. (2015). Your Code as a Crime Scene: Use
Forensic Techniques to Arrest Defects, Bottlenecks,
and Bad Design in Your Programs. Pragmatic Book-
shelf.
Vervloesem, K. (2010). Visualizing open source
projects and communities. LWN.net. Linux info
from the source. Retrieved Feb. 5, 2016, from
https://lwn.net/Articles/382468/.
Voinea, L., Telea, A., and van Wijk, J. J. (2005). Cvss-
can: visualization of code evolution. In Proceedings
of the 2005 ACM symposium on Software visualiza-
tion, SoftVis ’05, pages 47–56, New York, NY, USA.
ACM.
Ware, C. (2012). Information Visualization: Perception for
Design. Interactive Technologies. Elsevier Science.
Wettel, R., Lanza, M., and Robbes, R. (2011). Software sys-
tems as cities: a controlled experiment. In Proceed-
ings of the 33rd International Conference on Software
Engineering, ICSE ’11, pages 551–560, New York,
NY, USA. ACM.
ICEIS 2016 - 18th International Conference on Enterprise Information Systems
412
